REVIEW 3 major objections 5 minor 1 cited by
Lightspeed Geometric Dataset Distance via Sliced Optimal Transport
T0 review · 3 major / 5 minor · reviewed 2026-08-09 · deepseek-v4-flash
Pith's one-line read Dataset distance runs near-linearly via sliced optimal transport
desk verdict The scaling idea and empirical results are real, but the metric proof is broken as stated: finite moments do not determine a distribution, so s-OTDD with k=5 is not a guaranteed metric. read the letter →
The pith
A machine-rendered reading of the paper's core claim, the machinery that carries it, and where it could break.
The reading
What carries the argument
The load-bearing object is the data point projection $\mathrm{DP}^k$, built from a feature projection and $k$ Moment Transform Projections. For a label $q_y$, MTP first pushes the label's feature distribution onto a line through $FP_\theta$ and then records the scaled moment $\mathbb{E}[(FP_\theta(X))^\lambda]/\lambda!$, so the label becomes a vector of scalar moments. The data point projection is a weighted sum of one feature projection and $k$ such label moments, yielding one real number per data point; when the feature projection and MTP are injective, the push-forward of a dataset's empirical distribution through $\mathrm{DP}^k$ is injective, which is exactly what turns the expected sliced Wasserstein distance into a metric rather than just a dissimilarity score.
What would settle it
Build two discrete label distributions, realized as empirical class-conditional feature distributions, that share all projected moments of order 1 through 5 for every direction $\theta$ but differ at order 6, and pair them with identical feature distributions; then s-OTDD with $k=5$ would return zero even though the datasets differ, contradicting the identity-of-indiscernibles part of the metric claim.
Extended reading notes
Core claim
The central claim is that a label, viewed as a distribution over feature vectors, can be compressed to a handful of scalars via Moment Transform Projection without losing the information needed for dataset comparison, and that combining those scalars with a feature projection maps each data point to a real number. The sliced optimal transport dataset distance is then the expected one-dimensional Wasserstein distance between the projected empirical distributions of two datasets, averaging over random projection directions, moment orders, and weights. The paper proves that s-OTDD is a valid metric on $\mathcal{P}(\mathcal{X} \times \mathcal{P}(\mathcal{X}))$ whenever this data-point projection is injective, and shows that the Monte Carlo estimate has error $O(L^{-1/2})$ with $O(L(n\log n + dn))$ time and $O(L(d+n))$ memory.
Load-bearing premise
The metric claim collapses if the moment-based label projection is not one-to-one, and the paper's injectivity proof requires moment conditions—infinitely many moments with an existing moment-generating function, or finitely many moments with positive-definite Hankel matrices and a growth bound—that are not verified on any real dataset.
Editorial extensions
If this is right
- Both time and memory stay independent of the number of classes, so class imbalance and large label sets do not inflate the cost.
- The one-dimensional Wasserstein computation uses sorting, so the distance can be computed in $O(Ln\log n)$ time after an $O(Lnd)$ projection pass, and each dataset's projections can be reused.
- The Monte Carlo estimate converges at rate $O(L^{-1/2})$, so increasing the projection count predictably improves the approximation.
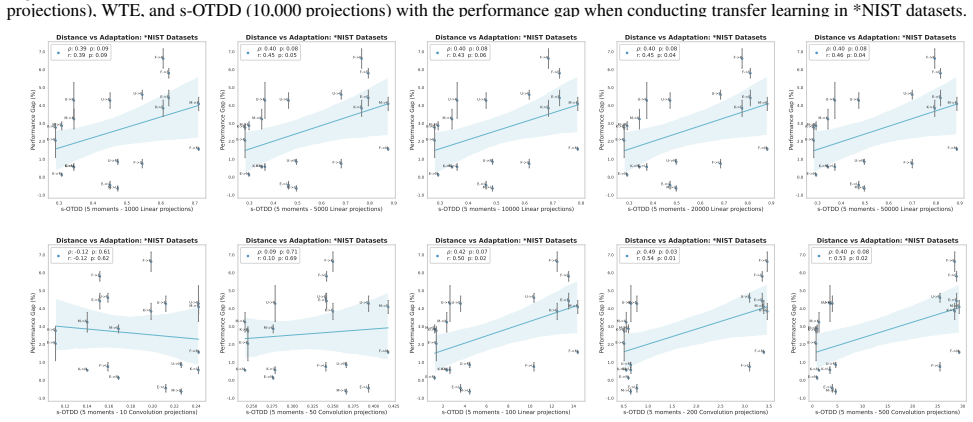
- On MNIST and CIFAR10, s-OTDD's rankings correlate strongly with exact OTDD, and in transfer-learning and data-augmentation experiments it tracks performance gaps at a fraction of the runtime.
- The construction handles disjoint label sets, because labels are represented as feature distributions rather than shared identifiers.
Reading between the lines
- The injectivity result suggests that any injective scalarization of the label distribution would yield a valid sliced dataset distance, so MTP is one instance of a broader recipe rather than the only possible choice.
- Because the cost is independent of class count, the method is attractive for federated or continually growing label sets, though the paper does not run those experiments.
- For practitioners, the finite-$k$ choice means s-OTDD should be treated as an ordinal ranking score unless the moment conditions are verified, since the formal metric guarantee is conditional on injectivity.
- A direct testable extension would check whether s-OTDD rankings stay monotone under controlled label shifts, such as swapping labels or adding a rare class, against OTDD on the same dataset pairs.
Editorial analysis
A structured set of objections, weighed in public.
Referee Report
Summary. The paper proposes sliced optimal transport dataset distance (s-OTDD), a training-free dataset distance. The key idea is to map each class label, viewed as a distribution over features, to a scalar through Moment Transform Projection (MTP), combine several such scalars with a feature projection to map each data point to a real number, and then define the dataset distance as the expected one-dimensional Wasserstein distance between the resulting projected empirical distributions over random projection parameters. The paper claims that s-OTDD is a valid metric on distributions over feature/label-distribution pairs, has near-linear time and memory complexity independent of the number of classes, and correlates well with exact OTDD, transfer-learning performance gaps, and augmentation accuracy. Experiments on MNIST, CIFAR10, NIST, text datasets, and Tiny-ImageNet support the empirical claims, and code is released. The main theoretical claim of metricity, however, is not supported as stated because the finite-moment injectivity argument in Proposition 1 is false and the proof of Proposition 2 contains an invalid zero-expectation-to-almost-sure step.
Significance. If the theoretical claims were correct, s-OTDD would be a valuable scalable alternative to OTDD, and the released code plus the near-linear complexity are genuine strengths. The empirical results, such as Spearman correlations around 0.90-0.93 with exact OTDD on MNIST/CIFAR10 subsets and transfer-learning correlations comparable to OTDD at lower cost, suggest practical utility independent of the metricity question. However, the central theoretical contribution is currently unsupported: finite moments do not identify distributions, and the passage from zero expectation to equality for all projection parameters is not justified. The paper needs a substantive correction of the metric claim, either by proving a correct version under appropriate assumptions (e.g., for finitely supported empirical measures with a sufficient number of moments) or by explicitly presenting s-OTDD as a pseudometric whose empirical utility is separate from metricity.
major comments (3)
- [Section 3.1, Proposition 1(2), and Appendix A.1] The finite-moment injectivity claim is false. Finitely many moments never determine a distribution, even when the truncated Hankel matrices are positive definite and the moment-growth bound holds; Hamburger uniqueness requires the full infinite moment sequence. A concrete counterexample is to take μ uniform on [0,1] and ν with Lebesgue density 1 + ε P_6^*(x), where P_6^* is the degree-6 shifted Legendre polynomial scaled to satisfy |P_6^*| ≤ 1 and ε ∈ (0,1). Then ν is a probability density, its first five moments agree with those of μ while the sixth moment differs, and for sufficiently small ε the finite Hankel matrices are positive definite and the stated growth bound holds. Hence MTP is not injective for finite Λ, the premise of Corollary 1 fails, and Proposition 2's identity-of-indiscernibles is false for such pairs. In particular, the λmax-capped version explicitly offered in Section 3.3 cannot be a metric, and the zero-truncated-Poisson implementation used in Section 4 is not covered by the finite-Λ proof (nor are the required MGF/injectivity conditions verified there).
- [Appendix A.2, proof of Proposition 2] The step 's-OTDD = 0 implies W_p^p(...) = 0 for all ψ, θ, λ, φ' is not justified. For a nonnegative random variable, zero expectation only implies almost-sure equality under the projection distribution; one cannot conclude equality for every parameter value without an additional argument such as continuity of the integrand together with full support, or an almost-sure injectivity statement. This is a second, independent gap in the metricity proof, and it remains even if MTP were injective.
- [Section 3.2, Corollary 1] The injectivity of the data point projection is asserted without a proof in the appendix, and it is load-bearing for the metric claim. Please provide a self-contained proof or a precise pointer to the exact theorem in Nguyen and Ho (2024), and verify that the convolution feature projection used for CIFAR10 and Tiny-ImageNet satisfies the required injectivity condition. The current dependence on an unstated assumption is not acceptable for the central theoretical contribution.
minor comments (5)
- [Definition 4 vs. Proposition 2] Definition 4 defines s-OTDD_p^p as an expectation, while Proposition 2 and its proof treat s-OTDD_p as the p-th root of that expectation; the notation should be aligned throughout.
- [Appendix A.2] In the triangle-inequality display, the first term on the right-hand side is written as W_p^p(DP PD3, DP PD2); it should be W_p^p(DP PD1, DP PD3).
- [Algorithm 1] The pseudocode for the data point projection uses ψ(k) where Definition 3 requires ψ(i′+1), and the loop 'for i = j to m' should be 'for j = 1 to m'; these typos make the algorithm inconsistent with the definition.
- [Appendix A.1, Proposition 1(2)] The displayed Hankel matrices contain entries m_{θ,μ,0} in row/column positions that do not follow the stated λmax pattern; the matrix display should be corrected.
- [Throughout] There are numerous typographical errors ('dicuss', 'Monte Caro', 'anaylsis', 'scability', 'Thabks') that should be cleaned up before publication.
Circularity Check
No significant circularity: s-OTDD is a new projection-based dataset distance whose metric claim is conditional on an attempted injectivity proof, not on fitted parameters or a self-citation loop.
full rationale
The s-OTDD (Definition 4) is defined directly as an expected W_p distance between one-dimensional projections of dataset empirical distributions; no constant is fitted to OTDD, transfer gaps, or augmentation accuracy, so the empirical correlations are genuine outputs. The metricity claim (Proposition 2) is conditional on injectivity of the data point projection, and the paper attempts to establish that injectivity via moment determinacy (Proposition 1) and a composition argument citing Nguyen & Ho (2024). The cited composition result is independent prior work with its own proof and does not assume the present target result, so it does not make the derivation circular. The finite-moment branch of Proposition 1 appears mathematically doubtful (finitely many moments never uniquely determine a distribution, so the k=5 setting may not yield a true metric), but that is a correctness risk rather than a circularity: the claim does not reduce by construction to its inputs. No self-definitional, fitted-input, or renamed-known-result step was found.
Assumptions & free parameters
free parameters (4)
- Number of moments k =
5
- Truncated Poisson rate parameters r_1..r_k =
1,2,3,4,5
- Number of projections L =
10,000 (most experiments); 100,000 (augmentation); 500,000 (Tiny-ImageNet)
- Feature projection family =
Radon for NIST/text; convolution for CIFAR/Tiny-ImageNet
assumptions (5)
- domain assumption Assumption 1: all projected scaled moments of the relevant distributions are finite.
- standard math The feature projection F P_theta is injective on the space of relevant distributions (e.g., Radon transform injectivity).
- domain assumption Moment sequences uniquely determine the projected distribution: either MGFs exist (condition 1) or Hankel matrices are positive definite with growth condition (condition 2).
- standard math The data point projection inherits injectivity from MTP and feature projection via hierarchical hybrid projection (Nguyen and Ho, 2024).
- domain assumption A label can be represented as the conditional distribution of features given that label, and dataset distance is computed on the joint distribution of features and label-distributions.
Cite this review
Pith. "Pith review of Lightspeed Geometric Dataset Distance via Sliced Optimal Transport." pith.science (2026). https://pith.science/paper/YSD54K7X
@misc{pith2026250118901,
  author       = {Pith},
  title        = {Pith review of: Lightspeed Geometric Dataset Distance via Sliced Optimal Transport},
  year         = {2026},
  howpublished = {\url{https://pith.science/paper/YSD54K7X}},
  note         = {Machine review of arXiv:2501.18901}
}
read the original abstract
We introduce sliced optimal transport dataset distance (s-OTDD), a model-agnostic, embedding-agnostic approach for dataset comparison that requires no training, is robust to variations in the number of classes, and can handle disjoint label sets. The core innovation is Moment Transform Projection (MTP), which maps a label, represented as a distribution over features, to a real number. Using MTP, we derive a data point projection that transforms datasets into one-dimensional distributions. The s-OTDD is defined as the expected Wasserstein distance between the projected distributions, with respect to random projection parameters. Leveraging the closed form solution of one-dimensional optimal transport, s-OTDD achieves (near-)linear computational complexity in the number of data points and feature dimensions and is independent of the number of classes. With its geometrically meaningful projection, s-OTDD strongly correlates with the optimal transport dataset distance while being more efficient than existing dataset discrepancy measures. Moreover, it correlates well with the performance gap in transfer learning and classification accuracy in data augmentation.
Figures


Figures from the paper (9 more)



Forward citations
Cited by 1 Pith paper
-
Rethinking Transfer in Continual Learning: A Replay-Based Realisation
In continual learning, forward transfer requires target headroom, a persistent carrier, and a compatible source; routing replay by gradient signatures improves accuracy and stability over uniform replay.
Reference graph
Works this paper leans on
-
[1]
Achille, A., Lam, M., Tewari, R., Ravichandran, A., Maji, S., Fowlkes, C. C., Soatto, S., and Perona, P. Task2vec: Task embedding for meta-learning. In Proceedings of the IEEE/CVF international conference on computer vision, pp.\ 6430--6439, 2019
work page 2019
-
[2]
Near-linear time approximation algorithms for optimal transport via S inkhorn iteration
Altschuler, J., Niles-Weed, J., and Rigollet, P. Near-linear time approximation algorithms for optimal transport via S inkhorn iteration. In Advances in Neural Information Processing Systems, pp.\ 1964--1974, 2017
work page 1964
-
[3]
Alvarez-Melis, D. and Fusi, N. Geometric dataset distances via optimal transport. Advances in Neural Information Processing Systems, 33: 0 21428--21439, 2020
work page 2020
-
[4]
Alvarez-Melis, D. and Fusi, N. Dataset dynamics via gradient flows in probability space. In International conference on machine learning, pp.\ 219--230. PMLR, 2021
work page 2021
-
[5]
Analysis of representations for domain adaptation
Ben-David, S., Blitzer, J., Crammer, K., and Pereira, F. Analysis of representations for domain adaptation. Advances in neural information processing systems, 19, 2006
2006
-
[6]
Boedihardjo, M. T. Sharp bounds for max-sliced wasserstein distances. Foundations of Computational Mathematics, pp.\ 1--32, 2025
work page 2025
-
[7]
Hyperbolic sliced- W asserstein via geodesic and horospherical projections
Bonet, C., Chapel, L., Drumetz, L., and Courty, N. Hyperbolic sliced- W asserstein via geodesic and horospherical projections. In Topological, Algebraic and Geometric Learning Workshops 2023, pp.\ 334--370. PMLR, 2023
work page 2023
-
[8]
Sliced-Wasserstein Distances and Flows on Cartan-Hadamard Manifolds
Bonet, C., Drumetz, L., and Courty, N. Sliced- W asserstein distances and flows on C artan- H adamard manifolds. arXiv preprint arXiv:2403.06560, 2024
work page Pith review arXiv 2024
Show all 53 references
-
[9]
Sliced and R adon W asserstein barycenters of measures
Bonneel, N., Rabin, J., Peyr \'e , G., and Pfister, H. Sliced and R adon W asserstein barycenters of measures. Journal of Mathematical Imaging and Vision, 1 0 (51): 0 22--45, 2015
2015
-
[10]
Chihara, T. S. An introduction to orthogonal polynomials. Courier Corporation, 2011
2011
-
[11]
Cohen, A. C. Estimating the parameter in a conditional poisson distribution. Biometrics, 16 0 (2): 0 203--211, 1960
1960
-
[12]
Cox, T. F. and Cox, M. A. Multidimensional scaling. CRC press, 2000
2000
-
[13]
Sinkhorn distances: Lightspeed computation of optimal transport
Cuturi, M. Sinkhorn distances: Lightspeed computation of optimal transport. In Advances in Neural Information Processing Systems, pp.\ 2292--2300, 2013
2013
-
[14]
The mnist database of handwritten digit images for machine learning research [best of the web]
Deng, L. The mnist database of handwritten digit images for machine learning research [best of the web]. IEEE signal processing magazine, 29 0 (6): 0 141--142, 2012
2012
-
[15]
and Chaudhari, P
Gao, Y. and Chaudhari, P. An information-geometric distance on the space of tasks. In International Conference on Machine Learning, pp.\ 3553--3563. PMLR, 2021
2021
-
[16]
C., Harris, T., Wang, Z., and Li, B
Garrett, R. C., Harris, T., Wang, Z., and Li, B. Validating climate models with spherical convolutional W asserstein distance. In The Thirty-eighth Annual Conference on Neural Information Processing Systems, 2024. URL https://openreview.net/forum?id=mmSFfib6pI
2024
-
[17]
The joint effect of task similarity and overparameterization on catastrophic forgetting an analytical model
Goldfarb, D., Evron, I., Weinberger, N., Soudry, D., and HAnd, P. The joint effect of task similarity and overparameterization on catastrophic forgetting an analytical model. In The Twelfth International Conference on Learning Representations, 2024
2024
-
[18]
Deep residual learning for image recognition
He, K., Zhang, X., Ren, S., and Sun, J. Deep residual learning for image recognition. In Proceedings of the IEEE Conference on Computer Vision and Pattern Recognition, pp.\ 770--778, 2016
2016
-
[19]
The R adon transform on r n
Helgason, S. The R adon transform on r n. In Integral Geometry and Radon Transforms, pp.\ 1--62. Springer, 2011
2011
-
[20]
Continual learning of a mixed sequence of similar and dissimilar tasks
Ke, Z., Liu, B., and Huang, X. Continual learning of a mixed sequence of similar and dissimilar tasks. Advances in neural information processing systems, 33: 0 18493--18504, 2020
2020
-
[21]
F., and Talwalkar, A
Khodak, M., Balcan, M.-F. F., and Talwalkar, A. S. Adaptive gradient-based meta-learning methods. Advances in Neural Information Processing Systems, 32, 2019
2019
-
[22]
K., and Hoffmann, H
Kolouri, S., Naderializadeh, N., Rohde, G. K., and Hoffmann, H. W asserstein embedding for graph learning. In International Conference on Learning Representations, 2021. URL https://openreview.net/forum?id=AAes_3W-2z
2021
-
[23]
Learning multiple layers of features from tiny images
Krizhevsky, A., Hinton, G., et al. Learning multiple layers of features from tiny images. Master's thesis, Department of Computer Science, University of Toronto, 2009
2009
-
[24]
and Yang, X
Le, Y. and Yang, X. Tiny imagenet visual recognition challenge. CS 231N, 7 0 (7): 0 3, 2015
2015
-
[25]
Gradient-based learning applied to document recognition
LeCun, Y., Bottou, L., Bengio, Y., and Haffner, P. Gradient-based learning applied to document recognition. Proceedings of the IEEE, 86 0 (11): 0 2278--2324, 1998
1998
-
[26]
Continual learning in the teacher-student setup: Impact of task similarity
Lee, S., Goldt, S., and Saxe, A. Continual learning in the teacher-student setup: Impact of task similarity. In International Conference on Machine Learning, pp.\ 6109--6119. PMLR, 2021
2021
-
[27]
and Brazdil, P
Leite, R. and Brazdil, P. Predicting relative performance of classifiers from samples. In Proceedings of the 22nd international conference on machine learning, pp.\ 497--503, 2005
2005
-
[28]
Sliced- W asserstein estimation with spherical harmonics as control variates
Leluc, R., Dieuleveut, A., Portier, F., Segers, J., and Zhuman, A. Sliced- W asserstein estimation with spherical harmonics as control variates. In Proceedings of the 41st International Conference on Machine Learning, 2024
2024
-
[29]
Hilbert curve projection distance for distribution comparison
Li, T., Meng, C., Yu, J., and Xu, H. Hilbert curve projection distance for distribution comparison. arXiv preprint arXiv:2205.15059, 2022
2022 arXiv
-
[30]
W asserstein task embedding for measuring task similarities
Liu, X., Bai, Y., Lu, Y., Soltoggio, A., and Kolouri, S. W asserstein task embedding for measuring task similarities. Neural Networks, 181: 0 106796, 2025
2025
-
[31]
Minimax confidence intervals for the sliced W asserstein distance
Manole, T., Balakrishnan, S., and Wasserman, L. Minimax confidence intervals for the sliced W asserstein distance. Electronic Journal of Statistics, 16 0 (1): 0 2252--2345, 2022
2022
-
[32]
Domain adaptation: Learning bounds and algorithms
Mansour, Y., Mohri, M., and Rostamizadeh, A. Domain adaptation: Learning bounds and algorithms. arXiv preprint arXiv:0902.3430, 2009
2009 arXiv
-
[33]
Statistical and topological properties of sliced probability divergences
Nadjahi, K., Durmus, A., Chizat, L., Kolouri, S., Shahrampour, S., and Simsekli, U. Statistical and topological properties of sliced probability divergences. Advances in Neural Information Processing Systems, 33: 0 20802--20812, 2020
2020
-
[34]
and Ho, N
Nguyen, K. and Ho, N. Revisiting sliced W asserstein on images: From vectorization to convolution. Advances in Neural Information Processing Systems, 2022
2022
-
[35]
and Ho, N
Nguyen, K. and Ho, N. Sliced W asserstein estimator with control variates. International Conference on Learning Representations, 2023
2023
-
[36]
and Ho, N
Nguyen, K. and Ho, N. Hierarchical hybrid sliced W asserstein: A scalable metric for heterogeneous joint distributions. Advances in neural information processing systems, 2024
2024
-
[37]
and Mueller, P
Nguyen, K. and Mueller, P. Summarizing B ayesian nonparametric mixture posterior - sliced optimal transport metrics for G aussian mixtures. arXiv preprint arXiv:2411.14674, 2024
2024 arXiv
-
[38]
Quasi-monte carlo for 3d sliced W asserstein
Nguyen, K., Bariletto, N., and Ho, N. Quasi-monte carlo for 3d sliced W asserstein. In The Twelfth International Conference on Learning Representations, 2024
2024
-
[39]
Statistical, robustness, and computational guarantees for sliced W asserstein distances
Nietert, S., Sadhu, R., Goldfeld, Z., and Kato, K. Statistical, robustness, and computational guarantees for sliced W asserstein distances. Advances in Neural Information Processing Systems, 2022
2022
-
[40]
and Cuturi, M
Peyré, G. and Cuturi, M. Computational optimal transport, 2020
2020
-
[41]
Sliced optimal transport on the sphere
Quellmalz, M., Beinert, R., and Steidl, G. Sliced optimal transport on the sphere. Inverse Problems, 39 0 (10): 0 105005, 2023
2023
-
[42]
Parallelly sliced optimal transport on spheres and on the rotation group
Quellmalz, M., Buecher, L., and Steidl, G. Parallelly sliced optimal transport on spheres and on the rotation group. arXiv preprint arXiv:2401.16896, 2024
2024 arXiv
-
[43]
Wasserstein barycenter and its application to texture mixing
Rabin, J., Peyr \'e , G., Delon, J., and Bernot, M. Wasserstein barycenter and its application to texture mixing. In Scale Space and Variational Methods in Computer Vision: Third International Conference, SSVM 2011, Ein-Gedi, Israel, May 29--June 2, 2011, Revised Selected Pape...
2011
-
[44]
and Simon, B
Reed, M. and Simon, B. II: Fourier analysis, self-adjointness, volume 2. Elsevier, 1975
1975
-
[45]
Otce: A transferability metric for cross-domain cross-task representations
Tan, Y., Li, Y., and Huang, S.-L. Otce: A transferability metric for cross-domain cross-task representations. In Proceedings of the IEEE/CVF conference on computer vision and pattern recognition, pp.\ 15779--15788, 2021
2021
-
[46]
T., Nguyen, C
Tran, A. T., Nguyen, C. V., and Hassner, T. Transferability and hardness of supervised classification tasks. In Proceedings of the IEEE/CVF International Conference on Computer Vision, pp.\ 1395--1405, 2019
2019
-
[47]
D., and Kolouri, S
Tran, H., Bai, Y., Kothapalli, A., Shahbazi, A., Liu, X., Martin, R. D., and Kolouri, S. Stereographic spherical sliced W asserstein distances. International Conference on Machine Learning, 2024
2024
-
[48]
Optimal transport: old and new, volume 338
Villani, C. Optimal transport: old and new, volume 338. Springer Science & Business Media, 2008
2008
-
[49]
A., and Rohde, G
Wang, W., Slep c ev, D., Basu, S., Ozolek, J. A., and Rohde, G. K. A linear optimal transportation framework for quantifying and visualizing variations in sets of images. International journal of computer vision, 101: 0 254--269, 2013
2013
-
[50]
and Cai, Z
Yang, S. and Cai, Z. Cross domain lifelong learning based on task similarity. IEEE transactions on pattern analysis and machine intelligence, 45 0 (10): 0 11612--11623, 2023
2023
-
[51]
Yurochkin, M., Claici, S., Chien, E., Mirzazadeh, F., and Solomon, J. M. Hierarchical optimal transport for document representation. In Advances in Neural Information Processing Systems, pp.\ 1601--1611, 2019
2019
-
[52]
Character-level convolutional networks for text classification
Zhang, X., Zhao, J., and LeCun, Y. Character-level convolutional networks for text classification. Advances in neural information processing systems, 28, 2015
2015
-
[53]
write newline
" write newline "" before.all 'output.state := FUNCTION n.dashify 't := "" t empty not t #1 #1 substring "-" = t #1 #2 substring "--" = not "--" * t #2 global.max substring 't := t #1 #1 substring "-" = "-" * t #2 global.max substring 't := while if t #1 #1 substring * t #2 gl...
Reviewed August 9, 2026 · model on record in the stance chip above.
Discussion (0). Continue with ORCID to comment.