REVIEW 4 major objections 5 minor 50 references
Investigating the Bouncing Barrier with Collision Simulations of Compressed Dust Aggregates
T0 review · 4 major / 5 minor · reviewed 2026-08-09 · deepseek-v4-flash
Pith's one-line read Collision simulations show compact dust aggregates bounce above a threshold mass that scales as impact velocity to the $-4/3$ power.
desk verdict Compressed BCCA aggregates finally produce a velocity-dependent bouncing threshold in simulations, but the headline -4/3 scaling is imposed, not measured. read the letter →
The pith
A machine-rendered reading of the paper's core claim, the machinery that carries it, and where it could break.
The reading
What carries the argument
The object that carries the argument is the compressed BCCA sphere: an aggregate built by ballistic cluster-cluster aggregation and then compressed by moving periodic boundaries to filling factors 0.4, 0.45, and 0.5, giving average coordination numbers around 4 rather than the near-closest-packed values used in earlier simulations. The load-bearing identity is the empirical threshold law $m_{\rm bounce}=m_{v1}(v_{\rm imp}/1\,{\rm m\,s^{-1}})^{-4/3}$, whose exponent is imposed for comparison with experiments and whose normalization $m_{v1}$ is fit to the simulation data. Around this sits the three-phase energy accounting of compression, transition, and stretching, which explains why the threshold exists: almost all impact energy is dissipated before elastic repulsion can return it to kinetic energy.
What would settle it
Run the same collision survey with aggregates compacted by a different natural-like history, such as repeated gentle impacts or cyclic compression, and fit the threshold masses without fixing the exponent; a best-fit exponent significantly different from $-4/3$, or a different $m_{v1}$ versus $\phi$ slope, would falsify the central claim. Direct tomographic measurement of coordination-number distributions in impacted laboratory aggregates would test the structural premise.
Extended reading notes
Core claim
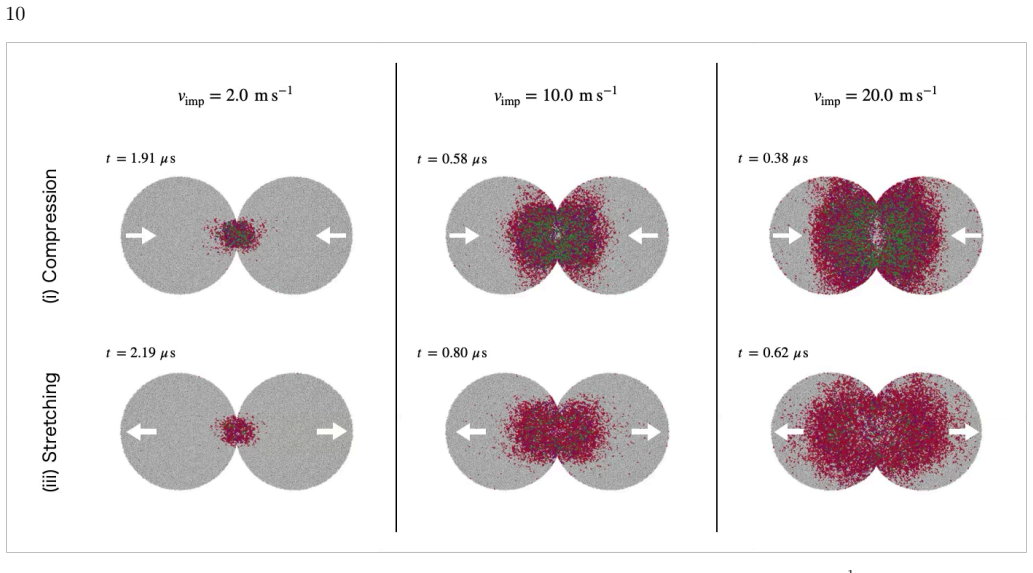
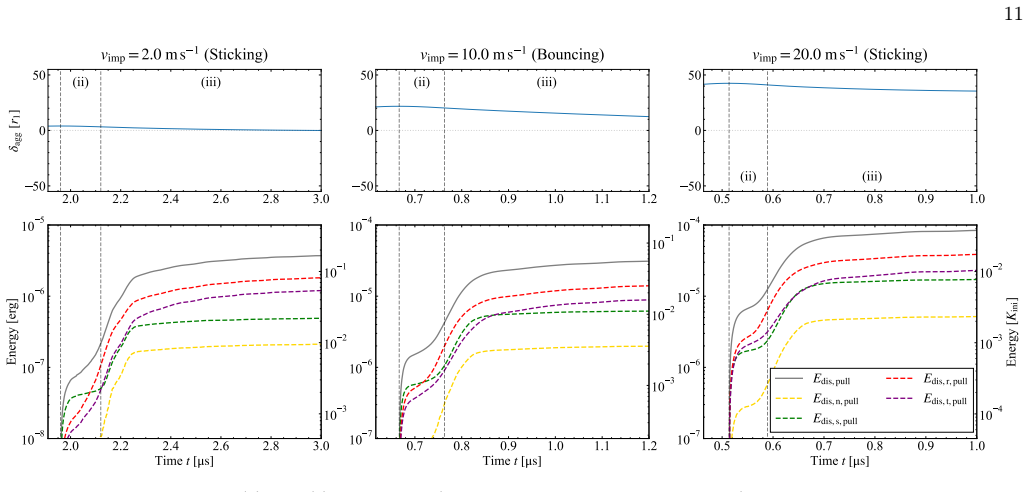
The central claim is that the bouncing barrier for compressed dust aggregates is set by a power-law threshold mass, $m_{\rm bounce} \propto v_{\rm imp}^{-4/3}$, with a proportionality constant that depends steeply on the volume filling factor. The authors find this by simulating head-on collisions of compressed BCCA spheres, which are ballistic cluster-cluster aggregates compacted under periodic boundaries to filling factors 0.4, 0.45, and 0.5, and locating the mass at which the mean growth efficiency passes 0.5. At low impact velocities, larger aggregates bounce at lower velocities, and the threshold mass drops by nearly an order of magnitude when the filling factor rises by 0.05. The energy budget shows that about 90% of the initial impact energy is dissipated by sliding during the initial compression phase and more than 70% of the remaining energy by rolling during stretching, so only a few percent of the initial kinetic energy is left to decide the outcome.
Load-bearing premise
The whole argument rests on compressed BCCA spheres standing in for naturally compacted dust aggregates; if real compaction histories produce different contact networks, the velocity scaling and the steep filling-factor trend could change.
Editorial extensions
If this is right
- Dust aggregates with filling factor $\gtrsim 0.4$ in protoplanetary disks should stop growing near $100\,\mu$m, because the bouncing threshold velocity falls below the turbulent collision velocity at that size.
- The steep $\phi^{-18.6}$ dependence means small changes in compaction state shift the bouncing threshold by orders of magnitude, so compactness must be treated as a controlling variable in dust-growth models.
- The $-4/3$ scaling reproduces laboratory experiments on sub-millimeter SiO2 aggregates, suggesting the exponent is insensitive to monomer size and material within the tested range.
- Bouncing dominates only in an intermediate velocity window; at low velocity aggregates stick for lack of energy, and at high velocity they stick through deformation and large contact areas.
Reading between the lines
- If the $-4/3$ exponent is universal, then the factor $m_{v1}$ carries all material dependence; measuring it for different monomer radii and surface energies would let disk models scale the barrier without new collision simulations.
- The steep filling-factor dependence implies that a disk's aggregate population could be effectively bimodal in compaction: loose aggregates keep growing while compact ones stall, which may produce the size and polarization signatures inferred from observations.
- Extrapolating the threshold to $\phi\approx 0.35$ brings the bouncing velocity into the 0.3 to 1 m/s range inferred for the IM Lup disk, suggesting the barrier may operate even at moderate porosity; a direct simulation at that filling factor would test this.
Signed reviews
Editorial analysis
A structured set of objections, weighed in public.
Referee Report
Summary. The paper presents three-dimensional N-body collision simulations of compressed dust aggregates, focusing on the bouncing barrier for moderately compact aggregates (filling factors phi = 0.4, 0.45, 0.5). The initial aggregates are produced by compressing BCCA-like structures, a more physically motivated procedure than the CPE aggregates used in earlier simulations. The authors map the sticking-bouncing boundary as a function of impact velocity and aggregate mass, and report that the threshold mass follows a power law mbounce = mv1 (vimp/1 m/s)^(-4/3) at velocities below about 10 m/s, with mv1 decreasing steeply with filling factor (approximately phi^-18.6). An energy analysis of representative runs shows that roughly 90% of the initial kinetic energy is dissipated during the compression phase, and that most of the remaining energy is dissipated during stretching. The authors then apply the derived threshold to the IM Lup disk and conclude that aggregates with phi >= 0.4 stop growing near 100 microns, providing a possible explanation for millimeter-wave polarimetric observations.
Significance. If the central quantitative claims are valid, the paper resolves a long-standing discrepancy between collision simulations and laboratory experiments on bouncing of moderately compact aggregates, and it connects the bouncing barrier to observed compact dust in protoplanetary disks. The use of compressed BCCA aggregates as initial conditions is a genuine improvement over previous artificial structures, and the energy partitioning analysis is detailed and potentially useful for future coagulation models. However, the headline -4/3 velocity scaling is imposed by the fitting function rather than measured, and the steep filling-factor trend is based on only three points; these issues substantially weaken the experimental-consistency argument that the paper's conclusions rely on. The work is significant if the quantitative claims survive a free-exponent reanalysis.
major comments (4)
- [Section 3.2, Eq. (10)] The power-law exponent in Eq. (10) is fixed to -4/3 before fitting, so the claimed consistency with Kothe et al. (2013) is not an independent test. The authors should fit log10 mbounce = b + a log10(vimp/1 m/s) with the exponent a free, report the best-fit value and its uncertainty, and explicitly assess whether the data are consistent with a = -4/3. Given the coarse grid (vimp = 2 x 10^(0.1i) m/s and Ragg in steps of 10 r1), the threshold curves at vimp < 10 m/s are interpolated from only a few points, so a fixed-slope fit cannot demonstrate that the data select -4/3. Consequently, the statement in Section 5.4 that the -4/3 exponent is 'robust' and insensitive to monomer/aggregate parameters is unsupported, since no alternative slopes or parameter variations were tested.
- [Figure 7 and Table 3] The mv1 proportional-to phi^-18.6 relation is fitted to only three data points, and no uncertainty on the exponent is reported. The 1-sigma scatter listed in Table 3 is the scatter of mv1 around the fixed-slope fit, not an uncertainty on the exponent or on mv1 itself. The mv1 versus Pcomp relation in Eq. (17) is a remapping of the same three points through Eq. (16) from Tatsuuma et al. (2023), so it does not independently confirm the interpretation that compressive strength controls the threshold. The authors should report formal fit uncertainties (e.g., from a covariance or bootstrap analysis) and clearly state the small sample size when drawing the phi^-18.6 conclusion.
- [Abstract and Section 4.2] The abstract claims that 'over 70% of the remaining energy is dissipated during the subsequent stretching phase, regardless of whether the collision results in sticking or bouncing.' This is inconsistent with Section 4.2, which reports 'about 70% of the sum of the converted kinetic energy and elastic energy is dissipated in the bouncing case and more than 95% in the sticking case,' and with the right panel of Figure 12, where Edis,pull/DeltaUmax exceeds unity for the sticking cases. The abstract should be qualified to describe the analyzed examples or a properly averaged statistic; as written, the energy claim overgeneralizes the simulation outcomes.
- [Section 5.3 and Abstract] The application to the IM Lup disk, and the abstract's statement that aggregates with phi >= 0.4 cease to grow beyond 100 microns, rely on extrapolating Eq. (12) to velocities as low as about 0.04 m/s, which is below the lowest simulated impact velocity of 2 m/s, and on extrapolating the filling-factor trend toward phi approximately 0.35, outside the simulated range 0.4-0.5. The paper acknowledges limitations in Section 5.4, but the abstract and summary present the 100-micron result without those caveats. Either add lower-velocity/lower-phi simulations to support the extrapolation or explicitly present the disk application as an extrapolation with quantified uncertainty.
minor comments (5)
- [Figure 5] The y-axis label 'Mean glowth efficiency' contains a typo and should read 'Mean growth efficiency'.
- [Figure 2 caption] The caption says 'standard derivations' but should say 'standard deviations'.
- [Section 2.1] The definition of the normal displacement delta would be clearer if the sign convention (delta > 0 for compression, delta < 0 for stretching) were stated before Eq. (2), rather than in the following sentence.
- [Section 4.2] The note that Figures 9 and 11 do not include data up to the end time is useful; consider giving the actual end times in the captions for the three cases.
- [Section 5.2] The phrase 'Experiments with larger aggregates consisting of about 10^9 monomers' is vague; specifying the corresponding aggregate size or providing a specific reference would help the reader assess the comparison.
Circularity Check
The claimed v^-4/3 scaling is imposed by the fitting function, so the consistency with Kothe et al. is partly built in rather than measured.
-
self definitional
[Section 3.2, Eq. (10)]
"For the threshold mass curves at vimp < 10 m s−1, we perform a least-square fitting of a power-law function of the form log10 mbounce = b − 4/3 log10(vimp/1 m s−1), where b is a fitting parameter."
The -4/3 exponent is fixed in the fitting function before any fit; the simulations only determine the offset b (mv1). The paper later concludes that the threshold mass scales with impact velocity as the -4/3 power, consistent with the findings of previous experiments (Abstract and Section 3.2). Because the exponent was taken from the experiments, the claimed agreement is partly a restatement of the assumed form, not a measurement from the simulation data. No free-exponent fit or exponent uncertainty is reported, so the data cannot validate the -4/3 slope.
-
fitted input called prediction
[Section 5.4 (Limitations)]
"However, despite these differences, our simulations qualitatively reproduce the power-law scaling between the threshold mass for bouncing and the impact velocity, mcrit ∝ v−4/3 imp (Equation (11)), observed in experiments. This suggests that the power-law exponent of −4/3 is robust and is insensitive to the aforementioned parameters."
The reproduction of the -4/3 scaling is a direct consequence of imposing that exponent in Eq. (10), so calling it a reproduction overstates what the simulations independently show. The robustness claim is not supported by any test: no alternative slopes were fit, and no monomer-size, surface-energy, or other parameter variations were simulated. The apparent agreement with Kothe et al. is therefore largely constructed by the fitting procedure rather than being an emergent result.
full rationale
The underlying N-body collision simulations and the energy analysis are not circular: the sticking/bouncing outcomes in Figure 6, the interpolated threshold curves, and the compression/stretching energy partitioning are computed from the monomer interaction model and are self-contained. The steep dependence of mv1 on filling factor (phi^-18.6) is a legitimate, though statistically underpowered, fit to three simulation points, and the use of the Pcomp relation from Tatsuuma et al. (2023) is a normal self-citation that is not the main logical hinge. The significant circularity is concentrated in the experimental-consistency claim: the paper fixes the v^-4/3 exponent in the fitting function (Eq. 10) on the basis of Kothe et al. (2013), then presents the resulting fit as a reproduction of the experimental law and even as evidence that the exponent is robust and parameter-insensitive. Because the exponent is an input rather than an output, the headline statement of agreement with experiments is partly by construction. This warrants a score of 6 rather than a higher score because the simulation outcomes themselves are still new data and the central geometric/mass trends are not fully forced.
Assumptions & free parameters
free parameters (5)
- mv1, threshold mass at v_imp = 1 m/s =
1.67e-8 g (phi=0.4), 1.68e-9 g (phi=0.45), 2.74e-10 g (phi=0.5)
- Power-law exponent in Eq. (10) =
-4/3
- Prefactor and exponent of mv1 versus Pcomp relation =
2.4e-7 g and -2.4
- Exponent of mv1 versus phi relation =
-18.6
- Dimensionless damping coefficient kn =
0.01
assumptions (6)
- domain assumption The JKR-based monomer interaction model with rolling, sliding, and twisting (Dominik & Tielens 1997; Wada et al. 2007) accurately describes aggregate collisions.
- domain assumption Compressing BCCA aggregates reproduces the internal structure of naturally compacted aggregates in experiments and disks.
- domain assumption The coordination number relation (Eq. 7) and compressive strength formula (Eq. 16) from Arakawa et al. 2019 and Tatsuuma et al. 2023 apply to the simulated aggregates.
- domain assumption Head-on, equal-sized, non-fragmenting collisions capture the growth-relevant bouncing condition.
- domain assumption The IM Lup disk model and Ormel & Cuzzi 2007 turbulence velocities used in Section 5.3 are accurate.
- domain assumption Ice surface energy gamma = 100 mJ/m2 is representative for outer disk dust.
Cite this review
Pith. "Pith review of Investigating the Bouncing Barrier with Collision Simulations of Compressed Dust Aggregates." pith.science (2026). https://pith.science/paper/TBYZIGBS
@misc{pith2026250203107,
  author       = {Pith},
  title        = {Pith review of: Investigating the Bouncing Barrier with Collision Simulations of Compressed Dust Aggregates},
  year         = {2026},
  howpublished = {\url{https://pith.science/paper/TBYZIGBS}},
  note         = {Machine review of arXiv:2502.03107}
}
abstract
The collision outcomes of dust aggregates in protoplanetary disks dictate how planetesimals form. Experimental and numerical studies have suggested that bouncing collisions occurring at low impact velocities may limit aggregate growth in the disks, but the conditions under which bouncing occurs have yet to be fully understood. In this study, we perform a suite of collision simulations of moderately compact dust aggregates with various impact velocities, aggregate radii, and filling factors ranging between 0.4 and 0.5. Unlike previous simulations, we generate compact aggregates by compressing more porous ones, mimicking the natural processes through which compact aggregates form. We find that the compressed aggregates bounce above a threshold mass, which decreases with impact velocity. The threshold mass scales with impact velocity as the $-4/3$ power, consistent with the findings of previous experiments. We also find that the threshold aggregate mass for bouncing depends strongly on filling factor, likely reflecting the strong filling-factor dependence of the compressive strength of compressed aggregates. Our energy analysis reveals that nearly 90\% of the initial impact energy is dissipated during the initial compression phase, and over 70\% of the remaining energy is dissipated during the subsequent stretching phase, regardless of whether the collision results in sticking or bouncing. Our results indicate that dust aggregates with a filling factor of 0.4 cease to grow beyond 100 $\mathrm{\mu m}$ as a result of the bouncing barrier.
Figures


Figures from the paper (12 more)




Reference graph
Works this paper leans on
-
[1]
2023, ApJL, 951, L16, doi: 10.3847/2041-8213/acdb5f
Arakawa, S., Okuzumi, S., Tatsuuma, M., et al. 2023, ApJL, 951, L16, doi: 10.3847/2041-8213/acdb5f
-
[2]
2019, Progress of Theoretical and Experimental Physics, 2019, 093E02, doi: 10.1093/ptep/ptz102
Arakawa, S., Takemoto, M., & Nakamoto, T. 2019, Progress of Theoretical and Experimental Physics, 2019, 093E02, doi: 10.1093/ptep/ptz102
-
[3]
Bai, X.-N., & Stone, J. M. 2010, ApJ, 722, 1437, doi: 10.1088/0004-637X/722/2/1437
-
[4]
Dominik, C., & Dullemond, C. P. 2024, A&A, 682, A144, doi: 10.1051/0004-6361/202347716
-
[5]
Dominik, C., & Tielens, A. G. G. M. 1997, ApJ, 480, 647, doi: 10.1086/303996
doi:10.1086/303996 1997
-
[6]
Goldreich, P., & Ward, W. R. 1973, ApJ, 183, 1051, doi: 10.1086/152291
doi:10.1086/152291 1973
-
[7]
Gundlach, B., Schmidt, K. P., Kreuzig, C., et al. 2018, MNRAS, 479, 1273, doi: 10.1093/mnras/sty1550 Güttler, C., Blum, J., Zsom, A., Ormel, C. W., &
-
[8]
Dullemond, C. P. 2010, A&A, 513, A56, doi: 10.1051/0004-6361/200912852 Güttler, C., Krause, M., Geretshauser, R. J., Speith, R., &
Show all 50 references
-
[9]
2009, ApJ, 701, 130, doi: 10.1088/0004-637X/701/1/130
Blum, J. 2009, ApJ, 701, 130, doi: 10.1088/0004-637X/701/1/130
2009 doi
-
[10]
2023, ApJ, 944, 38, doi: 10.3847/1538-4357/acadda
Wada, K. 2023, ApJ, 944, 38, doi: 10.3847/1538-4357/acadda
2023 doi
-
[11]
Hull, C. L. H., Yang, H., Li, Z.-Y., et al. 2018, ApJ, 860, 82, doi: 10.3847/1538-4357/aabfeb
2018 doi
-
[12]
Israelachvili, J. N. 1992, Surface Science Reports, 14, 109, doi: 10.1016/0167-5729(92)90015-4
1992 doi
-
[13]
S., Mac Low, M.-M., et al
Johansen, A., Oishi, J. S., Mac Low, M.-M., et al. 2007, Nature, 448, 1022, doi: 10.1038/nature06086
2007 doi
-
[14]
2009, ApJL, 704, L75, doi: 10.1088/0004-637X/704/2/L75
Johansen, A., Youdin, A., & Mac Low, M.-M. 2009, ApJL, 704, L75, doi: 10.1088/0004-637X/704/2/L75
2009 doi
-
[15]
L., Kendall, K., & Roberts, A
Johnson, K. L., Kendall, K., & Roberts, A. D. 1971, Proceedings of the Royal Society of London Series A, 324, 301, doi: 10.1098/rspa.1971.0141
1971
-
[16]
2013, A&A, 557, L4, doi: 10.1051/0004-6361/201322151
Kataoka, A., Tanaka, H., Okuzumi, S., & Wada, K. 2013, A&A, 557, L4, doi: 10.1051/0004-6361/201322151
2013 doi
-
[17]
2015, ApJ, 809, 78, doi: 10.1088/0004-637X/809/1/78
Kataoka, A., Muto, T., Momose, M., et al. 2015, ApJ, 809, 78, doi: 10.1088/0004-637X/809/1/78
2015 doi
-
[18]
2021, ApJ, 922, 16, doi: 10.3847/1538-4357/ac289c
Kobayashi, H., & Tanaka, H. 2021, ApJ, 922, 16, doi: 10.3847/1538-4357/ac289c
2021 doi
-
[19]
2013, Icarus, 225, 75, doi: 10.1016/j.icarus.2013.02.034
Kothe, S., Blum, J., Weidling, R., & Güttler, C. 2013, Icarus, 225, 75, doi: 10.1016/j.icarus.2013.02.034
2013 doi
-
[20]
2008, ApJ, 675, 764, doi: 10.1086/525841
Langkowski, D., Teiser, J., & Blum, J. 2008, ApJ, 675, 764, doi: 10.1086/525841
2008 doi
-
[21]
2023, in Astronomical Society of the Pacific Conference Series, Vol
Lesur, G., Flock, M., Ercolano, B., et al. 2023, in Astronomical Society of the Pacific Conference Series, Vol. 534, Protostars and Planets VII, ed. S. Inutsuka, Y. Aikawa, T. Muto, K. Tomida, & M. Tamura, 465, doi: 10.48550/arXiv.2203.09821
-
[22]
1991, Reviews of Geophysics, 29, 317, doi: 10.1029/91RG00688 16
Meakin, P. 1991, Reviews of Geophysics, 29, 317, doi: 10.1029/91RG00688 16
1991 doi
-
[23]
2019, ApJ, 873, 58, doi: 10.3847/1538-4357/ab0428
Musiolik, G., & Wurm, G. 2019, ApJ, 873, 58, doi: 10.3847/1538-4357/ab0428
2019 doi
-
[24]
2012, ApJ, 752, 106, doi: 10.1088/0004-637X/752/2/106
Okuzumi, S., Tanaka, H., Kobayashi, H., & Wada, K. 2012, ApJ, 752, 106, doi: 10.1088/0004-637X/752/2/106
2012 doi
-
[25]
2009, ApJ, 707, 1247, doi: 10.1088/0004-637X/707/2/1247
Okuzumi, S., Tanaka, H., & Sakagami, M.-a. 2009, ApJ, 707, 1247, doi: 10.1088/0004-637X/707/2/1247
2009 doi
-
[26]
W., & Cuzzi, J
Ormel, C. W., & Cuzzi, J. N. 2007, A&A, 466, 413, doi: 10.1051/0004-6361:20066899
2007 doi
-
[27]
W., Spaans, M., & Tielens, A
Ormel, C. W., Spaans, M., & Tielens, A. G. G. M. 2007, A&A, 461, 215, doi: 10.1051/0004-6361:20065949 Schräpler, R., Blum, J., Seizinger, A., & Kley, W. 2012, ApJ, 758, 35, doi: 10.1088/0004-637X/758/1/35 Schräpler, R. R., Landeck, W. A., & Blum, J. 2022, MNRAS, 509, 5641, doi...
2007 doi
-
[28]
2013, A&A, 551, A65, doi: 10.1051/0004-6361/201220946
Seizinger, A., & Kley, W. 2013, A&A, 551, A65, doi: 10.1051/0004-6361/201220946
2013 doi
-
[29]
2017, ApJ, 841, 36, doi: 10.3847/1538-4357/aa6fad
Sirono, S.-i., & Ueno, H. 2017, ApJ, 841, 36, doi: 10.3847/1538-4357/aa6fad
2017 doi
-
[30]
2023, A&A, 670, L5, doi: 10.1051/0004-6361/202245512
Birnstiel, T. 2023, A&A, 670, L5, doi: 10.1051/0004-6361/202245512
2023 doi
-
[31]
W., Yang, H., Li, Z.-Y., et al
Stephens, I. W., Yang, H., Li, Z.-Y., et al. 2017, ApJ, 851, 55, doi: 10.3847/1538-4357/aa998b
2017 doi
-
[32]
W., Lin, Z.-Y
Stephens, I. W., Lin, Z.-Y. D., Fernández-López, M., et al. 2023, Nature, 623, 705, doi: 10.1038/s41586-023-06648-7
2023 doi
-
[33]
Z., & Inutsuka, S.-i
Takahashi, S. Z., & Inutsuka, S.-i. 2014, ApJ, 794, 55, doi: 10.1088/0004-637X/794/1/55
2014 doi
-
[34]
2005, ApJ, 625, 414, doi: 10.1086/429658
Tanaka, H., Himeno, Y., & Ida, S. 2005, ApJ, 625, 414, doi: 10.1086/429658
2005 doi
-
[35]
2023, ApJ, 953, 6, doi: 10.3847/1538-4357/acdf43
Tatsuuma, M., Kataoka, A., Okuzumi, S., & Tanaka, H. 2023, ApJ, 953, 6, doi: 10.3847/1538-4357/acdf43
2023 doi
-
[36]
2019, ApJ, 874, 159, doi: 10.3847/1538-4357/ab09f7
Tatsuuma, M., Kataoka, A., & Tanaka, H. 2019, ApJ, 874, 159, doi: 10.3847/1538-4357/ab09f7
2019 doi
-
[37]
2019, MNRAS, 485, 4951, doi: 10.1093/mnras/stz662
Tazaki, R., Tanaka, H., Muto, T., Kataoka, A., & Okuzumi, S. 2019, MNRAS, 485, 4951, doi: 10.1093/mnras/stz662
2019 doi
-
[38]
2014, in Protostars and Planets VI, ed
Testi, L., Birnstiel, T., Ricci, L., et al. 2014, in Protostars and Planets VI, ed. H. Beuther, R. S. Klessen, C. P. Dullemond, & T. Henning, 339–361, doi: 10.2458/azu_uapress_9780816531240-ch015
2014 doi
-
[39]
T., Inutsuka, S.-i., & Kobayashi, H
Tominaga, R. T., Inutsuka, S.-i., & Kobayashi, H. 2021, ApJ, 923, 34, doi: 10.3847/1538-4357/ac173a
2021 doi
-
[40]
2021, ApJ, 913, 117, doi: 10.3847/1538-4357/abf7b8
Ueda, T., Kataoka, A., Zhang, S., et al. 2021, ApJ, 913, 117, doi: 10.3847/1538-4357/abf7b8
2021 doi
-
[41]
2024, Nature Astronomy, 1, doi: 10.1038/s41550-024-02308-6
Sudarshan, P. 2024, Nature Astronomy, 1, doi: 10.1038/s41550-024-02308-6
2024 doi
-
[42]
2013, A&A, 559, A62, doi: 10.1051/0004-6361/201322259
Wada, K., Tanaka, H., Okuzumi, S., et al. 2013, A&A, 559, A62, doi: 10.1051/0004-6361/201322259
2013 doi
-
[43]
2007, ApJ, 661, 320, doi: 10.1086/514332 —
Yamamoto, T. 2007, ApJ, 661, 320, doi: 10.1086/514332 —. 2011, ApJ, 737, 36, doi: 10.1088/0004-637X/737/1/36
2007 doi
-
[44]
2012, Icarus, 218, 688, doi: 10.1016/j.icarus.2011.10.002
Weidling, R., Güttler, C., & Blum, J. 2012, Icarus, 218, 688, doi: 10.1016/j.icarus.2011.10.002
2012 doi
-
[45]
2009, ApJ, 696, 2036, doi: 10.1088/0004-637X/696/2/2036
Weidling, R., Güttler, C., Blum, J., & Brauer, F. 2009, ApJ, 696, 2036, doi: 10.1088/0004-637X/696/2/2036
2009 doi
-
[46]
2012, A&A, 540, A73, doi: 10.1051/0004-6361/201118475
Windmark, F., Birnstiel, T., Güttler, C., et al. 2012, A&A, 540, A73, doi: 10.1051/0004-6361/201118475
2012 doi
-
[47]
2016, MNRAS, 456, 2794, doi: 10.1093/mnras/stv2633
Yang, H., Li, Z.-Y., Looney, L., & Stephens, I. 2016, MNRAS, 456, 2794, doi: 10.1093/mnras/stv2633
2016 doi
- [48]
-
[49]
2023, ApJ, 953, 96, doi: 10.3847/1538-4357/acdb4e
Zhang, S., Zhu, Z., Ueda, T., et al. 2023, ApJ, 953, 96, doi: 10.3847/1538-4357/acdb4e
2023 doi
-
[50]
Dullemond, C. P. 2010, A&A, 513, A57, doi: 10.1051/0004-6361/200912976
2010 doi
Reviewed August 9, 2026 · model on record in the stance chip above.
Discussion (0). Continue with ORCID to comment.