REVIEW 4 major objections 5 minor 2 cited by
Diffusion Models Through a Global Lens: Are They Culturally Inclusive?
T0 review · 4 major / 5 minor · reviewed 2026-08-07 · deepseek-v4-flash
Pith's one-line read State-of-the-art text-to-image diffusion models produce less culturally accurate images for underrepresented countries, and a new benchmark and metric quantify the gap.
desk verdict A useful 10-country cultural-inclusivity benchmark with an honestly reported weak spot: three annotators per country and kappa 0.07–0.17 make the headline disparity claim statistically fragile, and the authors themselves hedge it. read the letter →
The pith
A machine-rendered reading of the paper's core claim, the machinery that carries it, and where it could break.
The reading
What carries the argument
The machinery is the CultDiff benchmark and the CultDiff-S metric. CultDiff contains 50 prompts per category per country, five real reference images per artifact, and synthetic images from Stable Diffusion XL, Stable Diffusion 3 Medium, and FLUX. CultDiff-S is a Vision Transformer trained with a weighted margin contrastive loss: each image pair receives a weight from normalized human similarity scores, positive pairs are pulled together, and negative pairs are pushed apart. The learned embeddings, compared by cosine similarity, are what produce the higher correlation with human judgments reported in the paper.
What would settle it
Collect ratings for the same CultDiff prompts from a much larger and recruitment-balanced annotator pool (for example 30 or more per country, all from the same platform) and recompute the country rankings; if Ethiopia and Indonesia no longer fall in the lower half, or if the larger pool disagrees with the original three annotators on the same images, the paper's central ranking claim fails. A second check: evaluate CultDiff-S on countries and artifact types absent from its training set, and if its Spearman correlation with fresh human judgments drops to near zero, the metric does not generalize beyond the ten benchmark countries.
Extended reading notes
Core claim
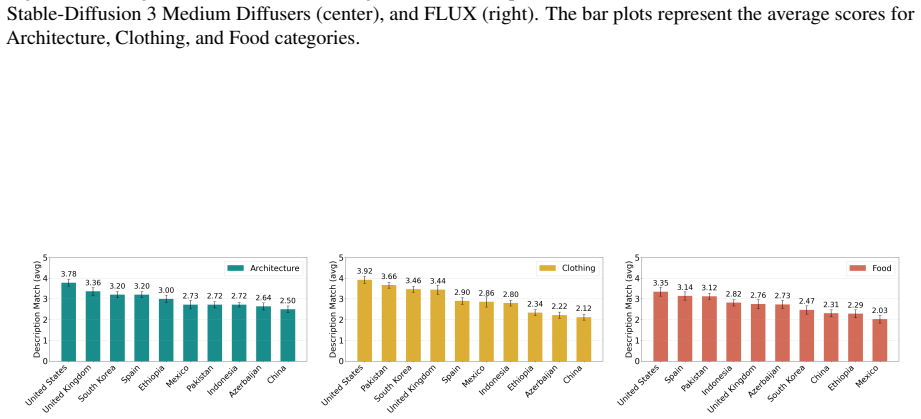
The central claim is that state-of-the-art diffusion models often fail to generate culturally accurate artifacts, and that the failure is concentrated in underrepresented country regions. Across all three categories and all three models, the USA, UK, and South Korea consistently score in the top half of human-rated similarity, while Ethiopia and Indonesia frequently appear in the lower half. The paper acknowledges that the over- versus under-represented gap is not statistically significant in the description-match analysis, but the ranking pattern is stable across models. The authors argue this reflects a bias toward cultures with a larger online presence, and they offer CultDiff and CultDiff-S as tools to measure and eventually correct the imbalance.
Load-bearing premise
The entire country ranking rests on only three annotators per country, whose agreement is low (Fleiss kappa 0.07 to 0.17), so the observed gap between overrepresented and underrepresented countries could partly reflect who happened to rate the images.
Editorial extensions
If this is right
- Cultural inclusivity becomes a measurable axis for evaluating text-to-image models, comparable across countries, categories, and model versions.
- Model developers can use CultDiff-S to automatically flag countries or artifact types where generations drift from real-world references.
- The consistent high ranking of WEIRD and high-internet-presence countries supports the diagnosis that training data skew drives the gap, pointing to dataset rebalancing as a remedy.
- Benchmarking with CultDiff can expose the difference between prompt fidelity and visual realism, separating cases where the model lacks visual knowledge from cases where it fails to follow the prompt.
- Standard quality metrics like FID and LPIPS correlate weakly with human cultural judgments, so culture-specific metrics become necessary for fair evaluation.
Reading between the lines
- A decisive test the authors did not run: re-ranking countries with a much larger and recruitment-balanced annotator pool would show whether the low scores for Ethiopia and Indonesia reflect a model property or the particular annotators who rated those images.
- CultDiff-S could be used as a training signal rather than only an evaluation metric; fine-tuning a diffusion model with it as a reward may improve cultural fidelity without curated per-country data.
- The common failure patterns (Korean clothing rendered as Chinese or Japanese, Pakistani food as Indian dishes) suggest the model leans on regional proxies; a finer-grained error taxonomy could tie each failure to a specific training-data gap.
- Expanding CultDiff to more countries and more annotators per country would give the rankings and the metric stronger statistical grounding, turning a 10-country snapshot into a generalizable assessment.
Editorial analysis
A structured set of objections, weighed in public.
Referee Report
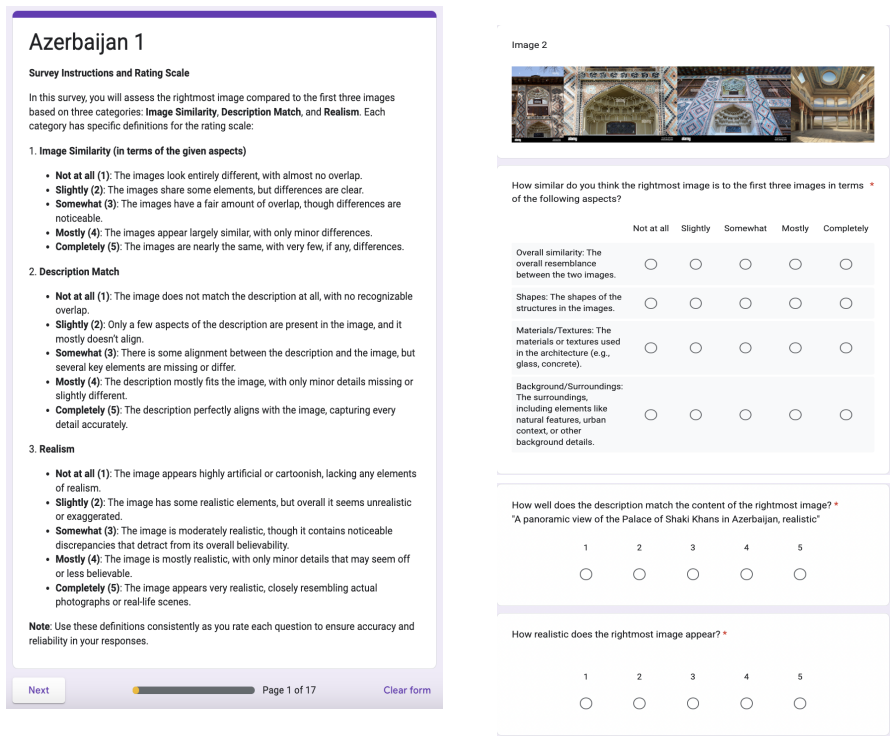
Summary. The paper introduces CultDiff, a benchmark for evaluating whether text-to-image diffusion models generate culturally specific images across ten countries (Azerbaijan, Pakistan, Ethiopia, South Korea, Indonesia, China, Spain, Mexico, the USA, and the UK) and three artifact categories (architecture, clothing, food). For each country and category, the authors collected real reference images from Bing and generated images with Stable Diffusion XL, Stable Diffusion 3 Medium, and FLUX.1-dev. Human annotators (three per country) rated image-image similarity on four fine-grained aspects, image-description match, and realism. The paper reports country-level rankings and claims that overrepresented countries (USA, UK, South Korea) score higher than underrepresented ones (Ethiopia, Indonesia, Azerbaijan). It also proposes CultDiff-S, a Vision Transformer trained with a weighted margin loss on positive and negative image pairs derived from the collected human scores, and reports that CultDiff-S correlates better with human judgments than FID, LPIPS, SSIM, and SISM. The paper concludes that current diffusion models exhibit cultural bias and that CultDiff can support more equitable evaluation.
Significance. If the empirical claims were robust, CultDiff would be a useful addition to the small set of culturally diverse text-to-image benchmarks, and CultDiff-S would be a step toward automatic culture-aware similarity evaluation. The paper has concrete strengths: it covers ten countries with varying language-resource levels, it collects human judgments on several fine-grained aspects, it evaluates three current state-of-the-art models, and it is transparent about its main limitation (three annotators per country). The authors also include an explicit limitations section and an ethics statement with IRB approval and compensation details. However, the headline disparity claim is currently undercut by the paper's own statement in Section 4.1.2 that there is no statistically significant difference between overrepresented and underrepresented countries, and by the very low inter-annotator agreement reported in Appendix A.3. The proposed metric is trained and evaluated on the same human-annotation pool, so its reported improvement over existing metrics may reflect annotator-specific bias rather than general cultural understanding. These issues are load-bearing for the paper's central claims.
major comments (4)
- [Abstract and §4.1.2] The abstract claims 'significant disparities in cultural relevance, description fidelity, and realism,' but Section 4.1.2 states that 'there is no significant statistical difference between the overrepresented and underrepresented countries in our study, likely due to the small dataset.' Since the country-level disparity is the paper's central contribution, this is a direct evidential conflict. Please report a formal statistical analysis, such as a mixed-effects model with country and annotator random effects or cluster-bootstrap confidence intervals over annotators, give effect sizes and uncertainty for the country rankings in Table 1, and revise the abstract and conclusions if the significant-difference claim is not supported.
- [§3.2 and Appendix A.3, Table 3] The country rankings are computed from only three annotators per country, and Table 3 reports Fleiss' kappa values between 0.07 (USA) and 0.17 (South Korea), i.e., at best slight-to-fair agreement. With this level of inter-annotator reliability, the observed separation between countries may lie within annotator noise. Moreover, the recruitment design differs by country: annotators from Azerbaijan, Pakistan, Ethiopia, South Korea, and Indonesia were recruited through college communities, while annotators from Spain, Mexico, the USA, and the UK came from Prolific. Systematic differences in rating-scale use or response styles between these pools could produce the observed ranking even if model output quality were identical across countries. Please add per-annotator score normalization, bootstrap or mixed-model uncertainty for country means, and a demonstration that the rankings and the over/underrepresented comparison survive these controls.
- [§3.3.1 and §3.3.2] CultDiff-S is trained on positive and negative pairs derived from the same human ratings used to evaluate the generated images, with positive/negative labels determined by an arbitrary threshold of average human score ≥3, a default weight of 1 for unannotated pairs, and a margin m whose value is not reported or ablated. Evaluation is then performed on a held-out split of the same benchmark annotated by the same annotator pool; the metric can therefore learn annotator-specific biases rather than a general notion of cultural similarity. Please validate the metric on external human judgments or on unseen countries and categories, and ablate the threshold, default weight, and margin choices.
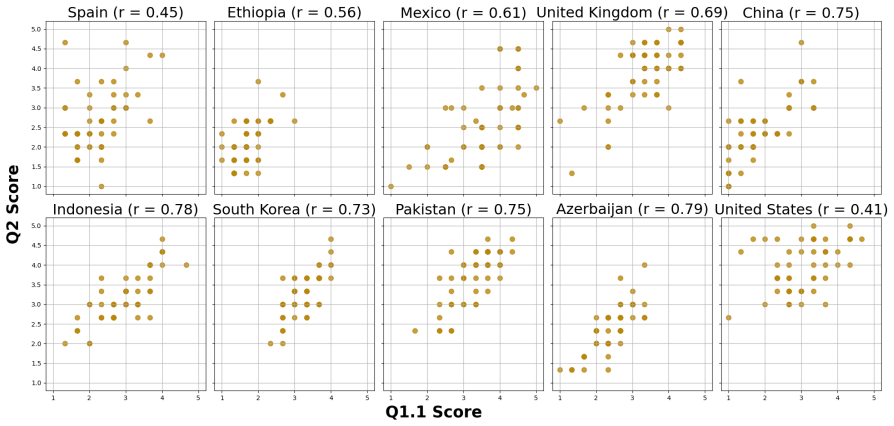
- [§4.2 and Table 2] FID is a distribution-level metric and is ill-defined for individual image pairs, yet Table 2 reports it as a similarity value for 'each evaluation pair' alongside LPIPS and SSIM. The comparison should be restricted to well-defined per-pair metrics, or FID should be computed on proper real and generated distributions. In addition, all reported correlations are small (CULTDIFF-S Spearman ρ = 0.1848, Pearson r = 0.1559); the claim of 'notably higher' correlation should be accompanied by confidence intervals and a significance test against the other metrics.
minor comments (5)
- [§3.2] The text says 'Each question for these three multiple-choice subquestions' but Q1 actually has four subquestions (overall similarity plus three aspect-specific questions); please rephrase for clarity.
- [§3.1 and Figure 1] The overview in Figure 1 and the text describing steps 1–3 and 4–6 are not fully aligned; please make the figure's numbered steps match the section references.
- [§3.3.1] When defining positive real-synthetic pairs by 'average image-image similarity score ≥3', please specify which survey questions are averaged, over which annotators, and how the threshold was chosen.
- [Appendix A.2.2] Please report the validation procedure for metric training, including model selection, early stopping, augmentation, and random seeds, so that the training is reproducible.
- [Conclusion and references] The conclusion contains the typo 'categoriessingby' (should be 'categories using'); also fix 'Planing' in the acknowledgments and 'V ondrick' in the references.
Circularity Check
No significant circularity: the cultural-disparity claims come directly from human annotations, and CultDiff-S is a standard supervised metric evaluated on held-out pairs with external metric comparisons.
full rationale
The paper's central cultural-inclusivity findings are produced by human annotators (Section 3.2, Table 1, Figure 3), not by the learned metric, and the over/underrepresented country split is defined externally via WEIRD, Asia Power Index, and low-resource language criteria (Section 1), not derived from the scores. CultDiff-S is trained on human similarity scores and evaluated on held-out pairs with disjoint prompts (Section 3.3.1), which is standard supervised metric learning rather than circularity: at inference the metric computes cosine similarity of learned embeddings, and the human scores are not fed into the model. The paper additionally benchmarks CultDiff-S against independent metrics (FID, LPIPS, SSIM, SISM) on the same held-out human judgments (Table 2), so the comparison is not self-referential. The self-citations (An et al. 2024 for weighted margin loss; Myung et al. 2024 for BLEnD) are motivational or related-work references and are not load-bearing. The low Fleiss kappa (0.07-0.17) and three-annotator design are genuine reliability and statistical-power concerns, and the paper itself acknowledges the lack of a significant difference in Section 4.1.2 and the annotator-count limitation in the Limitations section, but these are correctness risks rather than circular reasoning. No equation or definition reduces a claimed prediction to its own input.
Assumptions & free parameters
free parameters (6)
- Positive/negative pair threshold =
Average Likert score 3 (>=3 positive, <3 negative)
- Margin m in weighted margin loss =
Not reported
- Default label weight for unannotated pairs =
1.0
- Number of annotators per country =
3
- Number of reference images per artifact =
5
- ViT training hyperparameters =
lr=1e-4, 10 epochs, batch size 32, resolution 224
assumptions (5)
- domain assumption Country boundaries are a sufficient proxy for culture.
- domain assumption Bing web images are valid real-world ground-truth references for cultural artifacts.
- domain assumption The 50 artifacts per category per country curated from Wikipedia, heritage sites, and travel platforms are representative of that country's culture.
- domain assumption Likert scores from three annotators can be averaged and thresholded as interval data.
- domain assumption Embedding distance in the trained ViT space corresponds to cultural similarity.
Cite this review
Pith. "Pith review of Diffusion Models Through a Global Lens: Are They Culturally Inclusive?." pith.science (2026). https://pith.science/paper/WSGY25VY
@misc{pith2026250208914,
  author       = {Pith},
  title        = {Pith review of: Diffusion Models Through a Global Lens: Are They Culturally Inclusive?},
  year         = {2026},
  howpublished = {\url{https://pith.science/paper/WSGY25VY}},
  note         = {Machine review of arXiv:2502.08914}
}
read the original abstract
Text-to-image diffusion models have recently enabled the creation of visually compelling, detailed images from textual prompts. However, their ability to accurately represent various cultural nuances remains an open question. In our work, we introduce CultDiff benchmark, evaluating state-of-the-art diffusion models whether they can generate culturally specific images spanning ten countries. We show that these models often fail to generate cultural artifacts in architecture, clothing, and food, especially for underrepresented country regions, by conducting a fine-grained analysis of different similarity aspects, revealing significant disparities in cultural relevance, description fidelity, and realism compared to real-world reference images. With the collected human evaluations, we develop a neural-based image-image similarity metric, namely, CultDiff-S, to predict human judgment on real and generated images with cultural artifacts. Our work highlights the need for more inclusive generative AI systems and equitable dataset representation over a wide range of cultures.
Figures


Figures from the paper (14 more)







Forward citations
Cited by 2 Pith papers
-
Exposing Blindspots: Cultural Bias Evaluation in Generative Image Models
When countries are not named, image models default to US-like modern styles, and iterative image editing erodes cultural fidelity that CLIPScore misses but human raters and a culture-aware VQA metric catch.
-
CuRe: Cultural Gaps in the Long Tail of Text-to-Image Systems
CuRe scores text-to-image systems by how much their output changes as prompts add cultural details, and reports better agreement with human ratings than existing proxies.
Reference graph
Works this paper leans on
-
[1]
A panoramic view of {landmark} in {country}, realistic
“A panoramic view of {landmark} in {country}, realistic”
-
[2]
An image of {clothes} from {country} clothing, realistic
“An image of {clothes} from {country} clothing, realistic”
-
[3]
An image of {food} from {country} cuisine, realistic
“An image of {food} from {country} cuisine, realistic” For example:
-
[5]
Imagereward: learning and evaluating human preferences for text-to-image generation. InProceed- ings of the 37th International Conference on Neu- ral Information Processing Systems, pages 15903– 15935. Youngsik Yun and Jihie Kim. 2024. Cic: A framework for culturally-aware image captioning.arXiv preprint arXiv:2402.05374. Richard Zhang, Phillip Isola, Ale...
arXiv 2024
-
[6]
Inversion-based style transfer with diffusion models. InProceedings of the IEEE/CVF conference on computer vision and pattern recognition, pages 10146–10156. Li Zhou, Antonia Karamolegkou, Wenyu Chen, and Daniel Hershcovich. 2023. Cultural compass: Pre- dicting transfer learning success in offensive lan- guage detection with cultural features. InFindings ...
work page 2023
-
[10]
A panoramic view of the Empire State Building in the United States, realistic
“A panoramic view of the Empire State Building in the United States, realistic”
-
[11]
An image of Hanfu from Chinese clothing, re- alistic
“An image of Hanfu from Chinese clothing, re- alistic”
-
[12]
An image of plov from Azerbaijani cuisine, realistic
“An image of plov from Azerbaijani cuisine, realistic” Additionally, we experimented with various prompting techniques, including GPT-4-generated detailed prompts. However, we observed that these prompts occasionally introduced hallucinations leading to inaccurate image generation. Through empirical analysis, we found that simpler prompts tended to provid...
work page 2023
Show all 13 references
-
[13]
is a 12-billion-parameter rectified flow trans- former. A.2.2 Model Training For model training, we used ViT-Base (Alexey, 2020), which has 86 million parameters, 12 layers, a hidden size of 768, an MLP size of 3072, and 12 attention heads. We trained our contrastive learning ...
2020
-
[2010]
Jack Hessel, Ari Holtzman, Maxwell Forbes, Ronan Le Bras, and Yejin Choi
The weirdest people in the world?Behavioral and brain sciences, 33(2-3):61–83. Jack Hessel, Ari Holtzman, Maxwell Forbes, Ronan Le Bras, and Yejin Choi. 2021. Clipscore: A reference-free evaluation metric for image captioning. InProceedings of the 2021 Conference on Empiri- ca...
2021 arXiv
-
[2022]
Dustin Podell, Zion English, Kyle Lacey, Andreas Blattmann, Tim Dockhorn, Jonas Müller, Joe Penna, and Robin Rombach
Training language models to follow instruc- tions with human feedback.Advances in neural in- formation processing systems, 35:27730–27744. Dustin Podell, Zion English, Kyle Lacey, Andreas Blattmann, Tim Dockhorn, Jonas Müller, Joe Penna, and Robin Rombach. 2023. Sdxl: Improvin...
2023 arXiv
-
[2023]
InProceed- ings of the IEEE/CVF International Conference on Computer Vision, pages 5136–5147
Inspecting the geographical representativeness of images from text-to-image models. InProceed- ings of the IEEE/CVF International Conference on Computer Vision, pages 5136–5147. James Betker, Gabriel Goh, Li Jing, Tim Brooks, Jian- feng Wang, Linjie Li, Long Ouyang, Juntang Zh...
2023 arXiv
-
[2024]
InForty-first Interna- tional Conference on Machine Learning
Scaling rectified flow transformers for high- resolution image synthesis. InForty-first Interna- tional Conference on Machine Learning. William Gaviria Rojas, Sudnya Diamos, Keertan Kini, David Kanter, Vijay Janapa Reddi, and Cody Cole- man. 2022. The dollar street dataset: Im...
2022
Reviewed August 7, 2026 · model on record in the stance chip above.
Discussion (0). Continue with ORCID to comment.