REVIEW 3 major objections 5 minor 84 references
Landscapes and nonequilibrium fluctuations of eukaryotic gene regulation
T0 review · 3 major / 5 minor · reviewed 2026-08-07 · deepseek-v4-flash
Pith's one-line read A single ratio of chromatin-switch rate to protein turnover rate shapes gene-regulation landscapes and fluctuations.
desk verdict A useful multi-gene extension of the eddy/landscape model, with a compelling omega-based explanation for Nanog heterogeneity, but the central entropy-production claim rests on an unvalidated continuous approximation of discrete chromatin states. read the letter →
The pith
A machine-rendered reading of the paper's core claim, the machinery that carries it, and where it could break.
The reading
What carries the argument
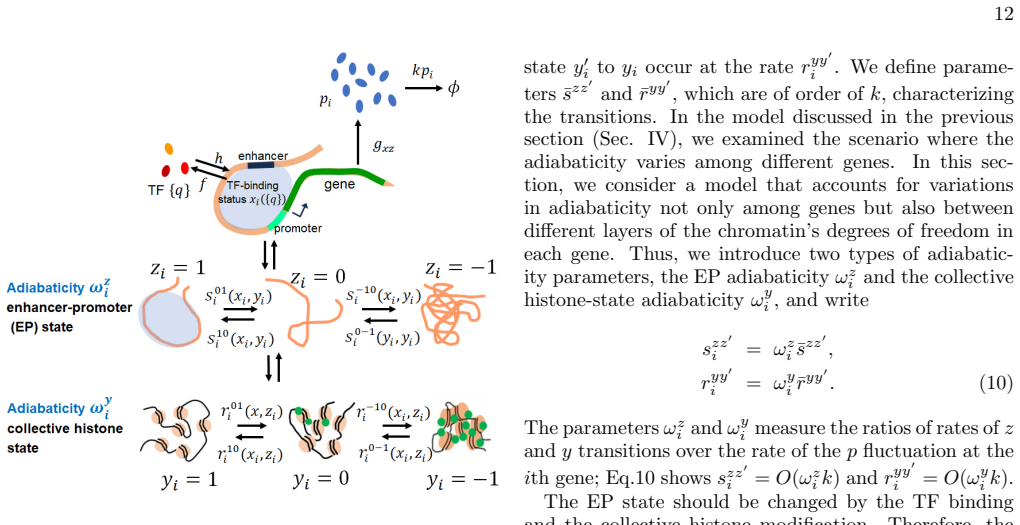
The load-bearing object is the extended landscape $U(p,y)=-\log P(p,y)$ built from the stationary distribution of coupled Langevin equations for continuous protein concentration $p_i$ and continuous chromatin state $y_i$ (and later the enhancer-promoter state $z_i$). The equations are derived by writing the discrete-state master equation in path-integral form and applying the saddle-point approximation, which truncates fluctuations at second order and yields Gaussian noise with diffusion constants set by the volume $\Omega$ and the adiabaticity $\omega_i$. The circular, divergence-free component of the probability current $J$ signals broken detailed balance; entropy production is computed from $\dot{S}=\int\int dp\,dy\,(J_p^2/(P D_p)+J_y^2/(P D_y))$; and time ordering is quantified by the cross-correlation $A(t)$, whose peak at $t\approx 1/\omega$ marks the chromatin turnover time. These objects carry the argument: the current drives hysteresis, $A(t)$ detects it, and $\dot{S}$ quantifies dissipation.
What would settle it
Simulate the original discrete-state jump master equation (for example, by the Gillespie algorithm) with the same transition rates and compare the cross-correlation $A(1/\omega)$ and entropy production $\dot{S}/\omega$: if the positive time-ordering and the dissipation peak near $0.01 \lesssim \omega \lesssim 0.1$ disappear or move outside the eddy regime, the continuous saddle-point approximation is the source of the claimed nonequilibrium effects.
Extended reading notes
Core claim
The central claim is that $\omega$, the ratio of the chromatin-state transition rate to the protein concentration change rate, is a control parameter for nonequilibrium fluctuations in eukaryotic gene circuits, not just a correction to adiabatic gene-network theory. As $\omega$ is lowered below unity, landscapes $U=-\log P$ develop additional basins; in the eddy regime $0.1 \lesssim \omega \lesssim 1$ the stationary probability current circulates, detailed balance is broken, and the cross-correlation $A(t)$ between chromatin state $y$ and protein concentration $p$ becomes positive at positive lag, meaning $y$ changes first and $p$ follows in both activation and inactivation. The entropy production rate $\dot{S}$ per chromatin turnover time is low in the adiabatic limit, rises through the eddy regime, peaks for $0.01 \lesssim \omega \lesssim 0.1$, and decreases at smaller $\omega$. In the mutually repressing two-gene circuit the circular fluxes appear even before the basin bifurcation, acting as precursors. For the Oct4\textendash Sox2\textendash Nanog circuit, heterogeneous adiabaticity\textemdash slow chromatin transitions for Nanog ($\omega_3 \approx 0.2$\textendash $0.5$) and fast transitions for Oct4 and Sox2 ($\omega_1 = \omega_2 \approx 10$)\textemdash produces exactly the experimentally observed heterogeneous fluctuation pattern without invoking Nanog self-activation or mutual repression.
Load-bearing premise
The entire calculation depends on treating the discrete chromatin state $y$ (and, in the deeper model, the enhancer-promoter state $z$) as continuous variables with Gaussian noise through the saddle-point approximation; if real chromatin transitions are genuinely discrete and rare, the continuous landscape, the circular probability current, and the entropy-production formula may describe an artifact of that approximation rather than the cell.
Editorial extensions
If this is right
- If the central claim holds, eukaryotes with $\omega \approx 0.1$ are generically in the nonadiabatic regime, so slow histone modifications should produce extra landscape basins and larger expression fluctuations than adiabatic models predict.
- The circular probability flux appears before the emergence of the off-diagonal basins in the two-gene toggle, so circular currents are a precursor or early-warning signal of switching; the paper suggests RNA-velocity-style measurements could detect them.
- For mouse embryonic stem cells, the observed wide Nanog fluctuations can be explained by slow chromatin transitions at the Nanog locus alone, without Nanog self-activation or mutual repression among the three core genes.
- Because $\omega$ can be tuned by chromatin-modifying enzyme activity, cells could pass from stable nonadiabatic basins through a fluctuating eddy regime to different stabilized states, providing a physical route for cell-type transitions.
- In the deep-epigenetic model, the predicted signature is a diagonal circular current between Nanog's enhancer-promoter state $z_3$ and protein concentration $p_3$, plus a projected current flowing from high- to low-Nanog states; the paper argues this is experimentally testable with combined Hi-C, ChIP-seq, and RNA-seq data.
Reading between the lines
- The same qualitative phenomenology\textemdash basin proliferation, positive $A(t)$, and a dissipation peak\textemdash should survive in the original discrete jump master equation, but the location of the peak may shift; a Gillespie simulation of the discrete model with the same parameters would calibrate the continuous approximation.
- The per-gene $\omega$ mechanism suggests a general design principle for synthetic gene circuits: heterogeneity can be programmed by choosing chromatin modification rates rather than promoter strengths, which might be cheaper or more reversible in engineered cells.
- If the entropy-production peak is confirmed, it implies that regulation operating at timescales comparable to protein turnover is thermodynamically costly; this could reflect a trade-off between stability (slow switching) and flexibility (fast response) that natural selection tunes.
- The projected divergence of the probability current in the Oct4-Nanog plane is a falsifiable signature: time-resolved single-cell data that show no directional flow from high- to low-Nanog would count against the heterogeneous-$\omega$ hypothesis.
Signed reviews
Editorial analysis
A structured set of objections, weighed in public.
Referee Report
Summary. The manuscript extends a stochastic landscape model of eukaryotic gene regulation from a single gene to multi-gene circuits. The authors define an adiabaticity parameter omega as the ratio of the chromatin-state transition rate to the protein-concentration relaxation rate, replace discrete chromatin states by continuous variables through a saddle-point approximation, and integrate coupled Langevin equations for protein concentration and chromatin state (Eq. 4). For a self-activating single-gene circuit and a mutually repressing two-gene circuit, they compute stationary landscapes, probability currents, the cross-correlation A(t), and an entropy-production measure (Eq. 9). They report that decreasing omega increases the number of landscape basins, that the eddy regime 0.1-1 hosts circular probability currents and hysteresis, and that the entropy production per chromatin turnover time peaks in the intensely nonadiabatic regime. They then apply the model to a three-gene Oct4-Sox2-Nanog circuit in mouse embryonic stem cells, proposing that heterogeneous per-gene omega values, extended by a 'deep epigenetic' two-layer chromatin model, can explain the wide Nanog fluctuations and narrow Oct4/Sox2 distributions observed experimentally.
Significance. If its central claims survive validation, the paper offers a physically suggestive control parameter, omega, for nonequilibrium fluctuations in gene circuits, and it makes concrete, testable predictions about circular probability currents and hysteresis in chromatin-protein dynamics. The manuscript is transparent in its parameter choices, tabulates all rates, and includes useful robustness checks (monomer versus dimer transcription factors, two-state versus three-state chromatin, alternative parameterizations in Appendices C-E). The main strength is the breadth of the conceptual framework: it connects a single quantitative parameter to basin structure, current circulation, entropy production, and cell-to-cell heterogeneity in pluripotency genes. The main limitations are that the central quantitative claims rest on an uncontrolled continuous approximation of discrete chromatin variables, and the mES cell application currently selects parameters after the fact rather than validating them against independent data.
major comments (3)
- [II.B, Eq. (4), Appendix A] The continuous Gaussian description of the discrete chromatin variables is an uncontrolled approximation. The underlying process is a three-state Markov chain for y_i with rates given by Eqs. 2-3. The saddle-point/truncation at second order has no small parameter for y_i, and the noise amplitude D_yi = (G_yi + F_yi)/(2 omega_i) actually grows as omega_i decreases, i.e., in the regime where the paper's central peak in Fig. 9D appears. The reflecting-wall treatment in Appendix A, which excludes 5% of the domain from the Eq. 9 integral, demonstrates that the diffusion dynamics generate spurious boundary currents; without a direct simulation of the original jump master equation (or a Gillespie simulation of the discrete-state process) there is no way to know whether the circular currents, the hysteresis measure A(t), and the entropy-production peak are physical or artifacts. I request an explicit comparison of P(p,y), J, and Sdot between Eq. 4 and the discrete-state master equation at representative omega values, including omega = 0.01, 0.1, and 1.
- [III, Eq. (9), Fig. 9D] Equation 9 is the diffusion-form entropy production rate, integral of J^2/(2DP), but for the original jump process the correct entropy production rate is the sum over transitions of (r_forward P_backward_state - r_backward P_forward_state) times ln(r_forward/r_backward). These two expressions need not have the same dependence on omega. Moreover, Fig. 9D plots Sdot/omega, the entropy produced per chromatin turnover time, not the absolute entropy production rate, so the abstract's phrase 'maximum entropy production' is not directly supported by the figure. The authors should either compute the discrete-state entropy production rate and show that it peaks in the same regime, or revise the abstract to say 'maximum entropy production per chromatin turnover time' and clearly state that this is the plotted quantity.
- [IV, Figs. 10-11, Appendix E] The mES cell result is obtained with adiabaticity parameters that appear to be chosen after the fact: omega1 = omega2 = 10 and omega3 = 0.5 are set so that the desired wide-Nanog/narrow-Oct4 pattern emerges, and Appendix E shows that neighboring parameterizations destroy the match. As presented, this is a proof of principle that heterogeneous omega values can tune fluctuations in a circuit, not a validation of the proposed explanation for the experimental data. To make the explanatory claim load-bearing, the authors should state this status explicitly and provide a falsifiable prediction that can be tested against independent data, such as measured chromatin-state lifetimes at the three loci, single-cell time-series cross-correlations, or the projected current divergence pattern of Fig. 14D.
minor comments (5)
- [Eq. (13)] In the second line of Eq. 13 the variable is written as v_i, while the text and the rest of the equation use y_i; the notation should be made consistent.
- [Appendix A] The numerical section does not state the stochastic integration convention. The Euler discretization implicitly uses the Ito convention; this should be stated explicitly, since the noise amplitudes depend on p and y and the convention affects boundary behavior and current statistics.
- [Fig. 9] The caption lists panel (C) twice and omits a caption for panel (F); the labels should be corrected, and the definition of Sdot/omega should be repeated in the caption for clarity.
- [Throughout] There are several typographical errors, including 'dacetylated', 'calcutated', 'adiavaticiy', 'landscapt', and 'swiching' in Sections V and Appendix E; these should be corrected in a final proofreading pass.
- [References] References [27] and [29] appear to share the same title 'Enhancer dynamics: Unraveling the mechanism of transcriptional bursting' but cite different venues; please verify that both entries are correct and distinct.
Circularity Check
The mES-cell fluctuation 'prediction' is wired in via chosen omega values; the core landscape and entropy-production results are independent.
-
fitted input called prediction
[Section IV.B, Fig. 11, and Eq. 6]
"Consequently, our hypothesis suggests that Nanog exhibits slow transitions in its chromatin state, leading to an adiabaticity of omega3 = 0.2 ~ 0.5. In contrast, Oct4 and Sox2 demonstrate rapid transitions, resulting in greater adiabaticity of omega1 and omega2. ... Fig. 11 shows the calculated landscape with heterogeneous adiabaticity parameters: omega1 = omega2 = 10 for Oct4 and Sox2 and omega3 = 0.5 for Nanog. ..."
Eq. 6 defines Dyi = (Gyi + Fyi)/(2 omega_i), so omega directly controls the noise amplitude of the chromatin variable. Choosing omega3 = 0.5 and omega1 = omega2 = 10 therefore preselects the wide-Nanog, narrow-Oct4/Sox2 fluctuation pattern that is then presented as consistent with the experimental data. No independent estimate of omega3 versus omega1/omega2 is supplied; the values are chosen after the fact. Appendix E confirms that other parameter choices eliminate the match, showing that the agreement is a selected input rather than an emergent model prediction. The paper itself notes at Eq. 6 that 'the volume Omega and the adiabaticity omega determine the fluctuation amplitude of p and y, respectively.'
full rationale
The paper's main theoretical results—the increase in landscape basin number as omega decreases, the eddy-regime circular probability current, the entropy-production peak, and the hysteresis/cross-correlation time-ordering—are generated by explicit simulation of Eq. 4 and are not fitted to the phenomena they explain; they are compared with independent experimental observations such as lambda/tet repressor switching or chromatin timescale estimates. The genuinely circular element is the Circuit C application: the heterogeneous mES fluctuation pattern is imposed by selecting low omega3 and high omega1/omega2, and Eq. 6 makes omega the fluctuation amplitude by construction. The authors are transparent that this is a hypothesis rather than an independently measured parameterization, but the resulting 'consistency' and the Fig. 14 probability currents are presented as predictions even though the key output (wide Nanog, narrow Oct4/Sox2) is encoded in the chosen inputs. This partial circularity does not invalidate the Circuits A and B results or the general entropy-production/hysteresis analysis.
Assumptions & free parameters
free parameters (6)
- Adiabaticity parameter omega_i =
Circuits A and B: scanned 10^-3 to 10^2; Circuit C: omega1=omega2=10, omega3=0.5
- Typical protein concentration pbar =
1.0 (Circuit A), 1.2 or 3 (Circuit B), 2 (Circuit C); scanned 0 to 10
- Chromatin transition coefficients mu and gamma (Table II) =
e.g., mu_{0,-1}=k, gamma_{0,-1}=0.6k in Circuit A; signs and magnitudes in Table II
- TF binding parameter ratios h0/f and h1/f =
h0/f=10 in all circuits; h1/f=200 in Circuit C
- Normalized protein synthesis rates xi_xy (Table II) =
e.g., xi11=pbar, xi01=0.2 pbar, xi10=0.2, xi00=0.2, others 0
- Deep epigenetic parameters (Table III) =
nu, sigma, gamma_x, gamma_z coefficients in k units
assumptions (6)
- domain assumption The saddle-point approximation (truncation of fluctuations at second order) maps the discrete-state master equation to continuous Langevin equations.
- domain assumption Chromatin state y and EP state z can be treated as continuous variables in [-1,1] with reflecting walls.
- domain assumption TF binding equilibrates rapidly (adiabatic approximation), so x_i = h/(f+h).
- ad hoc to paper The entropy production rate of Eq. 9 is the true physical entropy production of the underlying gene-switching process.
- ad hoc to paper In Circuit C, Nanog's transcription initiation complex spans the domain, linking its EP state to the collective histone state, giving a low omega_z3.
- domain assumption The noise in Eq. 4 is interpreted in the Ito sense for numerical integration.
invented entities (1)
-
EP state variable z_i (enhancer-promoter state)
independent evidence
Cite this review
Pith. "Pith review of Landscapes and nonequilibrium fluctuations of eukaryotic gene regulation." pith.science (2026). https://pith.science/paper/R34P57NB
@misc{pith2026250210067,
  author       = {Pith},
  title        = {Pith review of: Landscapes and nonequilibrium fluctuations of eukaryotic gene regulation},
  year         = {2026},
  howpublished = {\url{https://pith.science/paper/R34P57NB}},
  note         = {Machine review of arXiv:2502.10067}
}
read the original abstract
Understanding the interplay among processes that occur over different timescales is a challenging issue in the physics of systems regulation. In gene regulation, the timescales for changes in chromatin states can differ from those for changes in the concentration of product protein, raising questions about how to understand their coupled dynamics. In this study, we examine the effects of these different timescales on eukaryotic gene regulation using a stochastic model that describes the landscapes and probability currents of nonequilibrium fluctuations.This model shows that slow, nonadiabatic transitions of chromatin states significantly impact gene-regulation dynamics. The simulated circular flow of the probability currents indicates a maximum entropy production when the rates of chromatin-state transitions are low in the intensely nonadiabatic regime. In the mildly nonadiabatic regime, this circular flow fosters hysteresis, suggesting that changes in chromatin states precede changes in transcription activity. Furthermore, calculations using a model of a circuit involving three core genes in mouse embryonic stem cells illustrate how the timescale difference can tune fluctuations in individual genes. These findings highlight the rich effects of nonadiabatic chromatin-state transitions on gene regulation in eukaryotic cells.
Figures


Figures from the paper (16 more)




Reference graph
Works this paper leans on
-
[1]
We use the adiabatic approximation to derive x1 and x2, resulting in x1 = x12 = h0p2 2/(h0p2 2+f ) and x2 = x21 = h0p2 1/(h0p2 1+ f ). We write ¯p = ξ10. Circuit C, Three-gene circuit model of pluripotency By exploring Circuits A and B, we analyze how the landscapes and nonequilibrium fluctuations depend on the adiabaticity ωi of the chromatin-state dynam...
-
[2]
C. J. Honey, R. K¨ otter, M. Breakspear, and O. Sporns, Network structure of cerebral cortex shapes functional connectivity on multiple time scales, Proc Natl Acad Sci U S A 104, 10240 (2007)
work page 2007
-
[3]
chromatin domains
Chemical modifications of histones The variable yi represents whether the chemical mod- ification of histones in a chromatin domain to which the ith gene belongs is of the active ( yi = 1) or inactive (yi = −1) type. As transitions in the histone modifica- tion patterns can be slower than changes in the protein concentration, we explore the nonadiabatic d...
-
[4]
In the cur- rent model, we focus on scenarios where h or f does not explicitly depend on the condensation level of the chro- matin domain yi
Coupling between the histone and TF-binding states The binding and unbinding rates, represented by h and f , determine the TF-binding state xi. In the cur- rent model, we focus on scenarios where h or f does not explicitly depend on the condensation level of the chro- matin domain yi. This lack of dependence is expected when the size of the TFs is suffici...
-
[5]
We write ¯ p = ξ11, which is a typical value of p
We use the adiabatic approximation for representing the TF-binding state x with its equilibrium value x = h0p2/(h0p2 + f ). We write ¯ p = ξ11, which is a typical value of p. Circuit B, Mutually repressing two-gene circuit We consider a circuit of mutually repressing two genes (Fig. 3B). Though this mutually repressing circuit is 16 TABLE II. Parameters u...
-
[6]
G. Nicoletti and D. M. Busiello, Information propaga- tion in multilayer systems with higher-order interactions across timescales, Phys Rev X 14, 021007 (2024)
work page 2024
-
[7]
M. Sasai and P. G. Wolynes, Stochastic gene expression as a many-body problem, Proc Natl Acad Sci U S A 100, 20 2374 (2003)
work page 2003
-
[8]
Hastings, Timescales, dynamics, and ecological under- standing, Ecology 91, 3471 (2010)
A. Hastings, Timescales, dynamics, and ecological under- standing, Ecology 91, 3471 (2010)
work page 2010
Show all 84 references
-
[9]
M´ elyk´ uti, J
B. M´ elyk´ uti, J. P. Hespanha, and M. Khammash, Equi- librium distributions of simple biochemical reaction sys- tems for time-scale separation in stochastic reaction net- works, J R Soc Interface 11, 20140054 (2014)
2014
-
[10]
Senkowski and A
D. Senkowski and A. K. Engel, Multi-timescale neural dynamics for multisensory integration, Nat Rev Neurosci 25, 625 (2024)
2024
-
[11]
Ela and M
E. Ela and M. O’Malley, Studying the variability and uncertainty impacts of variable generation at multiple timescales, IEEE Transactions on Power Systems 27, 1324 (2012)
2012
-
[12]
C. Chen, K. Zhang, H. Feng, M. Sasai, and J. Wang, Multiple coupled landscapes and non-adiabatic dynam- ics with applications to self-activating genes, Phys Chem Chem Phys 17, 29036 (2015)
2015
-
[13]
A. M. Walczak, J. N. Onuchic, and P. G. Wolynes, Abso- lute rate theories of epigenetic stability, Proc Natl Acad Sci U S A 102, 18926 (2005)
2005
-
[14]
Shi and H
P.-Z. Shi and H. Qian, A perturbation analysis of rate theory of self-regulating genes and signaling networks, J Chem Phys 127, 065104 (2011)
2011
-
[15]
J. E. M. Hornos, D. Schultz, G. C. P. Innocentini, J. Wang, A. M. Walczak, J. N. Onuchic, and P. G. Wolynes, Self-regulating gene: an exact solution, Phys Rev E 72, 051907 (2005)
2005
-
[16]
Zhang, M
K. Zhang, M. Sasai, and J. Wang, Eddy current and coupled landscapes for nonadiabatic and nonequilibrium complex system dynamics, Proc Natl Acad Sci U S A 110, 14930 (2013)
2013
-
[17]
X. Fang, Q. Liu, C. Bohrer, Z. Hensel, W. Han, J. Wang, and J. Xiao, Cell fate potentials and switching kinetics uncovered in a classic bistable genetic switch, Nat Com- mun 9, 2787 (2018)
2018
-
[18]
Bhattacharyya, J
B. Bhattacharyya, J. Wang, and M. Sasai, Stochastic epi- genetic dynamics of gene switching, Phys Rev E 102, 042408 (2020)
2020
-
[19]
Tkaˇ cik and A
G. Tkaˇ cik and A. M. Walczak, Information transmission in genetic regulatory networks: a review, J Phys Condens Matter 23, 153102 (2011)
2011
-
[20]
J. Elf, G. W. Li, and X. S. Xie, Probing transcription factor dynamics at the single-molecule level in a living cell, Science 316, 1191 (2007)
2007
-
[21]
Zheng, P
H. Zheng, P. Y. Ho, M. Jiang, B. Tang, W. Liu, D. Li, X. Yu, N. E. Kleckner, A. Amir, and C. Liu, Interro- gating the Escherichia coli cell cycle by cell dimension perturbations, Proc Natl Acad Sci U S A 113, 15000 (2016)
2016
-
[22]
Bintu, J
L. Bintu, J. Yong, Y. E. Antebi, K. McCue, Y. Kazuki, N. Uno, M. Oshimura, and M. B. Elowitz, Dynamics of epigenetic regulation at the single-cell level, Science 351, 720 (2016)
2016
-
[23]
Jiang, L
Z. Jiang, L. Tian, X. Fang, K. Zhang, Q. Liu, Q. Dong, E. Wang, and J. Wang, The emergence of the two cell fates and their associated switching for a negative auto- regulating gene, BMC Biol 17, 49 (2019)
2019
-
[24]
Schultz, E
D. Schultz, E. Ben Jacob, J. N. Onuchic, and P. G. Wolynes, Molecular level stochastic model for compe- tence cycles in Bacillus subtilis , Proc Natl Acad Sci U S A 104, 17582 (2007)
2007
-
[25]
Golding, J
I. Golding, J. Paulsson, S. M. Zawilski, and E. C. Cox, Real-time kinetics of gene activity in individual bacteria, Cell 123, 1025 (2005)
2005
-
[26]
N. A. Hathaway, O. Bell, C. Hodges, E. L. Miller, D. S. Neel, and G. R. Crabtree, Dynamics and memory of het- erochromatin in living cells, Cell 149, 1447 (2012)
2012
-
[27]
Tiana, H
X.-J. Tiana, H. Zhang, J. Sannerud, and J. Xing, En- hancer dynamics: Unraveling the mechanism of tran- scriptional bursting, Proc Natl Acad Sci U S A 113, E2889 (2016)
2016
-
[28]
A. B. Alber, E. R. Paquet, M. Biserni, F. Naef, and D. M. Suter, Single live cell monitoring of protein turnover re- veals intercellular variability and cell-cycle dependence of degradation rates, Mol Cell 71, 1079 (2018)
2018
-
[29]
Thomson, S
M. Thomson, S. J. Liu, L. N. Zou, Z. Smith, A. Meiss- ner, et al. , Pluripotency factors in embryonic stem cells regulate differentiation into germ layers, Cell 145, 875 (2011)
2011
-
[30]
Sasai, Y
M. Sasai, Y. Kawabata, K. Makishi, K. Itoh, and T. P. Terada, Time scales in epigenetic dynamics and pheno- typic heterogeneity of embryonic stem cells, PLoS Com- put Biol 9, e1003380 (2013)
2013
-
[31]
S. S. Ashwin and M. Sasai, Effects of collective histone state dynamics on epigenetic landscape and kinetics of cell reprogramming, Sci Rep 5, 16746 (2015)
2015
-
[32]
J. Chen, Z. Zhang, L. Li, B. C. Chen, A. Revyakin, B. Hajj, W. Legant, M. Dahan, T. Lionnet, E. Betzig, R. Tjian, and Z. Liu, Single-molecule dynamics of en- hanceosome assembly in embryonic stem cells, Cell 156, 1274 (2014)
2014
-
[33]
Folguera-Blasco, R
N. Folguera-Blasco, R. P´ erez-Carrasco, E. Cuy´ as, J. A. Menendez, and T. Alarc` on, A multiscale model of epi- genetic heterogeneity-driven cell fate decision-making, PLoS Comput Biol 15, e1006592 (2019)
2019
-
[34]
Fukaya, Enhancer dynamics: Unraveling the mech- anism of transcriptional bursting, Sci Adv 9, eadj3366 (2023)
T. Fukaya, Enhancer dynamics: Unraveling the mech- anism of transcriptional bursting, Sci Adv 9, eadj3366 (2023)
2023
-
[35]
E. A. Leyes Porello, R. T. Trudeau, and B. Lim, Tran- scriptional bursting: stochasticity in deterministic devel- opment, Development 150, dev201546 (2023)
2023
-
[36]
J. V. W. Meeussen and T. L. Lenstra, Time will tell: comparing timescales to gain insight into transcriptional bursting, Trends Genet 40, 160 (2024)
2024
-
[37]
Maeshima, K
K. Maeshima, K. Kaizu, S. Tamura, T. Nozaki, T. Kokubo, and K. Takahashi, The physical size of tran- scription factors is key to transcriptional regulation in chromatin domains, J Phys Cond Matter 27, 064116 (2015)
2015
-
[38]
Mazzocca, E
M. Mazzocca, E. Colombo, A. Callegari, and D. Mazza, Transcription factor binding kinetics and transcriptional bursting: What do we really know?, Curr Opin Str Biol 71, 239 (2021)
2021
-
[39]
Misteli, The self-organizing genome: Principles of genome architecture and function, Cell 183, 28 (2020)
T. Misteli, The self-organizing genome: Principles of genome architecture and function, Cell 183, 28 (2020)
2020
-
[40]
A. J. Bannister and T. Kouzarides, Regulation of chro- matin by histone modifications, Cell Res 21, 381 (2011)
2011
-
[41]
Minami, K
K. Minami, K. Nakazato, S. Ide, K. Kaizu, K. Higashi, S. Tamura, A. Toyoda, K. Takahashi, K. Kurokawa, and K. Maeshima, Replication-dependent histone la- beling dissects the physical properties of euchro- matin/heterochromatin in living human cells, Sci Adv 11, eadu8400 (2025)
2025
-
[42]
Sood and B
A. Sood and B. Zhang, Quantifying epigenetic stability with minimum action paths, Phys Rev E 101, (2020)
2020
-
[43]
R. B. Deal, J. G. Henikoff, and S. Henikoff, Genome-wide kinetics of nucleosome turnover determined by metabolic labeling of histones, Science 328, 1161 (2010)
2010
-
[44]
I. B. Dodd, M. A. Micheelsen, K. Sneppen, and G. Thon, Theoretical analysis of epigenetic cell memory by nucle- osome modification, Cell 129, 813 (2007)
2007
-
[45]
Zhang, X
H. Zhang, X. J. Tian, A. Mukhopadhyay, K. S. Kim, and J. Xing, Statistical mechanics model for the dynamics of collective epigenetic histone modification, Phys Rev Lett 112, 068101 (2014)
2014
-
[46]
E. J. Chory, J. P. Calarco, N. A. Hathaway, O. Bell, D. S. Neel, and G. R. Crabtree, Nucleosome turnover regulates histone methylation patterns over the genome, Mol Cell , 61 (2019)
2019
-
[47]
A. M. Miangolarra, D. S. Saxton, Z. Yan, J. Rine, and M. Howard, Two-way feedback between chromatin com- paction and histone modification state explains Saccha- romyces cerevisiae heterochromatin bistability, Proc Natl Acad Sci U S A 121, e2403316121 (2024)
2024
-
[48]
J. A. Owen, D. Osmanovi´ c, and L. Mirny, Design prin- 21 ciples of 3D epigenetic memory systems, Science 382, eadg3053 (2023)
2023
-
[49]
Mayran and J
A. Mayran and J. Drouin, Pioneer transcription factors shape the epigenetic landscape, J Biol Chem 293, 13795 (2018)
2018
-
[50]
Henikoff and S
S. Henikoff and S. A., Histone modification: cause or cog?, Trends Genet 27, 389 (2011)
2011
-
[51]
Ptashne, Epigenetics: core misconcept, Proc Natl Acad Sci U S A 110, 7101 (2013)
M. Ptashne, Epigenetics: core misconcept, Proc Natl Acad Sci U S A 110, 7101 (2013)
2013
-
[52]
J. R. Boyer LA, Mathur D, Molecular control of pluripo- tency, Curr Opin Genet Dev 16, 455 (2006)
2006
-
[53]
J. Wang, L. Xu, and E. Wang, Potential landscape and flux framework of nonequilibrium networks: Robustness, dissipation, and coherence of biochemical oscillations, Proc Natl Acad Sci U S A 105, 12271 (2008)
2008
-
[54]
Feng and J
H. Feng and J. Wang, Potential and flux decomposi- tion for dynamical systems and non-equilibrium ther- modynamics: Curvature, gauge field, and general- ized fluctuation-dissipation theorem, J Chem Phys 135, 234511 (2011)
2011
-
[55]
X. Fang, K. Kruse, T. Lu, and J. Wang, Nonequilibrium physics in biology, Rev Mod Phys 91, 045004 (2019)
2019
-
[56]
J. Wang, S. Rao, J. Chu, X. Shen, D. N. Levasseur, et al., A protein interaction network for pluripotency of embry- onic stem cells, Nature 444, 364 (2006)
2006
-
[57]
M. A. Canham, A. A. Sharov, M. S. H. Ko, and J. M. Brickman, Functional heterogeneity of embryonic stem cells revealed through translational amplification of an early endodermal transcript, PLoS Biol 8, e1000379 (2010)
2010
-
[58]
Niwa, How is pluripotency determined and main- tained, Development 134, 635 (2007)
H. Niwa, How is pluripotency determined and main- tained, Development 134, 635 (2007)
2007
-
[59]
and the repressing interactions between Nanog and other genes [56, 59]. These assumptions allowed the models to explain the switching fluctuation between ac- tive and inactive states in Nanog and the lack of rele- vance of other genes to this fluctuation. However, the self-rep...
-
[60]
Navarro, 2i, or not 2i: The soliloquy of nanog-negative mouse embryonic stem cells, Stem Cell Reports 11, 1 (2018)
P. Navarro, 2i, or not 2i: The soliloquy of nanog-negative mouse embryonic stem cells, Stem Cell Reports 11, 1 (2018)
2018
-
[61]
A. M. Singh, T. Hamazaki, E. Katherine, N. T. Han- kowski, and T. N., A heterogeneous expression pattern for nanog in embryonic stem cells, Stem Cells 25, 2534 (2007)
2007
-
[62]
Kalmar, C
T. Kalmar, C. Lim, P. Hayward, S. Mun˜ oz Descalzo, J. Nichols, et al., Regulated fluctuations in nanog expres- sion mediate cell fate decisions in embryonic stem cells, PLoS Biol 7, e1000149 (2009)
2009
-
[63]
Hyslop, M
L. Hyslop, M. Stojkovic, L. Armstrong, T. Walter, P. Sto- jkovic, S. Przyborski, M. Herbert, A. Murdoch, T. Stra- chan, and M. Lako, Downregulation of nanog induces dif- ferentiation of human embryonic stem cells to extraem- bryonic lineages, Stem Cells 23, 1035 (2005)
2005
-
[64]
P. Yu, Q. Nie, C. Tang, and L. Zhang, Nanog induced intermediate state in regulating stem cell differentiation and reprogramming, BMC Syst Biol 12, 22 (2018)
2018
-
[65]
Samanta and S
T. Samanta and S. Kar, Dynamical reorganization of transcriptional events governs robust nanog heterogene- ity, J Phys Chem B 123, 5246 (2019)
2019
-
[66]
Navarro, N
P. Navarro, N. Festuccia, D. Colby, A. Gagliardi, et al. , Oct4/Sox2-independent Nanog autorepression modulates heterogeneous nanog gene expression in mouse es cells, EMBO J 24, 4547 (2012)
2012
-
[67]
J. L. Chew, Y. H. Loh, W. Zhang, X. Chen, W. L. Tam, et al., Reciprocal transcriptional regulation of Pou5f1 and Sox2 via the Oct4/Sox2 complex in embryonic stem cells, Mol Cell Biol 25, 6031 (2005)
2005
-
[68]
Masui, Y
S. Masui, Y. Nakatake, Y. Toyooka, D. Shimosato, R. Yagi, et al. , Pluripotency governed by Sox2 via reg- ulation of Oct3/4 expression in mouse embryonic stem cells, Nat Cell Biol 9, 625 (2007)
2007
-
[69]
Y. H. Loh, Q. Wu, J. L. Chew, V. B. Vega, W. Zhang, et al. , The oct4 and nanog transcription network regu- lates pluripotency in mouse embryonic stem cells, Nat Genet 38, 431?440 (2006)
2006
-
[70]
de Wit, B
E. de Wit, B. Bouwman, Y. Zhu, et al. , The pluripotent genome in three dimensions is shaped around pluripo- tency factor, Mol Cell 501, 227 (2013)
2013
-
[71]
Lando, X
D. Lando, X. Ma, Y. Cao, et al. , Enhancer-promoter in- teractions are reconfigured through the formation of long- range multiway hubs as mouse ES cells exit pluripotency, Mol Cell 84, 1406 (2024)
2024
-
[72]
Calo and J
E. Calo and J. Wysocka, Modification of enhancer chro- matin: what, how, and why?, Mol Cell 49, 825 (2013)
2013
-
[73]
S. I. S. Grewal, The molecular basis of heterochromatin assembly and epigenetic inheritance, Mol Cell 83, 1767 (2023)
2023
-
[74]
D. Tikk, L. T. K´ oczy, and T. D. Gedeon, A survey on universal approximation and its limits in soft computing techniques, Int J Approx Reas 33, 185 (2003)
2003
-
[75]
Krishnamurthy, T
K. Krishnamurthy, T. Can, and D. J. Schwab, Theory of gating in recurrent neural networks, Phys Rev X 12, 011011 (2022)
2022
-
[76]
Chalancon, C
G. Chalancon, C. N. Ravarani, S. Balaji, A. Martinez- Arias, L. Aravind, R. Jothi, and M. M. Babu, Interplay between gene expression noise and regulatory network architecture, Trends Genet 28, 221 (2012)
2012
-
[77]
Z. Liu, Y. Chen, Q. Xia, et al., Linking genome structures to functions by simultaneous single-cell Hi-C and RNA- seq, Science 380, 1070 (2023)
2023
-
[78]
Masuda, K
N. Masuda, K. Aihara, and N. G. MacLaren, Anticipat- ing regime shifts by mixing early warning signals from different nodes, Nat Commun 15, 1086 (2024)
2024
-
[79]
Maehara and Y
K. Maehara and Y. Ohkawa, Modeling latent flows on single-cell data using the Hodge decomposition, bioRxib , https://doi.org/10.1101/592089 (2019)
2019 doi
-
[80]
X. Qiu, Y. Zhang, J. D. Martin-Rufino, C. Weng, S. Hos- seinzadeh, D. Yang, A. N. Pogson, M. Y. Hein, K. Hoi Joseph Min, L. Wang, E. I. Grody, M. J. Shurtleff, R. Yuan, S. Xu, Y. Ma, J. M. Replogle, E. S. Lander, S. Darmanis, I. Bahar, V. G. Sankaran, J. Xing, and J. S. Weissm...
2022
-
[81]
Z. Su, Y. Tong, and G.-W. Wei, Hodge decomposition of single-cell RNA velocity, Journal of Chemical Informa- tion and Modeling 64, 3558 (2024)
2024
-
[82]
L. Zhu, S. Yang, K. Zhang, H. Wang, X. Fang, and J. Wang, Uncovering underlying physical principles and driving forces of cell differentiation and reprogramming from single-cell transcriptomics, Proc Natl Acad Sci U S A 121, e2401540121 (2024)
2024
-
[83]
Alon, Network motifs: theory and experimental ap- proaches, Nat Rev Genet 8, 450 (2007)
U. Alon, Network motifs: theory and experimental ap- proaches, Nat Rev Genet 8, 450 (2007)
2007
-
[84]
Z. Zhou, Y. Liu, Y. Feng, S. Klepin, L. S. Tsimring, L. Pillus, J. Hasty, and N. Hao, Engineering longevity- design of a synthetic gene oscillator to slow cellular aging, Science 380, 376 (2023)
2023
Reviewed August 7, 2026 · model on record in the stance chip above.
Discussion (0). Continue with ORCID to comment.