REVIEW 4 major objections 4 minor 48 references
Molecular Mechanisms Underlying the Effects of Urea and the Structural Dynamics of Bovine Serum Albumin
T0 review · 4 major / 4 minor · reviewed 2026-08-16 · deepseek-v4-flash
Pith's one-line read Urea's action on BSA is a concentration-dependent dehydration–rehydration cycle, not simple progressive denaturation.
desk verdict The rehydration limb of the claimed dehydration–rehydration cycle is a normalization artifact; the dehydration-to-plateau data are solid and worth publishing with revision. read the letter →
The pith
A machine-rendered reading of the paper's core claim, the machinery that carries it, and where it could break.
The reading
What carries the argument
The machinery that carries the argument is the protein–solvent hydrogen-bond budget. The authors count hydrogen bonds with the geometric criterion donor–acceptor distance ≤ 0.35 nm and angle ≤ 30°, normalized by the number of molecules of each species. When protein–water hydrogen bonds are divided by the number of water molecules present, the value falls to a minimum at 2 M urea and then climbs at 3–5 M, which the paper reads as a dehydration phase followed by rehydration. This normalized count, together with the radial distribution functions of water and urea around the protein's center of mass, is what links the low-concentration replacement of water by urea to the high-concentration urea aggregation that limits protein–urea contacts.
What would settle it
Compute the absolute, unnormalized number of protein–water hydrogen bonds per unit solvent-accessible surface area as urea concentration rises from 1 M to 5 M. If this number does not increase after 2 M, the reported rehydration phase is an artifact of normalization.
Extended reading notes
Core claim
The paper reports that urea does not progressively strip water from BSA as its concentration rises. Instead, the simulations show a dehydration–rehydration cycle: up to about 2 M, urea increasingly replaces protein–water hydrogen bonds with protein–urea hydrogen bonds, dehydrating the protein surface; above 2 M, urea molecules begin to self-aggregate, protein–urea contacts plateau, protein–water hydrogen bonds per water molecule recover, and the protein partially rehydrates. Throughout this cycle the total number of protein–solvent hydrogen bonds stays nearly constant, the radius of gyration changes by at most 6%, the secondary structure is largely preserved—with a slight increase in α-helix content—and the main structural response is a modest expansion, most visible in Domain 3, that the authors interpret as early tertiary-structure perturbation rather than full denaturation.
Load-bearing premise
The rehydration phase rests on a count of protein–water hydrogen bonds divided by the total number of water molecules; that ratio can go up simply because there are fewer water molecules, even when the protein surface is not actually getting wetter.
Editorial extensions
If this is right
- Above about 2 M, additional urea no longer adds protein–urea hydrogen bonds; extra urea molecules aggregate instead, so denaturant action on the protein saturates.
- Secondary structure, especially α-helical content, survives 5 M urea while tertiary contacts loosen, so urea's early effect is selective for the protein's three-dimensional packing.
- The most pronounced structural response occurs at 2 M urea, where protein–water hydrogen bonds per water molecule are lowest and the radius of gyration rises most markedly.
- Total protein–solvent hydrogen bonds stay roughly constant across concentrations, so urea substitutes for water in the hydrogen-bond budget rather than simply deleting hydrogen-bonding partners.
Reading between the lines
- Editorial extension: if the cycle is real, it predicts a non-monotonic near-surface water density or water residence time that neutron scattering or NMR relaxometry could detect across the 1–5 M range.
- Editorial extension: the crossover concentration for urea self-aggregation likely depends on the protein's surface chemistry, so other proteins may show the same dehydration–rehydration minimum at different molarities.
- Editorial extension: the picture offers a way to reconcile the direct and indirect denaturation mechanisms by assigning them to different urea concentration regimes rather than to mutually exclusive molecular events.
- Editorial extension: a related prediction is that other aggregating denaturants, such as guanidinium salts, could show a similar rehydration branch at high concentration.
Signed reviews
Editorial analysis
A structured set of objections, weighed in public.
Referee Report
Summary. The paper reports molecular dynamics simulations of bovine serum albumin (BSA) in pure water and in 1–5 M urea solutions, using the GROMOS 54A7 force field with the Boek urea model and SPC/E water. Each system is equilibrated for 500 ns and then analyzed from eight 10-ns replicas; the reported observables are protein–water and protein–urea hydrogen-bond counts, radial distribution functions, radius of gyration, RMSD, SASA (total and per-domain), interdomain distances, and secondary-structure content. The central claim is that urea induces a dehydration–rehydration cycle: at low urea concentration, protein–water hydrogen bonds are replaced by protein–urea hydrogen bonds, while at concentrations above 2 M urea self-aggregation limits protein–urea contacts and promotes partial rehydration, with modest tertiary-structure changes and largely preserved secondary structure.
Significance. If the dehydration–rehydration cycle were established, it would be a useful mechanistic contribution to the long-standing debate on urea-induced protein denaturation. The study has the strengths of a standard, clearly documented simulation protocol: explicit force-field details, system compositions in Table I, error bars on the main hydrogen-bond counts, comparison with a SAXS-validated BSA topology, and domain-resolved SASA analysis. There are no fitted parameters and no derived quantitative predictions, so the paper is purely descriptive. The main limitation is that the central rehydration phase rests on a normalized hydrogen-bond count that conflates absolute bond numbers with the total number of water molecules; direct surface-hydration observables are not provided. As a result, the current data support, at most, a monotonic dehydration to a plateau, and the rehydration limb of the proposed cycle is not established.
major comments (4)
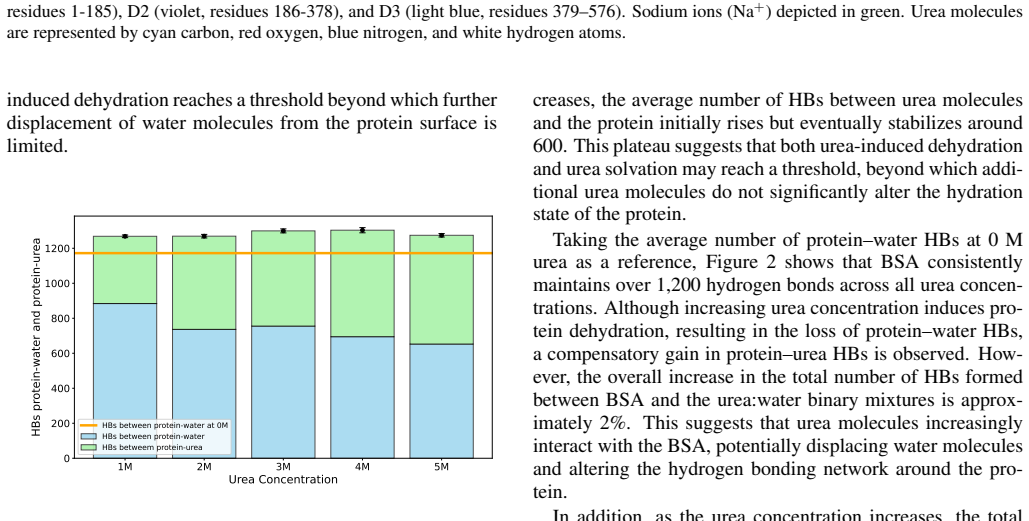
- [Section III.B, Supplementary Fig. 2] The rehydration phase is an artifact of the normalization used. The normalized protein–water hydrogen-bond count per water molecule reaches a minimum at 2 M and then rises, but the absolute protein–water H-bond count plateaus at about 700 from 2 M to 5 M (Fig. 2), while the number of water molecules falls from 53,356 at 2 M to 40,963 at 5 M (Table I). Dividing an approximately constant absolute count by a decreasing denominator produces a rise of roughly 30% in the normalized metric without any increase in actual protein–water hydrogen bonding. The paper's own statement that the normalized H-bond count is nearly constant between 1 M and 5 M despite a 30% drop in water molecules implies a 30% decrease in absolute protein–water H-bonds, i.e., continued dehydration, not rehydration. To support the rehydration claim, please report direct surface-hydration measures such as the number of water molecules in the first solvation shell around the protein, water-oxygen coordination numbers of protein atoms, and water residence times near the protein surface.
- [Sections III.B and III.C, Figs. 3 and 5] The 2 M crossover is inferred from single-point features and is not statistically tested. The claimed minimum at 2 M in the normalized H-bond count, the deviation in the protein–water RDF in Fig. 3(a), the increased radius of gyration at 2 M in Fig. 5(a), and the RMSD increase at 2 M in Fig. 5(b) are all presented without confidence intervals or significance tests across the eight replicas. The RDFs in Fig. 3 have no error bars, and the text only states that errors are 'small' without quantifying them. Because this concentration marks the transition between dehydration and rehydration in the central cycle, the authors should provide per-replica distributions, error estimates, and a statistical comparison (e.g., bootstrap or paired tests) across concentrations.
- [Section II and Section III (sampling protocol)] The sampling protocol is too limited to support a non-monotonic concentration dependence. The analyses are based on eight 10-ns replicas that are started from configurations taken from the final 8 ns of a single 500-ns trajectory, so the replicas are not independent equilibrium samples; the total analyzed production time per concentration is only 80 ns. For a 576-residue protein, small changes in Rg, domain distances, and SASA are unlikely to be converged on this timescale. Please provide convergence diagnostics such as block averaging, autocorrelation times, or multiple fully independent trajectories before interpreting small differences between concentrations as a dehydration–rehydration crossover.
- [Section II (system setup)] The reported protein net charge of +11 at pH 6.5 requires justification. BSA at pH 6.5 is experimentally negatively charged; a net charge of +11 implies a nonstandard protonation state that could materially alter the electrostatic interactions governing protein–water and protein–urea hydrogen bonding. Please state the protonation assignment used for the ionizable residues, explain how it was validated at pH 6.5, and discuss whether the qualitative conclusions are sensitive to this choice.
minor comments (4)
- [Table I, Fig. 2, Fig. 7] There are several typographical errors: 'Contraions' in Table I, 'betweem' in Fig. 2, 'Secundary Structure' and 'T urn' in Fig. 7. These should be corrected.
- [Section II and supplementary-material references] The text refers to 'Figure 1 in the supplementary material' and 'Figures 2, 3, and 4 in the supplementary material', which are easily confused with the identically numbered figures in the main text. Please relabel supplementary figures as S1, S2, etc., and update all references accordingly.
- [Section II (Methods)] The Methods state that 'production simulations were then carried out for 500 ns' and later that 'before data collection, all systems underwent 500 ns of hydration/solvation'. Please clarify whether the 500 ns runs are production or equilibration, since this affects the interpretation of the reported averages.
- [Abstract] The abstract states that urea causes 'displacement and partial replacement of water molecules in BSA's hydration shell', but no direct hydration-shell analysis is presented. Consider softening this phrasing until a first-shell water analysis is supplied, or add the missing analysis.
Circularity Check
No significant circularity: the study reports simulation observables directly, and the only self-citation is a standard topology input, not a load-bearing derivation.
full rationale
The paper does not claim a first-principles derivation or a numerical prediction from fitted parameters. BSA coordinates come from the PDB entry 4F5S; urea and water are described by standard models (Boek, GROMOS 54A7, SPC/E); and the BSA topology is imported from a prior paper by one author [33] that validated it against SAXS and MD. That prior topology is an input to the simulations, not an output of the present analysis, so citing it is not circular. The central dehydration/rehydration claim is an interpretation of hydrogen-bond counts, RDFs, and structural metrics, not a quantity constructed to equal an input. The only notable weakness is in Section III.B, where rehydration is inferred from the per-water normalized protein–water hydrogen-bond count: because the number of water molecules falls by about 30% from 1 M to 5 M (Table I) while the absolute HBs plateau near 700 (Figure 2), the normalized metric can rise without any actual rehydration; the paper itself notes that 'the normalized average number of hydrogen bonds (HBs) remains nearly constant at both concentrations' despite the water decrease. This is an interpretive/statistical limitation, not circular reasoning, and it does not raise the circularity score. No fitted parameter is renamed as a prediction, and no uniqueness theorem is imported from the authors' prior work.
Assumptions & free parameters
assumptions (4)
- domain assumption The Boek urea model with GROMOS 54A7 and SPC/E water accurately represents protein-urea-water interactions.
- domain assumption 500 ns equilibration followed by 8x10 ns production runs provides statistically converged averages of hydrogen bonds, RDFs, Rg, RMSD, SASA, and secondary structure.
- ad hoc to paper The normalized protein-water hydrogen-bond count per water molecule is a valid proxy for protein surface hydration and supports the dehydration-rehydration interpretation.
- domain assumption The BSA topology at pH 6.5 from Scanavachi et al. [33] correctly represents the N-isoform.
Cite this review
Pith. "Pith review of Molecular Mechanisms Underlying the Effects of Urea and the Structural Dynamics of Bovine Serum Albumin." pith.science (2026). https://pith.science/paper/S6I3RJTG
@misc{pith2026250416325,
  author       = {Pith},
  title        = {Pith review of: Molecular Mechanisms Underlying the Effects of Urea and the Structural Dynamics of Bovine Serum Albumin},
  year         = {2026},
  howpublished = {\url{https://pith.science/paper/S6I3RJTG}},
  note         = {Machine review of arXiv:2504.16325}
}
read the original abstract
The disruption of protein structures by denaturants like urea is well studied, though its molecular mechanisms remain unclear. Using Molecular Dynamics (MD) simulations, we investigated how urea affects the structural stability of Bovine Serum Albumin (BSA) at concentrations from 0 M to 5 M. Our results reveal that urea induces a dehydration/rehydration cycle, characterized by displacement and partial replacement of water molecules in BSAs hydration shell. At low concentrations, urea reduces protein/water hydrogen bonds while enhancing protein-urea interactions. At higher concentrations, urea aggregation limits these interactions, promoting rehydration and changes in tertiary structure, while secondary structure remains largely intact. These findings provide insights into the mechanisms of protein denaturation and stability by urea.
Figures


Figures from the paper (4 more)


Reference graph
Works this paper leans on
-
[1]
A. Wallqvist, D. Covell, and D. Thirumalai, Journal of the American Chemical Society 120, 427 (1998)
work page 1998
-
[2]
H. S. Frank and F. Franks, The Journal of Chemical Physics48, 4746 (1968)
work page 1968
-
[3]
P.-O. Åstrand, A. Wallqvist, G. Karlström, and P. Linse, The Journal of chemical physics 95, 8419 (1991)
work page 1991
-
[4]
Y . Rezus and H. Bakker, Proceedings of the National Academy of Sciences 103, 18417 (2006)
work page 2006
- [5]
-
[6]
P. Gahtori, V . Gunwant, and R. Pandey, Chemical Physics Im- pact 7, 100314 (2023)
work page 2023
-
[7]
M. C. Stumpe and H. Grubmüller, Journal of the American Chemical Society 129, 16126 (2007)
work page 2007
-
[8]
M. Lindgren and P.-O. Westlund, Physical Chemistry Chemical Physics 12, 9358 (2010)
work page 2010
Show all 48 references
-
[9]
Moeser and D
B. Moeser and D. Horinek, The Journal of Physical Chemistry B 118, 107 (2014)
2014
-
[10]
Matubayasi, The Role of Water in ATP Hydrolysis Energy Transduction by Protein Machinery , 141 (2018)
N. Matubayasi, The Role of Water in ATP Hydrolysis Energy Transduction by Protein Machinery , 141 (2018)
2018
-
[11]
O. S. Nnyigide, S.-G. Lee, and K. Hyun, Journal of Molecular Modeling 24, 1 (2018)
2018
-
[12]
Kumaran and P
R. Kumaran and P. Ramamurthy, Journal of fluorescence 21, 1499 (2011)
2011
-
[13]
J. Ma, I. M. Pazos, and F. Gai, Proceedings of the National Academy of Sciences 111, 8476 (2014)
2014
-
[14]
Sinibaldi, M
R. Sinibaldi, M. G. Ortore, F. Spinozzi, S. de Souza Funari, J. Teixeira, and P. Mariani, European Biophysics Journal 37, 673 (2008)
2008
-
[15]
Monhemi, M
H. Monhemi, M. R. Housaindokht, A. A. Moosavi-Movahedi, and M. R. Bozorgmehr, Physical Chemistry chemical physics 16, 14882 (2014)
2014
-
[16]
P. J. Rossky, Proceedings of the National Academy of Sciences 105, 16825 (2008)
2008
-
[17]
Das and C
A. Das and C. Mukhopadhyay, The Journal of Physical Chem- istry B 113, 12816 (2009)
2009
-
[18]
Niether, S
D. Niether, S. Di Lecce, F. Bresme, and S. Wiegand, Physical Chemistry Chemical Physics 20, 1012 (2018)
2018
-
[19]
L. Hua, R. Zhou, D. Thirumalai, and B. Berne, Proceedings of the National Academy of Sciences 105, 16928 (2008)
2008
-
[20]
S. K. Jha and S. Marqusee, Proceedings of the National Academy of Sciences 111, 4856 (2014)
2014
-
[21]
Guckeisen, S
T. Guckeisen, S. Hosseinpour, and W. Peukert, Journal of Col- loid and Interface Science 590, 38 (2021)
2021
-
[22]
S. H. Khan, A. Prakash, P. Pandey, A. M. Lynn, A. Islam, M. I. Hassan, and F. Ahmad, International journal of biolog- ical macromolecules 122, 695 (2019)
2019
-
[23]
Paladino, N
A. Paladino, N. Balasco, L. Vitagliano, and G. Graziano, Biol- ogy 11, 1764 (2022)
2022
-
[24]
W. K. Lim, J. Rösgen, and S. W. Englander, Proceedings of the National Academy of Sciences 106, 2595 (2009)
2009
-
[25]
S. L. Miller and N. E. Levinger, Langmuir 38, 7413 (2022)
2022
-
[26]
L. A. Baptista, Y . Zhao, K. Kremer, D. Mukherji, and R. Cortes-Huerto, ACS Macro Letters 12, 841 (2023)
2023
-
[27]
Candotti, S
M. Candotti, S. Esteban-Martín, X. Salvatella, and M. Orozco, Proceedings of the National Academy of Sciences 110, 5933 (2013)
2013
-
[28]
Maity, S
A. Maity, S. Sarkar, L. Theeyancheri, and R. Chakrabarti, ChemPhysChem 21, 552 (2020)
2020
-
[29]
L. J. Lapidus, S. Yao, K. S. McGarrity, D. E. Hertzog, E. Tub- man, and O. Bakajin, Biophysical journal 93, 218 (2007)
2007
-
[30]
I. P. de Oliveira and L. Martínez, Physical Chemistry Chemical Physics 22, 354 (2020)
2020
-
[31]
Paladino, L
A. Paladino, L. Vitagliano, and G. Graziano, Biology 12, 754 (2023)
2023
-
[32]
Gooran and K
N. Gooran and K. Kopra, International Journal of Molecular Sciences 25, 1764 (2024)
2024
-
[33]
Scanavachi, Y
G. Scanavachi, Y . Espinosa, J. S. Yoneda, R. Rial, J. Ruso, and R. Itri, Journal of colloid and interface science 572, 9 (2020)
2020
-
[34]
E. Boek, W. Briels, and D. Feil, The Journal of Physical Chem- istry 98, 1674 (1994)
1994
-
[35]
Schmid, A
N. Schmid, A. P. Eichenberger, A. Choutko, S. Riniker, M. Winger, A. E. Mark, and W. F. Van Gunsteren, European biophysics journal 40, 843 (2011)
2011
-
[36]
H. J. Berendsen, J. R. Grigera, and T. P. Straatsma, Journal of Physical Chemistry 91, 6269 (1987)
1987
-
[37]
Bujacz, Acta Crystallographica Section D: Biological Crys- tallography 68, 1278 (2012)
A. Bujacz, Acta Crystallographica Section D: Biological Crys- tallography 68, 1278 (2012)
2012
-
[38]
V . D. Spoelet al., Zenodo
-
[39]
Bussi, D
G. Bussi, D. Donadio, and M. Parrinello, The Journal of chem- ical physics 126 (2007)
2007
-
[40]
H. J. Berendsen, J. v. Postma, W. F. Van Gunsteren, A. Di- Nola, and J. R. Haak, The Journal of chemical physics81, 3684 (1984)
1984
-
[41]
M. J. Abraham and J. E. Gready, Journal of computational chemistry 32, 2031 (2011)
2011
-
[42]
B. Hess, H. Bekker, H. J. Berendsen, and J. G. Fraaije, Journal of computational chemistry 18, 1463 (1997)
1997
-
[43]
Atahar, N
A. Atahar, N. N. Mafy, M. M. Rahman, M. Y . A. Mollah, and M. A. B. H. Susan, Journal of Molecular Liquids 294, 111612 (2019)
2019
-
[44]
Hayashi, I
Y . Hayashi, I. Oshige, Y . Katsumoto, S. Omori, and A. Yasuda, Journal of non-crystalline solids 353, 4492 (2007)
2007
-
[45]
Murayama and M
K. Murayama and M. Tomida, Biochemistry 43, 11526 (2004)
2004
-
[46]
Abrosimova, O
K. Abrosimova, O. Shulenina, and S. Paston, in Journal of physics: conference series , V ol. 769 (IOP Publishing, 2016) p. 012016
2016
-
[47]
Y . R. Espinosa, R. J. Grigera, and C. G. Ferrara, Progress in Biophysics and Molecular Biology 140, 117 (2018)
2018
-
[600]
Taking the average number of protein–water HBs at 0 M urea as a reference, Figure 2 shows that BSA consistently maintains over 1,200 hydrogen bonds across all urea concen- trations
This plateau suggests that both urea-induced dehydration and urea solvation may reach a threshold, beyond which addi- tional urea molecules do not significantly alter the hydration state of the protein. Taking the average number of protein–water HBs at 0 M urea as a reference,...
Reviewed August 16, 2026 · model on record in the stance chip above.
Discussion (0). Continue with ORCID to comment.