REVIEW 4 major objections 6 minor 51 references
Adaptive Bayesian Very Short-Term Wind Power Forecasting Based on the Generalised Logit Transformation
T0 review · 4 major / 6 minor · reviewed 2026-08-15 · deepseek-v4-flash
Pith's one-line read The paper's central claim is that Bayes-ν, an adaptive Bayesian AR method with online updating of the generalized logit shape parameter, outperforms six benchmarks for very short-term wind power forecasting.
desk verdict The fixed-ν Bayesian method and the large-scale evaluation are solid and worth publishing, but the adaptive ν-update is under-specified and its claimed gains are small, unquantified, and uneven. read the letter →
The pith
A machine-rendered reading of the paper's core claim, the machinery that carries it, and where it could break.
The reading
What carries the argument
The generalized logit transformation $L_\nu(x)=\ln\left(x^\nu/(1-x^\nu)\right)$ maps double-bounded wind power data $x\in(0,1)$ to the real line, with the shape parameter $\nu$ controlling skewness near zero and rated power; $\nu=1$ recovers the ordinary logit. The forecasting model is an AR($p$) process in the transformed domain with a Gaussian prior on the coefficients and a Gamma prior on the error precision, giving conjugate Bayesian updates with forgetting factors. The load-bearing trick for adaptive $\nu$ is to reconstruct a small set of pseudo-observations from the posterior: after updating the precision matrix, the paper applies a Cholesky decomposition $P^* = k^2 LL^\top$, forms $y^* = L^\top \mu^*$, transforms these back to the original domain, and then chooses $\hat\nu$ by minimizing $L^*(\nu)+\tilde L(\nu)$, a sum of negative log-likelihoods from the reconstructed data and from the newly received data. The updated value is smoothed as $\nu^*_{t+M}=(1-\gamma)\nu_{t+M}+\gamma\hat\nu_{t+M}$, which lets the transformation track non-stationarity without discarding its previous state.
What would settle it
Take a wind farm where Bayes-ν wins and re-run it with the reconstruction term L*(ν) removed from the ν objective, so ν is updated only from new observations: if the full method no longer beats fixed-ν Bayes, the reconstruction is the deciding mechanism. Alternatively, simulate a double-bounded series with a known time-varying ν and check whether the updated ν̂ tracks the true ν; if it does not, the ν-update is not recovering the intended quantity.
Extended reading notes
Core claim
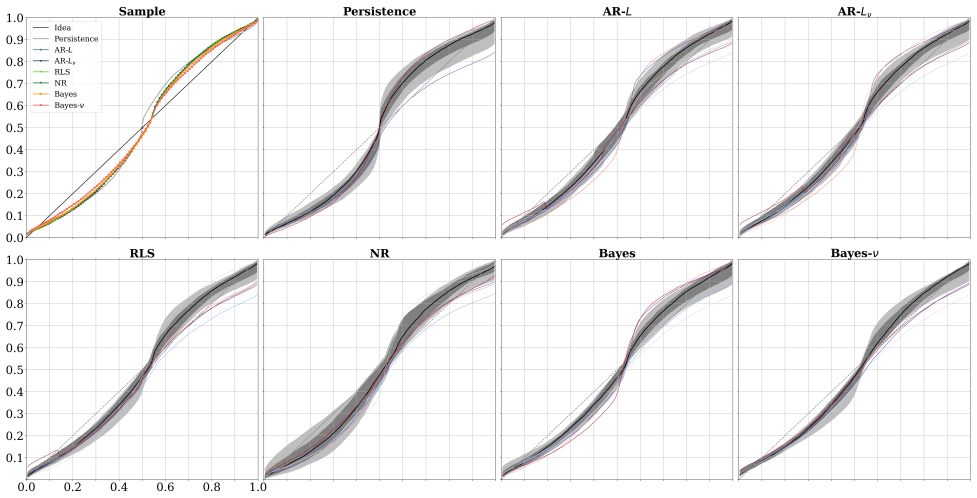
On its own terms, the paper's central discovery is that the shape parameter ν of the generalised logit transformation should be treated as a time-varying quantity and updated online, not fixed across the forecast horizon. The method alternates between conjugate Bayesian updates of the AR coefficients and error precision and a point estimate of ν that minimizes a combined negative log-likelihood of the new observations and of pseudo-observations reconstructed from the posterior precision via a Cholesky decomposition. The empirical core is Table 1: Bayes-ν has the lowest average CRPS (3.651%, 3.975%, 3.644%) and the highest skill score (3.925%, 3.504%, 4.604%) across the 2021–2023 test datasets, and it ranks first 129 times across all farm-year scenarios, whereas NR ranks first 91 times but falls to ranks 6 or 7 on 128 occasions. The authors also show, through functional reliability diagrams, that all methods tend to produce over-dispersed predictive densities, with the Bayesian methods having narrower 50% envelopes of calibration curves across farms.
Load-bearing premise
The method's extra step assumes that small artificial data samples reconstructed from the updated model summary stand in for the real wind power data when re-estimating the shape parameter; if those samples are not representative, the claimed edge over fixed-ν Bayes shrinks or disappears.
Editorial extensions
If this is right
- An operator using Bayes-ν can expect lower average CRPS and a higher skill score than persistence, AR, RLS, NR, and fixed-ν Bayes in comparable very short-term settings, based on 101 UK farms over three test years.
- The added value of adaptive ν is conditional on ν actually drifting; the paper notes that when the shape parameter is stable, most of the improvement comes from the Bayesian update itself, and the adaptive update adds less.
- Because RLS and NR occasionally collapse to near-persistence skill levels while the Bayesian methods stay consistently ranked high, Bayes-ν is the safer choice when a single bad forecast is costly.
- Functional reliability diagrams give a farm-level view of calibration, and the paper uses them to show that all methods over-disperse, with Bayesian methods showing less farm-to-farm variation in calibration bias.
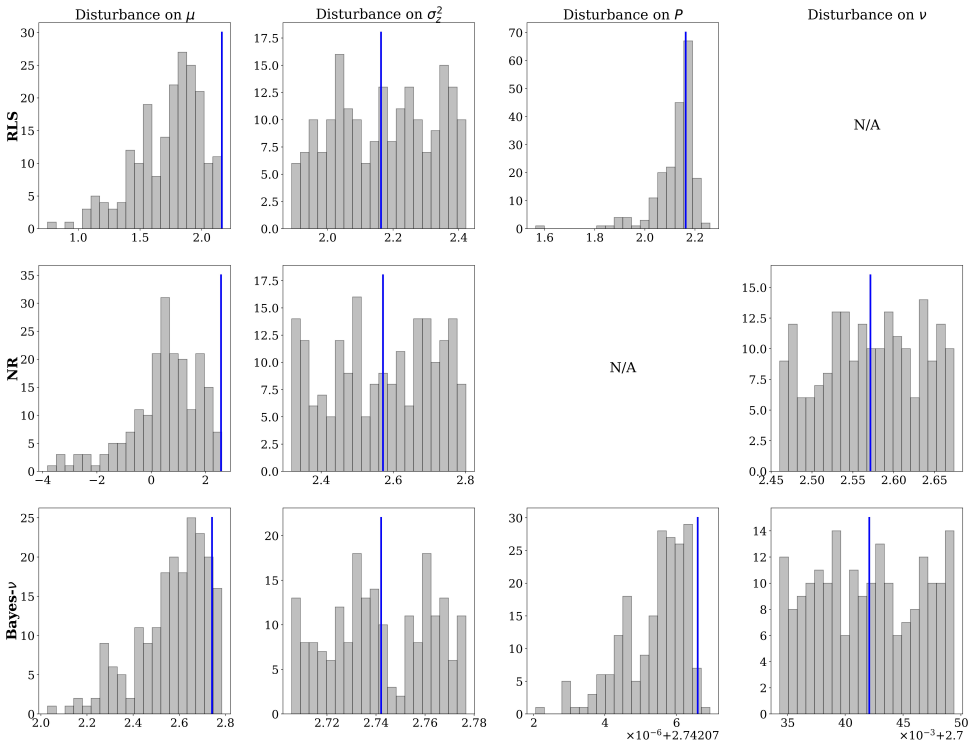
- The method's robustness under parameter disturbances comes from its stepwise interactive update, where the same precision matrix drives both parameter updates and the reconstruction that retunes ν.
Reading between the lines
- An unstated consequence is that the Cholesky-based pseudo-observation reconstruction is not wind-specific, so the same update rule could be applied to any double-bounded series with boundary inflation, such as solar power or battery state-of-charge data.
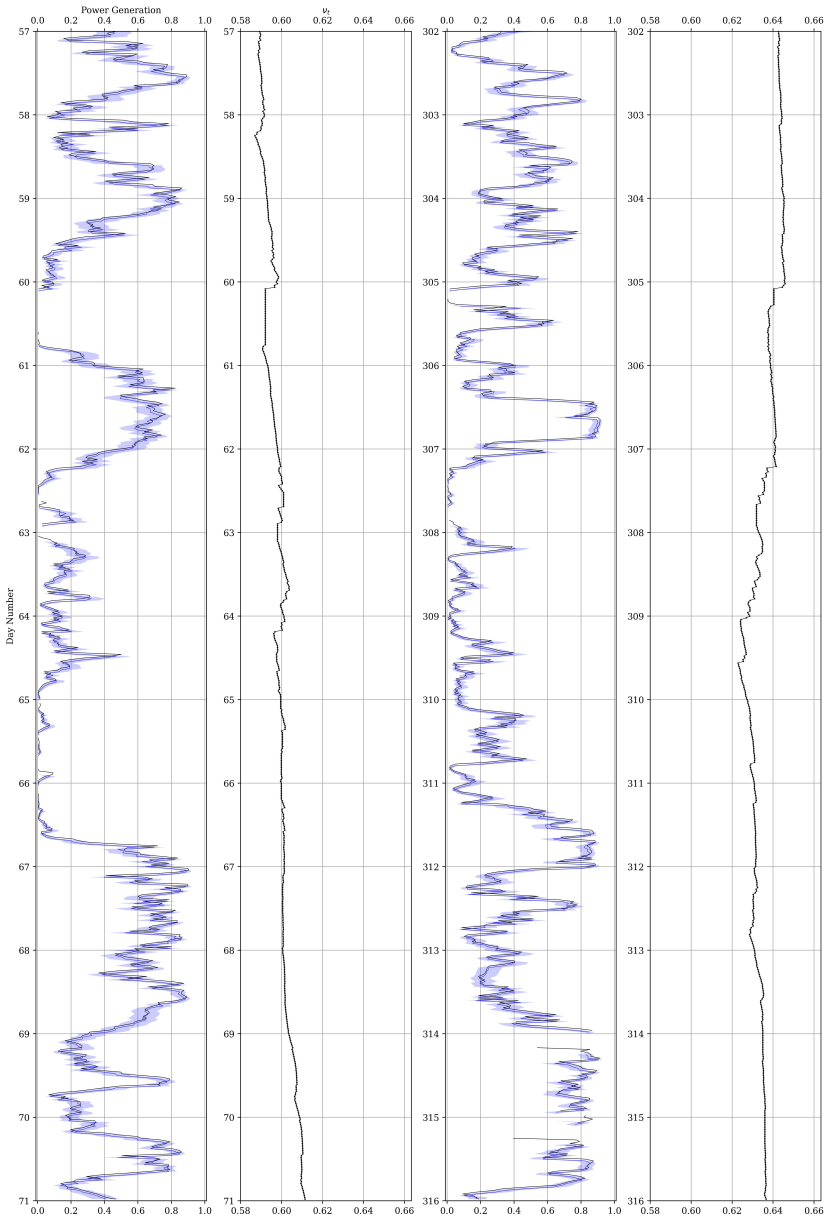
- A testable extension is to compute the rolling ν trajectory for each farm and align it with known operational events; the paper observes surges and declines in ν without tying them to causes, making the trajectory a candidate real-time anomaly signal.
- A sharper comparison would treat ν fully Bayesian rather than through the point-wise heuristic; if the reconstructed pseudo-observations are biased, that comparison should show the advantage of Bayes-ν over fixed-ν Bayes shrinking.
- A practical diagnostic suggested by the paper's own sensitivity discussion is to estimate ν on a rolling window offline and switch on the adaptive update only when the rolling estimate moves beyond a threshold, focusing the mechanism on genuinely changing regimes.
Signed reviews
Editorial analysis
A structured set of objections, weighed in public.
Referee Report
Summary. The manuscript proposes an adaptive Bayesian method for very short-term wind power forecasting. The method applies a generalised logit transformation with a shape parameter ν to convert double-bounded wind power data to an unbounded domain, fits an autoregressive model in the transformed domain, and updates the parameters online. The main novelty is an adaptive update of the transformation shape parameter ν (the Bayes-ν method), which is meant to leverage Bayesian posterior summaries to reconstruct 'representative data' and then optimise ν via a combined negative log-likelihood objective. The authors evaluate seven forecasting methods over 101 wind farms in Great Britain (with an auxiliary analysis over all 128 farms) across three test years, using CRPS, CRPS Skill Score, and functional reliability diagrams. The headline empirical claim is that Bayes-ν achieves the lowest average CRPS and the highest Skill Score in every test year, with the same ranking of methods reproduced in Appendix A on the full dataset.
Significance. If the proposed adaptive Bayesian framework is valid, it would be a practically relevant contribution to probabilistic wind power forecasting, particularly because the case study is unusually large (101–128 wind farms, three test years) and the comparison includes both classical adaptive methods (RLS, NR) and Bayesian alternatives. The manuscript has clear strengths: the data source is described, the evaluation protocol is rolling and out-of-sample, the main ranking is reproduced on an additional dataset, and the use of functional reliability diagrams to summarise calibration across many wind farms is a useful visualisation. The consistency of the average CRPS ranking across all three test years and across the full dataset is a genuine empirical finding. However, the central methodological innovation — the adaptive ν-update — is not derived from first principles and, as written, contains internal inconsistencies that prevent the method from being replicated exactly.
major comments (4)
- [Section 4.2, Eqs. (4.14)–(4.17)] The adaptive ν-update is not a well-defined statistical procedure as written. The text states that P*_{z,t+M} is 'the updated precision for the model parameter θ*', but in Section 4.1 P_z is the M×M observation-error precision matrix, whereas the posterior precision of θ is P*_θ from Eq. (4.2). The Cholesky factor L of the stated matrix is a square matrix; defining x* := L^{-1}_ν(y*) and X*_B := L^{-1}_ν(L) and then treating X*_B as an AR design matrix in Eq. (4.16) is not consistent with any AR(p) likelihood of the form in Eq. (2.10), because the entries of L are not lagged observations and the required dimensions are not specified. Even if the notation is repaired, no argument is given that minimising the negative log-likelihood of quantities constructed from posterior first moments optimises a posterior or marginal likelihood for ν. Because this update is the only component that distinguishes Bayes-ν from Bayes, the claimed superiority of Bayes-ν depends entirely on an unvalidated heuristic. The authors should either provide a rigorous derivation of the update as an approximate Bayesian procedure or clearly label it as an ad hoc rule, and then validate it through simulation or by comparison with a fixed ν tuned on a validation period.
- [Section 5.4, Table 1 and Table 2] The headline claim that 'Bayes-ν achieves the lowest average CRPS and the highest Skill Score' is supported only by point estimates of averages. The differences between Bayes-ν and Bayes are small: 0.181, 0.072 and 0.275 percentage points of Skill Score in the three test years. No standard errors, confidence intervals, or significance tests are reported, so it is unclear whether these differences are distinguishable from noise. Table 2 further shows that Bayes-ν is ranked 6 or 7 in 40 cases, compared with only 5 for Bayes, indicating that the adaptive ν-update can substantially degrade performance on some wind farms. The authors should provide uncertainty measures for the average CRPS and Skill Score differences, for example via bootstrapping or Diebold–Mariano-type tests, and discuss the practical significance of the observed average gains in light of the variability across farms.
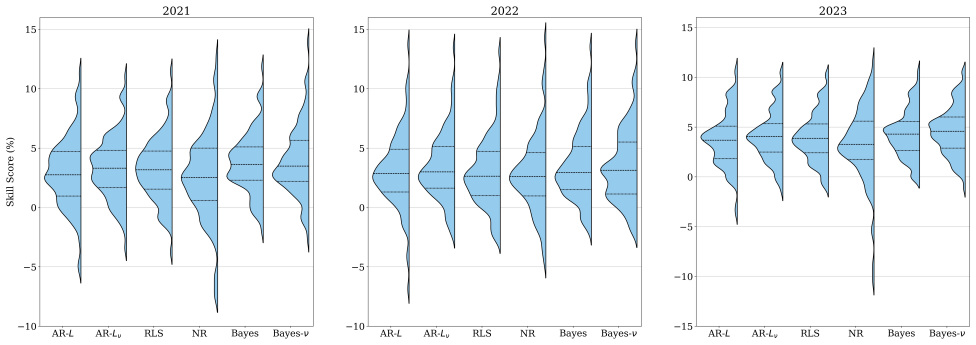
- [Section 5.4, Figure 4 and discussion] The manuscript interprets the differences between the Bayes-versus-AR-Lν and Bayes-ν-versus-Bayes Skill Score gaps as 'verifying the implication' that the benefit of adaptive ν depends on how ν varies in reality. This is not a verification but a descriptive observation about three test years. The multi-peaked Skill Score densities and the negative Skill Scores visible in Figure 4 are attributed to missing data and boundary effects, but no quantitative analysis is provided to support this attribution. The authors should either provide formal evidence for the stated cause of the negative Skill Scores or temper the claim. Similarly, the conclusion that adaptive ν estimation 'further enhances' performance should be phrased as conditional on the specific datasets and should acknowledge the inconsistency across wind farms.
- [Section 5.7, Sensitivity analysis] The sensitivity analysis is conducted on a single wind farm with an unspecified disturbance magnitude and limited details on the simulation setup (e.g., the distribution of the added noise, the number of Monte Carlo draws, and the exact definition of the disturbances to μ, σ_z and P). Since the paper uses robustness as a key selling point of the Bayesian method, this analysis should be described precisely enough to be reproduced, and the conclusions should be tempered to reflect that they are based on one farm. The claim that disturbances to P and ν have effects 'extremely small, at levels of 10^-6% and 10^-3%' needs an explanation of how such small numbers arise and whether they are practically meaningful.
minor comments (6)
- [Section 2.1, Eq. (2.5)] There is a typo in Eq. (2.5): 'ω_0 =' appears mid-sentence and the sentence is incomplete. The text defining the inflated distribution is also a little repetitive and should be rewritten.
- [References] There are duplicate entries: Gneiting (2008a) and Gneiting (2008b) are identical, and Messner and Pinson (2019a) and (2019b) are identical. These references should be merged or corrected.
- [Section 5.3, Implementation] 'Coordinate descant optimisation' should read 'coordinate descent optimisation'. Also, the outlier exclusion rule wq > σ_w^2 appears ad hoc; the authors should provide more justification for this specific threshold.
- [Section 5.4, Table 2] The note under Table 2 says 'For Rank 1 to 3, the best result is highlighted in bold', but the caption is ambiguous about the meaning of bold across different columns. Clarify how the bold entries should be read.
- [Section 5.4, discussion] The sentence 'The differences in average Skill Scores across the three test datasets between Bayes and AR-Lν (respectively 0.41%, 0.01%, 0.23%) are both greater and smaller then that between Bayes-ν and Bayes' contains a typo ('then' should be 'than') and is confusing because the percentages are not clearly aligned with the test years.
- [Section 4.1, Eqs. (4.2)–(4.11)] The notation P_z,t is used both for an M×M diagonal matrix of observation-error precisions and, later, for a scalar Gamma-distributed precision parameter. This dual use makes Section 4.2 harder to follow and should be cleaned up with distinct symbols for the matrix and the scalar.
Circularity Check
No significant circularity: the Bayes-ν forecast comparison is evaluated on held-out test years, and the Section 4.2 ν-update, while self-referential and heuristic, does not force the reported skill scores.
full rationale
The paper's central empirical claim is that Bayes-ν achieves the lowest average CRPS and highest Skill Score across three test datasets. This claim is tested on data from years following the initial training year (2020-2021, 2021-2022, 2022-2023), against external benchmarks including persistence, AR, RLS, NR, and fixed-ν Bayes. The evaluation therefore does not reduce to the fitted values or to the model's own construction; it is a genuine out-of-sample comparison. The only potentially self-referential component is the ν-update in Section 4.2, where pseudo-observations are reconstructed from the posterior mean and a Cholesky factor of a precision matrix, and the likelihood of those pseudo-data is used in the objective for ν. By construction, the least-squares fit of the pseudo-data reproduces the posterior mean, so this part of the objective is an internal consistency device rather than an independent prediction. This is a heuristic parameter-update mechanism, not a fitted quantity that is then renamed as a forecast result. The claimed improvements are measured on holdout data and are not forced by this mechanism. Self-citations in the paper, such as Castro-Camilo et al. (2019) and Tawn and Browell (2022), are background or benchmark references and are not load-bearing uniqueness theorems or ansatz justifications. The under-specification of equations (4.14)-(4.16) is a legitimate correctness and robustness concern, but it is not circular reasoning. Overall, the derivation and empirical evaluation are self-contained against external data, so no significant circularity is found.
Assumptions & free parameters
free parameters (8)
- Shape parameter ν =
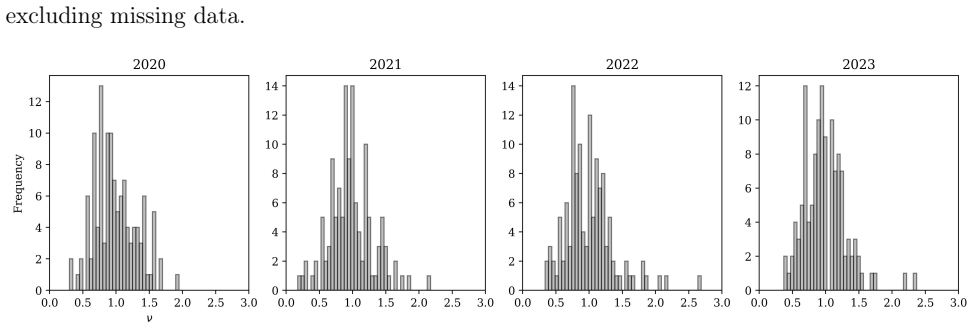
estimated per method (AR-Lν, NR, Bayes-ν); Figure 3 shows a histogram across farms
- Forgetting factor λ (RLS and NR) =
0.9999
- Bayesian decay factors λ_θ and λ_z =
0.995
- Learning rate γ for ν update =
0.05
- Prior hyperparameters α, β, Pθ =
α=101, β=1, Pθ=0.0001·I
- Threshold ε =
0.005
- Cholesky regularization k =
not specified
- Wind farm exclusion rule wq > σ_w^2 =
27 of 128 farms removed
assumptions (5)
- domain assumption Transformed AR(p) model with i.i.d. inflated normal errors (Eq. 2.10)
- standard math Normal-Gamma conjugacy with independent priors
- ad hoc to paper Cholesky-derived pseudo-observations are representative data
- domain assumption Missing data and BAV/OAV corrections leave the sample representative
- domain assumption Parameter drift is smooth enough for constant forgetting factors
invented entities (1)
-
Reconstructed representative data (x*, X*_B)
Cite this review
Pith. "Pith review of Adaptive Bayesian Very Short-Term Wind Power Forecasting Based on the Generalised Logit Transformation." pith.science (2026). https://pith.science/paper/G2C3J3RH
@misc{pith2026250506310,
  author       = {Pith},
  title        = {Pith review of: Adaptive Bayesian Very Short-Term Wind Power Forecasting Based on the Generalised Logit Transformation},
  year         = {2026},
  howpublished = {\url{https://pith.science/paper/G2C3J3RH}},
  note         = {Machine review of arXiv:2505.06310}
}
read the original abstract
Wind power plays an increasingly significant role in achieving the 2050 Net Zero Strategy. Despite its rapid growth, its inherent variability presents challenges in forecasting. Accurately forecasting wind power generation is one key demand for the stable and controllable integration of renewable energy into existing grid operations. This paper proposes an adaptive method for very short-term forecasting that combines the generalised logit transformation with a Bayesian approach. The generalised logit transformation processes double-bounded wind power data to an unbounded domain, facilitating the application of Bayesian methods. A novel adaptive mechanism for updating the transformation shape parameter is introduced to leverage Bayesian updates by recovering a small sample of representative data. Four adaptive forecasting methods are investigated, evaluating their advantages and limitations through an extensive case study of over 100 wind farms ranging four years in the UK. The methods are evaluated using the Continuous Ranked Probability Score and we propose the use of functional reliability diagrams to assess calibration. Results indicate that the proposed Bayesian method with adaptive shape parameter updating outperforms benchmarks, yielding consistent improvements in CRPS and forecast reliability. The method effectively addresses uncertainty, ensuring robust and accurate probabilistic forecasting which is essential for grid integration and decision-making.
Figures

Figures from the paper (4 more)
Reference graph
Works this paper leans on
-
[1]
, " * write output.state after.block = add.period write newline
ENTRY address author booktitle chapter edition editor howpublished institution isbn journal key month note number organization pages publisher school series title type volume year label extra.label sort.label short.list INTEGERS output.state before.all mid.sentence after.sentence after.block FUNCTION init.state.consts #0 'before.all := #1 'mid.sentence :=...
-
[2]
write newline
" write newline "" before.all 'output.state := FUNCTION n.dashify 't := "" t empty not t #1 #1 substring "-" = t #1 #2 substring "--" = not "--" * t #2 global.max substring 't := t #1 #1 substring "-" = "-" * t #2 global.max substring 't := while if t #1 #1 substring * t #2 global.max substring 't := if while FUNCTION word.in bbl.in capitalize " " * FUNCT...
-
[3]
Ait Maatallah, O., Achuthan, A., Janoyan, K. and Marzocca, P. (2015) Recursive wind speed forecasting based on hammerstein auto-regressive model. Applied Energy 145, 191--197
work page 2015
-
[4]
Aitchison, J. and Shen, S. M. (1980) Logistic-normal distributions: Some properties and uses. Biometrika 67, 261--272
work page 1980
-
[5]
Blaga, R., Sabadus, A. et al. (2019) A current perspective on the accuracy of incoming solar energy forecasting. Progress in Energy and Combustion Science 70, 119--144
work page 2019
-
[6]
(2011) Very short-term wind power forecasting with neural networks and adaptive bayesian learning
Blonbou, R. (2011) Very short-term wind power forecasting with neural networks and adaptive bayesian learning. Renewable Energy 36(3), 1118--1124
work page 2011
-
[7]
Box, G. E. P. and Cox, D. R. (1964) An analysis of transformations. Journal of the Royal Statistical Society. Series B (Methodological) 26(2), 211--252
work page 1964
-
[8]
Box, G. E. P., Jenkins, G. M., Reinsel, G. C. and Ljung, G. M. (2016) Time Series Analysis: Forecasting and Control. Fifth edition. New Jersey: Wiley
work page 2016
Show all 51 references
-
[9]
and De Falco, P
Bracale, A. and De Falco, P. (2015) An advanced bayesian method for short-term probabilistic forecasting of the generation of wind power. Energies 8(9), 10293--10314
2015
-
[10]
Brier, G. W. (1950) Verification of forecasts expressed in terms of probability. Monthly Weather Review 78(1), 1--3
1950
-
[11]
and Isaksen, L
Buizza, R., Leutbecher, M. and Isaksen, L. (2008) Potential use of an ensemble of analyses in the ecmwf ensemble prediction system. Quarterly Journal of the Royal Meteorological Society 134(637), 2051--2066
2008
-
[12]
Casey, S. P. F. and Cucurull, L. (2022) The impact of data latency on operational global weather forecasting. Weather and Forecasting 37(7), 1211 -- 1220
2022
-
[13]
and Rue, H
Castro-Camilo, D., Huser, R. and Rue, H. (2019) A spliced gamma-generalized pareto model for short-term extreme wind speed probabilistic forecasting. Journal of Agricultural, Biological, and Environmental Statistics 24, 517--534
2019
-
[14]
J., Reis, M
Cavalcante, L., Bessa, R. J., Reis, M. and Browell, J. (2017) Lasso vector autoregression structures for very short-term wind power forecasting. Wind Energy 20(4), 657--675
2017
-
[15]
and Pinson, P
Dowell, J. and Pinson, P. (2015) Very-short-term probabilistic wind power forecasts by sparse vector autoregression. IEEE Trans. Smart Grid pp. 1--1
2015
-
[16]
https://ember-energy.org/latest-insights/global-electricity-review-2024/
Ember (2024) Global electricity review 2024. https://ember-energy.org/latest-insights/global-electricity-review-2024/
2024
-
[17]
and Soares, C
Garbatov, Y. and Soares, C. G. (2002) Bayesian updating in the reliability assessment of maintained floating structures. J. Offshore Mech. Arct. Eng. 124(3), 139--145
2002
-
[18]
and Bravo, L
García, I., Huo, S., Prado, R. and Bravo, L. (2020) Dynamic bayesian temporal modeling and forecasting of short-term wind measurements. Renewable Energy 161, 55--64
2020
-
[19]
(2008 a ) Editorial: Probabilistic forecasting
Gneiting, T. (2008 a ) Editorial: Probabilistic forecasting. Journal of the Royal Statistical Society. Series A (Statistics in Society) 171(2), 319--321
2008
-
[20]
(2008 b ) Editorial: Probabilistic forecasting
Gneiting, T. (2008 b ) Editorial: Probabilistic forecasting. Journal of the Royal Statistical Society. Series A (Statistics in Society) 171(2), 319--321
2008
-
[21]
and Raftery, A
Gneiting, T., Balabdaoui, F. and Raftery, A. E. (2007) Probabilistic forecasts, calibration and sharpness. Journal of the Royal Statistical Society: Series B (Statistical Methodology) 69(2), 243--268
2007
-
[22]
and Katzfuss, M
Gneiting, T. and Katzfuss, M. (2014) Probabilistic forecasting. Annual Review of Statistics and Its Application 1(1), 125--151
2014
-
[23]
and Raftery, A
Gneiting, T. and Raftery, A. E. (2007) Strictly proper scoring rules, prediction, and estimation. Journal of the American Statistical Association 102(477), 359--378
2007
-
[24]
and Resin, J
Gneiting, T. and Resin, J. (2023) Regression diagnostics meets forecast evaluation: conditional calibration, reliability diagrams, and coefficient of determination. Electronic Journal of Statistics 17(2), 3226 -- 3286
2023
-
[25]
Grewal, M. S. and Andrews, A. P. (2014) Kalman Filtering: Theory and Practice Using MATLAB. Fourth edition. Hoboken, NJ: John Wiley and Sons. ISBN 978-1-118-85121-0
2014
-
[26]
and Lotfian, S
Hanifi, S., Liu, X., Lin, Z. and Lotfian, S. (2020) A critical review of wind power forecasting methods---past, present and future. Energies 13(15), 3764
2020
-
[27]
Harper, M. et al. (2015) python-ternary: Ternary plots in python. Zenodo 10.5281/zenodo.594435
2015 doi
-
[28]
J., Koehler, A
Hyndman, R. J., Koehler, A. B., Ord, J. K. and Snyder, R. D. (2008) Forecasting with Exponential Smoothing: The State Space Approach. Berlin, Heidelberg: Springer. ISBN 978-3-540-71918-2
2008
-
[29]
Hyndman, R. J. and Shang, H. L. (2010) Rainbow plots, bagplots, and boxplots for functional data. Journal of Computational and Graphical Statistics 19(1), 29--45
2010
-
[30]
and Tsonaka, R
Lesaffre, E., Rizopoulos, D. and Tsonaka, R. (2007) The logistic transform for bounded outcome scores. Biostatistics 8(1), 72--85
2007
-
[31]
Max, A. W. (1950) Inverting modified matrices. In Memorandum Rept. 42, Statistical Research Group, p. 4. Princeton Univ
1950
-
[32]
Messner, J. W. and Pinson, P. (2019 a ) Online adaptive lasso estimation in vector autoregressive models for high dimensional wind power forecasting. International Journal of Forecasting 35(4), 1485--1498
2019
-
[33]
Messner, J. W. and Pinson, P. (2019 b ) Online adaptive lasso estimation in vector autoregressive models for high dimensional wind power forecasting. International Journal of Forecasting 35(4), 1485--1498
2019
-
[34]
Petropoulos, F. et al. (2022) Forecasting: theory and practice. International Journal of Forecasting 38(3), 705--871
2022
-
[35]
and Pinson, P
Pierrot, A. and Pinson, P. (2021) Adaptive generalized logit-normal distributions for wind power short-term forecasting. In 2021 IEEE Madrid PowerTech, pp. 1--6
2021
-
[36]
(2012) Very-short-term probabilistic forecasting of wind power with generalized logit--normal distributions
Pinson, P. (2012) Very-short-term probabilistic forecasting of wind power with generalized logit--normal distributions. Journal of the Royal Statistical Society Series C: Applied Statistics 61(4), 555--576
2012
-
[37]
and Madsen, H
Pinson, P. and Madsen, H. (2012) Adaptive modelling and forecasting of offshore wind power fluctuations with markov-switching autoregressive models. Journal of Forecasting 31(4), 281--313
2012
-
[38]
Rao, C. R. (1973) Linear Statistical Inference and its Applications. Wiley
1973
-
[39]
and Roser, M
Ritchie, H. and Roser, M. (2023) Cumulative installed wind energy capacity (gigawatts). https://ourworldindata.org/grapher/cumulative-installed-wind-energy-capacity-gigawatts?country= OWID_WRL. Accessed: 2025-01-09
2023
-
[40]
and Harou, A
Schmid, F., Wang, Y. and Harou, A. (2019) Nowcasting guidelines – a summary. https://wmo.int/media/magazine-article/nowcasting-guidelines-summary. Accessed: 2025-01-10
2019
-
[41]
Shumway, R. H. and Stoffer, D. S. (2017) Time Series Analysis and Its Applications: With R Examples. Fourth edition. New York: Springer. ISBN 978-3-319-52451-8
2017
-
[42]
Smith, T. G. et al. (2017--) pmdarima : Arima estimators for Python
2017
-
[43]
and Genton, M
Sun, Y. and Genton, M. G. (2011) Functional boxplots. Journal of Computational and Graphical Statistics 20(2), 316--334
2011
-
[44]
and Ljung, L
Söderström, T. and Ljung, L. (1987) Theory and Practice of Recursive Identification. MIT Press
1987
-
[45]
and Liu, Z
Tang, J., Hu, J., Heng, J. and Liu, Z. (2022) A novel bayesian ensembling model for wind power forecasting. Heliyon 8(11), e11599
2022
-
[46]
and Browell, J
Tawn, R. and Browell, J. (2022) A review of very short-term wind and solar power forecasting. Renewable and Sustainable Energy Reviews 153, 111758
2022
-
[47]
Torres, J., García, A. et al. (2005) Forecast of hourly average wind speed with arma models in navarre (spain). Solar Energy 79(1), 65--77
2005
-
[48]
https://unfccc.int/sites/default/files/resource/Summary_GCA_COP28.pdf
United Nations Framework Convention on Climate Change (UNFCCC) (2023) Summary of the global stocktake technical dialogue at cop28. https://unfccc.int/sites/default/files/resource/Summary_GCA_COP28.pdf. Accessed: 2025-01-09
2023
-
[49]
(2019) Interpreting the skill score form of forecast performance metrics
Wheatcroft, E. (2019) Interpreting the skill score form of forecast performance metrics. International Journal of Forecasting 35(2), 573--579
2019
-
[50]
Yoon, T., Park, Y., Ryu, E. K. and Wang, Y. (2022) Robust probabilistic time series forecasting. In Proceedings of The 25th International Conference on Artificial Intelligence and Statistics, eds G. Camps-Valls, F. J. R. Ruiz and I. Valera, volume 151 of Proceedings of Machine...
2022
-
[51]
and Wang, X
Zhang, Y., Wang, J. and Wang, X. (2014) Review on probabilistic forecasting of wind power generation. Renewable and Sustainable Energy Reviews 32, 255--270
2014
Reviewed August 15, 2026 · model on record in the stance chip above.
Discussion (0). Continue with ORCID to comment.