REVIEW 3 major objections 5 minor 41 references
Articulatory strategy in vowel production as a basis for speaker discrimination
T0 review · 3 major / 5 minor · reviewed 2026-08-07 · deepseek-v4-flash
Pith's one-line read Tongue shape in vowel production carries speaker-specific information, with tongue size as the strongest single cue and anterior tongue shape outperforming posterior shape under likelihood-ratio testing.
desk verdict First LR test of ultrasound tongue shape features, with an interesting anterior-over-posterior pattern, but PCA and calibration leak into the evaluation, so the Cllr numbers are not yet trustworthy. read the letter →
The pith
A machine-rendered reading of the paper's core claim, the machinery that carries it, and where it could break.
The reading
What carries the argument
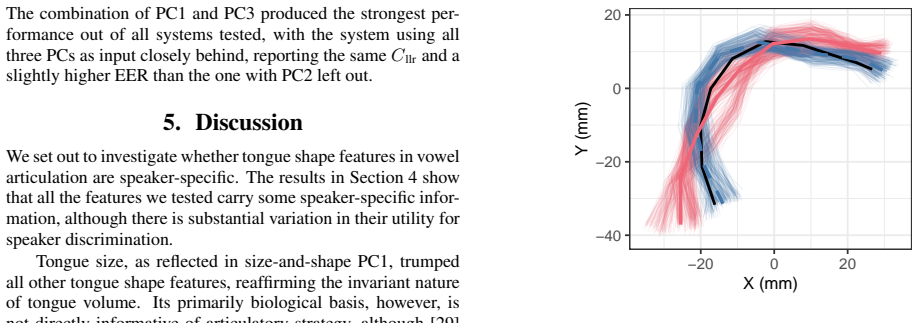
The argument is carried by a pipeline: Generalised Procrustes Analysis (GPA) normalises tongue contours by translation and rotation, with a scaled variant that removes size, and principal component analysis in tangent space turns the contours into orthogonal dimensions. The first three PCs capture $90.6\%$ of variance in size-and-shape data and $88.3\%$ in shape data. Speaker discrimination is then scored with likelihood ratios: first-half data from one speaker are compared with second-half data from all 40 speakers using a multivariate kernel density formula, raw scores are calibrated to $\log_{10}$ likelihood ratios, and performance is summarised by equal error rate (EER) and log-likelihood-ratio cost $C_{\mathrm{llr}}$, with $C_{\mathrm{llr}}<1$ marking a system that carries useful speaker-specific information.
What would settle it
Record the same speakers again on separate days with the same protocol and test whether one day's tongue shapes can be matched to another day; if the equal error rate jumps far above the reported 5.6% for the best system, the speaker-specific signal is mostly session-specific rather than speaker-specific.
Extended reading notes
Core claim
On the paper's own terms, the discovery is that tongue shape features derived from vowel articulation contain speaker-specific information that is usable for speaker discrimination. In the size-and-shape analysis, PC1—essentially tongue size—gives EER $10.0\%$ and $C_{\mathrm{llr}}=0.387$ on its own, and PC1 combined with PC3 (dorsum concavity) gives EER $5.6\%$ and $C_{\mathrm{llr}}=0.213$, the best system tested. In the shape-only analysis, no single PC reaches EER below about $18\%$, but combining shape PC1 and PC3 gives EER $7.5\%$ and $C_{\mathrm{llr}}=0.308$, close to the size-and-shape systems. All systems produced $C_{\mathrm{llr}}<1$, so each feature combination captured at least some speaker-specific information. The authors conclude that both anatomy (tongue size) and articulatory strategy (tongue shape) contribute to speaker discrimination, with anterior tongue shape more individual than posterior tongue shape.
Load-bearing premise
The claim assumes that comparing the first half of a speaker's recording with the second half gives a realistic estimate of how much that speaker's tongue shapes vary; if day-to-day variation is much larger than within-session variation, the reported discrimination rates are optimistic.
Editorial extensions
If this is right
- Tongue size, captured by size-and-shape PC1, is the single most informative articulatory feature for speaker discrimination among those tested.
- For pure tongue shape, anterior tongue features (shape PC2 and PC3) carry more speaker-specific information than posterior tongue features (shape PC1).
- Combining complementary tongue-shape features improves discrimination, but adding a feature that co-varies with already-included features at the speaker level adds no further benefit.
- Articulatory tongue-shape systems perform at a level comparable to acoustic long-term formant distributions in this controlled comparison.
- If these results hold, speaker discrimination can be based on articulatory strategy alone, without relying on acoustic cues such as fundamental frequency or formants.
Reading between the lines
- If the result generalizes to new recording sessions, the practical value for forensic comparison would be bounded by the difference between within-session and between-session variability, which this paper does not measure.
- A testable extension would be to combine palate-shape measurements with tongue contours: the anterior-posterior asymmetry reported here predicts that speakers with flatter palates show more internally consistent anterior tongue targets.
- The speaker-level co-variation among PCs suggests that individual articulatory style may cluster into a small number of settings, such as retracted tongue root with arched dorsum, which could be used to build speaker profiles.
- A natural next step is fusing articulatory and acoustic evidence in a single likelihood-ratio system; if tongue shape adds information beyond formants, the fused system should outperform either modality alone.
Editorial analysis
A structured set of objections, weighed in public.
Referee Report
Summary. The paper investigates whether tongue shape features extracted from ultrasound tongue imaging can discriminate between speakers in a forensic likelihood-ratio framework. Using data from 40 speakers of Northern English producing vowels, the authors apply Generalised Procrustes Analysis to obtain size-and-shape and shape-only representations, then take the first three PCs as features. They test each PC and combinations as speaker discriminants using a kernel-density likelihood-ratio system with a same-session split-half protocol, reporting EER and Cllr for each system. The central claim is that all tested systems yield Cllr below 1, and that tongue size (size-and-shape PC1) is the strongest individual feature, while shape-only combinations approach the performance of size-and-shape combinations when features do not show speaker-level co-variation.
Significance. If the results are valid, this is the first LR-based demonstration that articulatory tongue-shape features contain speaker-specific information, offering a novel link between articulatory phonetics and forensic speaker comparison. The study is well motivated, uses appropriate shape-analysis methods, and provides a clear qualitative account of which tongue regions are most discriminative. The use of a standard forensic LR framework is a strength, as is the availability of the fvclrr package for reproducibility. However, the evaluation protocol has potential leakage and calibration issues that affect the internal validity of the reported Cllr values, so the central claim is not yet established at the level claimed.
major comments (3)
- [Section 2.2 and Section 3] The GPA and PCA are applied to the entire dataset of tongue contours, including all speakers, before the train/test partition used for LR testing. Because the PC axes are estimated from the full dataset, they encode between-speaker variability from the same speakers later used in evaluation. This is a transductive form of feature leakage that can inflate speaker-separation estimates. The central claim that all systems yield Cllr below 1 is therefore not established out-of-sample. Please re-run the analysis with nested cross-validation (e.g., estimate GPA/PCA on a development subset or on leave-one-speaker-out folds) and report whether the Cllr values remain below 1.
- [Section 3, calibration] The text states that the 1,600 scores were 'calibrated by logistic regression' to produce log10 LRs, but it does not describe a separate calibration set or a cross-validation scheme for this calibration step. If the logistic-regression parameters are fitted and evaluated on the same scores, the reported Cllr estimates are optimistically biased, and the threshold of Cllr<1 that underpins the paper's interpretation may be crossed by overfit calibration. Please clarify the calibration protocol; if no out-of-sample calibration is performed, implement K-fold cross-validation for the calibration mapping and report the resulting Cllr.
- [Section 4, Table 1] The paper reports EER and Cllr values without uncertainty estimates. With only 40 same-speaker comparisons per system (first half vs second half for each of 40 speakers), EER is based on a very small number of target trials; a single misclassification changes EER by 2.5 percentage points. Thus, comparative claims about which PCs outperform others (e.g., 'PC3 slightly outperformed PC2' or that adding PC2 does not improve on PC1+3) are not supported without confidence intervals or statistical tests. Please report confidence intervals (e.g., bootstrap) for EER and Cllr, and consider adding a within-corpus baseline (e.g., acoustic formant features from the same recordings) to contextualize the absolute values.
minor comments (5)
- [Section 2.1] Please provide the distribution of trials per speaker after outlier removal, since PCA and LR results may depend on the number of trials per speaker.
- [Section 2.2] The choice of the first three PCs is motivated by variance explained; please clarify whether this number was pre-registered or exploratory, and how sensitive the results are to retaining only three PCs.
- [Section 3] The description of the cross-validation procedure is brief; please specify exactly which steps are cross-validated (e.g., typicality assessment, kernel density estimation, calibration) and whether the same folds are used for all systems.
- [Section 4 and Figure 3] In Figure 3, the two system types are plotted on different scales; please use a consistent scale or add explicit axis labels to facilitate comparison.
- [Section 5] The correlation between speaker means of size-and-shape PC2 and PC3 is described as 'weak-to-moderate' (r=-0.356); please provide an effect-size interpretation or a reference for this terminology.
Circularity Check
No significant circularity: central derivation is unsupervised and cross-validated; minor self-citations are not load-bearing.
full rationale
The paper's derivation chain is not circular. Tongue shape features are obtained by GPA/PCA applied to landmark coordinates without reference to speaker identity; the PCA is a data-driven rotation and the paper does not define the features in terms of the speaker-discrimination outcome. The LR testing uses pairwise first-half/second-half comparisons and excludes the compared speakers in typicality estimation, so the Cllr/EER values are empirical performance metrics rather than fitted parameters renamed as predictions. The authors' own fvclrr package [25] is a computational tool, not an argument; the other self-citations ([24], [30], [31]) support background predictions or explanatory side-claims and are not the source of the central result. The acknowledged same-session split ('we acknowledge that this likely underestimates the extent of within-speaker variability') is an external-validity limitation, not a circular step. Potential concerns about PCA fitted on the full dataset before splitting, and the lack of an explicit independent calibration partition in the text, are statistical leakage issues that could affect the optimism of the reported numbers, but they do not make the core claim equivalent to its inputs by construction. No self-citation chain or imported uniqueness theorem forces the conclusion.
Assumptions & free parameters
free parameters (4)
- Outlier exclusion threshold =
3.5 median absolute deviations
- Number of PCs retained =
first three PCs in each analysis
- Split-half partition =
first half vs second half of each speaker's data
- Procrustes scaling condition =
partial GPA (no scaling) and full GPA (scaling)
assumptions (5)
- standard math Generalised Procrustes Analysis removes translation and rotation from tongue contours
- domain assumption DeepLabCut landmark tracking accurately labels the tongue contour
- standard math The multivariate kernel density likelihood ratio formula is appropriate for comparing speaker feature distributions
- domain assumption Tongue shape at the acoustic midpoint of the vowel is representative of articulatory strategy
- domain assumption Size-and-shape PC1 corresponds to tongue size
Cite this review
Pith. "Pith review of Articulatory strategy in vowel production as a basis for speaker discrimination." pith.science (2026). https://pith.science/paper/YUY3OFFQ
@misc{pith2026250520995,
  author       = {Pith},
  title        = {Pith review of: Articulatory strategy in vowel production as a basis for speaker discrimination},
  year         = {2026},
  howpublished = {\url{https://pith.science/paper/YUY3OFFQ}},
  note         = {Machine review of arXiv:2505.20995}
}
read the original abstract
The way speakers articulate is well known to be variable across individuals while at the same time subject to anatomical and biomechanical constraints. In this study, we ask whether articulatory strategy in vowel production can be sufficiently speaker-specific to form the basis for speaker discrimination. We conducted Generalised Procrustes Analyses of tongue shape data from 40 English speakers from the North West of England, and assessed the speaker-discriminatory potential of orthogonal tongue shape features within the framework of likelihood ratios. Tongue size emerged as the individual dimension with the strongest discriminatory power, while tongue shape variation in the more anterior part of the tongue generally outperformed tongue shape variation in the posterior part. When considered in combination, shape-only information may offer comparable levels of speaker specificity to size-and-shape information, but only when features do not exhibit speaker-level co-variation.
Figures


Figures from the paper (1 more)
Reference graph
Works this paper leans on
-
[1]
Such vari- ation arises as a result of an interplay between speaker anatomy and speaker choice
Introduction Articulatory strategy is characterised by individual variation, such that different speakers may perform different articulatory movements to achieve similar acoustic outputs [1, 2]. Such vari- ation arises as a result of an interplay between speaker anatomy and speaker choice. Differences in the exact shape of every in- dividual’s vocal tract...
-
[2]
Do tongue shape features used in vowel production contain speaker-specific information?
-
[3]
Which tongue shape features are the most informative for speaker discrimination and can therefore be considered in- dividual? We apply the framework of likelihood ratios (LRs) to assess speaker specificity. A modern standard in forensic voice com- parison, LRs are used to evaluate the strength of voice evidence under competing same- and different-speaker ...
-
[4]
Articulatory strategy in vowel production as a basis for speaker discrimination
Tongue size & shape features 2.1. Ultrasound tongue imaging data Our study includes data from 40 speakers of English from the North West of England (Greater Manchester and Lancashire). arXiv:2505.20995v1 [cs.CL] 27 May 2025 Midsagittal ultrasound tongue imaging data were collected from these speakers while they produced a full set of stressed vowel phonem...
work page Pith review arXiv 2025
-
[5]
Likelihood ratio-based testing To assess speaker individuality of tongue size and shape in vowel articulation, we tested how well the PCs derived in Sec- tion 2.2 performed as speaker discriminants using LRs. We tested two sets of systems using PCs from the size-and-shape analysis and the shape analysis as input features respectively. Within each set, we ...
-
[6]
Results System performance, as evaluated by EER andC llr, is reported in Table 1 and illustrated in Figure 3. All systems tested pro- ducedC llr below1, meaning that each combination of PCs was able to capture some speaker-specific information. Table 1:EER andC llr from all systems tested Size-and-shape Shape EER (%)C llr EER (%)C llr PC1 10.0 0.387 23.0 ...
-
[7]
Discussion We set out to investigate whether tongue shape features in vowel articulation are speaker-specific. The results in Section 4 show that all the features we tested carry some speaker-specific infor- mation, although there is substantial variation in their utility for speaker discrimination. Tongue size, as reflected in size-and-shape PC1, trumped...
-
[8]
Conclusion This study marks the first application of LR-based testing to ex- plore speaker-specific information in articulatory features. We found evidence that both anatomical features (tongue size) and articulatory strategy in vowel production (variation in tongue shape) contribute to speaker discrimination. These features, in- dividually or in combinat...
Show all 41 references
-
[9]
Acknowledgements This research was supported by an AHRC research grant awarded to PS and SK (AH/S011900/1), a British Academy Mid-Career Fellowship awarded to PS (MFSS24\240076), and an AHRC Fellowship awarded to SK (AH/Y002822/1)
-
[10]
Individual differences in vowel production,
K. Johnson, P. Ladefoged, and M. Lindau, “Individual differences in vowel production,”J. Acoust. Soc. Am., vol. 94, pp. 701–714, 1993
1993
-
[11]
Individual-level con- tact limits phonological complexity: Evidence from bunched and retroflex /ô/,
J. Mielke, A. Baker, and D. Archangeli, “Individual-level con- tact limits phonological complexity: Evidence from bunched and retroflex /ô/,”Language, pp. 101–140, 2016
2016
-
[12]
Nolan,The Phonetic Bases of Speaker Identification
F. Nolan,The Phonetic Bases of Speaker Identification. Cam- bridge: Cambridge University Press, 1983
1983
-
[13]
On the relationship between palate shape and articulatory behavior,
J. Brunner, S. Fuchs, and P. Perrier, “On the relationship between palate shape and articulatory behavior,”J. Acoust. Soc. Am., vol. 125, no. 6, pp. 3936–3949, 2009
2009
-
[14]
The effect of anatomic factors on tongue position variability during consonants,
K. Rudy and Y . Yunusova, “The effect of anatomic factors on tongue position variability during consonants,”J. Speech Lang. Hearing Res., vol. 56, no. 1, pp. 137–149, 2013
2013
-
[15]
Palatal morphology can influence speaker-specific realizations of phonemic contrasts,
M. Weirich and S. Fuchs, “Palatal morphology can influence speaker-specific realizations of phonemic contrasts,”J. Speech Lang. Hearing Res., vol. 56, no. 6, pp. 1894–1908, 2013
1908
-
[16]
The influence of Nature and Nurture on speaker-specific parameters in twins speech,
M. Weirich, “The influence of Nature and Nurture on speaker-specific parameters in twins speech,” Ph.D. dissertation, Humboldt-Universit¨at zu Berlin, 2012
2012
-
[17]
Laver,Voice Quality
J. Laver,Voice Quality. John Benjamins, 1979
1979
-
[18]
Factor analysis of tongue shapes,
R. Harshman, P. Ladefoged, and L. Goldstein, “Factor analysis of tongue shapes,”J. Acoust. Soc. Am., vol. 62, pp. 693–707, 1977
1977
-
[19]
Principal component analysis of cross sections of tongue shapes in vowel production,
M. Stone, M. H. Goldstein Jr, and Y . Zhang, “Principal component analysis of cross sections of tongue shapes in vowel production,” Speech Commun., vol. 22, pp. 173–184, 1997
1997
-
[20]
Parameterization of vocal tract area functions by empirical orthogonal modes,
B. H. Story and I. R. Titze, “Parameterization of vocal tract area functions by empirical orthogonal modes,”J. Phon., vol. 26, no. 3, pp. 223–260, 1998
1998
-
[21]
Regional variation in British English voice quality,
E. Gold, C. Kirchh ¨ubel, K. Earnshaw, and S. Ross, “Regional variation in British English voice quality,”English World-Wide, vol. 43, no. 1, pp. 96–123, 2022
2022
-
[22]
The nature of phonological variables in Scouse,
G. O. Knowles, “The nature of phonological variables in Scouse,” inSociolinguistic Patterns in British English. London: Arnold, 1978, pp. 80–90
1978
-
[23]
Reviewing the per- formance of formants for forensic voice comparison: A meta- analysis of forensic speech science research,
L. Fairclough, G. Brown, and C. Kirchh ¨ubel, “Reviewing the per- formance of formants for forensic voice comparison: A meta- analysis of forensic speech science research,” inProc. Int. Congr. Phon. Sci. 2023, R. Skarnitzl and J. V ol´ın, Eds., Prague, Czechia, 2023, pp. 3834–3838
2023
-
[24]
A case for formant analysis in forensic speaker identification,
F. Nolan and C. Grigoras, “A case for formant analysis in forensic speaker identification,”Int. J. Speech Lang. Law, vol. 12, no. 2, pp. 143–173, 2005
2005
-
[25]
Development of a quantitative description of vowel articulation,
K. N. Stevens and A. S. House, “Development of a quantitative description of vowel articulation,”J. Acoust. Soc. Am., vol. 27, pp. 484–493, 1955
1955
-
[26]
Fant,Acoustic Theory of Speech Production: With Calcula- tions Based on X-ray Studies of Russian Articulations
G. Fant,Acoustic Theory of Speech Production: With Calcula- tions Based on X-ray Studies of Russian Articulations. Walter de Gruyter, 1971
1971
-
[27]
DeepLabCut: Markerless pose estimation of user-defined body parts with deep learning,
A. Mathis, P. Mamidanna, K. M. Cury, T. Abe, V . N. Murthy, M. W. Mathis, and M. Bethge, “DeepLabCut: Markerless pose estimation of user-defined body parts with deep learning,”Nature Neurosci., vol. 21, pp. 1281–1289, 2018
2018
-
[28]
Beyond the edge: Markerless pose estimation of speech articulators from ultrasound and camera images using DeepLabCut,
A. Wrench and J. Balch-Tomes, “Beyond the edge: Markerless pose estimation of speech articulators from ultrasound and camera images using DeepLabCut,”Sensors, vol. 22, p. 1133, 2022
2022
-
[29]
Measuring tongue shapes and positions with ultrasound imaging: A valida- tion experiment using an articulatory model,
L. M ´enard, J. Aubin, M. Thibeault, and G. Richard, “Measuring tongue shapes and positions with ultrasound imaging: A valida- tion experiment using an articulatory model,”Folia Phoniatrica et Logopaedica, vol. 64, pp. 64–72, 2012
2012
-
[30]
I. L. Dryden and K. V . Mardia,Statistical Shape Analysis, with Applications in R. Chichester: Wiley, 2016
2016
-
[31]
I. L. Dryden,shapes: Statistical shape analysis, 2023, R package v1.2.7. [Online]. Available: https://CRAN.R-project. org/package=shapes
2023
-
[32]
New directions in shape analysis,
J. T. Kent, “New directions in shape analysis,” inThe Art of Sta- tistical Science, K. V . Mardia, Ed. New York: Wiley, 1992, pp. 115–127
1992
-
[33]
Locating de- lateralization in the pathway of sound changes affecting coda /l/,
P. Strycharczuk, D. Derrick, and J. Shaw, “Locating de- lateralization in the pathway of sound changes affecting coda /l/,” Lab. Phon., vol. 11, no. 1, 2020
2020
-
[34]
J. J. H. Lo,fvclrr: Likelihood ratio calculation and testing in forensic voice comparison, 2024, R package v1.1.6. [Online]. Available: https://github.com/justinjhlo/fvclrr
2024
-
[35]
Evaluation of trace evidence in the form of multivariate data,
C. G. G. Aitken and D. Lucy, “Evaluation of trace evidence in the form of multivariate data,”Appl. Statist., vol. 53, no. 1, pp. 109–122, 2004
2004
-
[36]
Tutorial on logistic-regression calibration and fusion: Converting a score to a likelihood ratio,
G. S. Morrison, “Tutorial on logistic-regression calibration and fusion: Converting a score to a likelihood ratio,”Aust. J. Forensic Sci., vol. 45, no. 2, pp. 173–197, 2013
2013
-
[37]
Application-independent evaluation of speaker detection,
N. Br ¨ummer and J. du Preez, “Application-independent evaluation of speaker detection,”Comput. Speech Lang., vol. 20, no. 2–3, pp. 230–275, 2006
2006
-
[38]
Individual differences in speech production: What is “phonetic substance
K. Johnson, “Individual differences in speech production: What is “phonetic substance”?” inProc. Int. Congr. Phon. Sci. 2023, R. Skarnitzl and J. V ol´ın, Eds., Prague, Czechia, 2023, pp. 1102– 1106
2023
-
[39]
Dimensionality reduction in lingual articulation of vowels: Evidence from lax vowels in Northern Anglo-English,
P. Strycharczuk, S. Kirkham, E. Gorman, and T. Nagamine, “Dimensionality reduction in lingual articulation of vowels: Evidence from lax vowels in Northern Anglo-English,”Lang. Speech, 2025. [Online]. Available: https://doi.org/10.1177/ 00238309251320581
2025
-
[40]
Seeing the trees in the forest: Diagnosing individual performance with acoustic data in likelihood ratio based foren- sic voice comparison,
J. J. H. Lo, “Seeing the trees in the forest: Diagnosing individual performance with acoustic data in likelihood ratio based foren- sic voice comparison,” inSpeaker Individuality in Phonetics and Speech Sciences: Speech Technology and Forensic Applications, C. Bernardasci, D. ...
2021
-
[41]
Mapping across feature spaces in forensic voice comparison: The contribution of auditory-based voice quality to (semi-)automatic system testing,
V . Hughes, P. Harrison, P. Foulkes, P. French, C. Kavanagh, and E. San Segundo, “Mapping across feature spaces in forensic voice comparison: The contribution of auditory-based voice quality to (semi-)automatic system testing,” inProc. INTERSPEECH 2017, Stockholm, Sweden, 2017...
2017
Reviewed August 7, 2026 · model on record in the stance chip above.
Discussion (0). Sign in to comment.