REVIEW 4 major objections 4 minor 22 references
LiDARDustX: A LiDAR Dataset for Dusty Unstructured Road Environments
T0 review · 4 major / 4 minor · reviewed 2026-08-07 · deepseek-v4-flash
Pith's one-line read This paper introduces a 30,000-frame, six-sensor LiDAR benchmark for dusty mining roads and shows that dust lowers 3D detection average precision by 9.9 to 18.1 points across six detectors.
desk verdict A genuinely useful dust-focused LiDAR dataset, but the paper's internal inconsistencies and the undefined dusty/dust-free split keep the headline dust-impact numbers from being fully established. read the letter →
The pith
A machine-rendered reading of the paper's core claim, the machinery that carries it, and where it could break.
The reading
What carries the argument
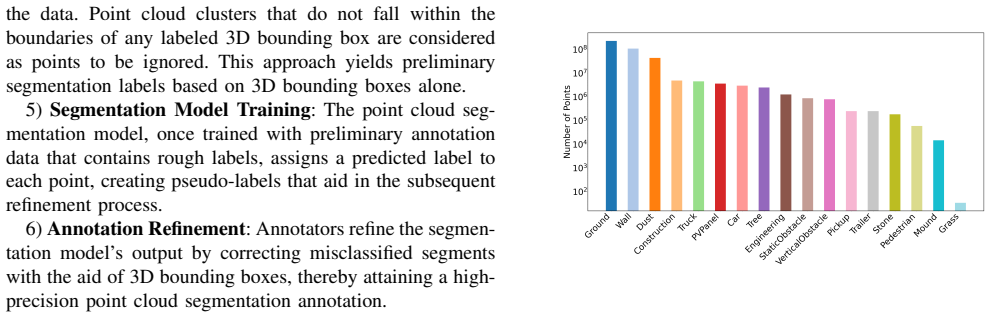
The load-bearing object is the LiDARDustX dataset itself: 30,000 frames from six LiDAR sensor types, each carrying 7-degree-of-freedom 3D bounding boxes (center, dimensions, heading), tracking IDs, and 16-class pointwise semantic labels, split 70/30 into training and test sets with the test set balanced between dusty and dust-free frames. The annotation pipeline stitches the six sensors into one dense cloud, estimates local surface orientation to seed ground points, grows connected regions to separate ground from non-ground, clusters non-ground points against existing boxes, trains a segmentation model on these rough labels to produce pseudo-labels, and then has annotators refine the output into final labels. The benchmark experiments use this setup to compare six single-task 3D detectors, several segmentation models, and one multi-task baseline, making dust the manipulated variable.
What would settle it
Have an independent team manually label dust masks and bounding boxes for a random subset of, say, 500 test frames without seeing the dataset's labels, then recompute the dusty-versus-dust-free average-precision gap; if the gap changes materially or model rankings shift, the reported 9.9-to-18.1-point effect is an artifact of the annotation protocol rather than a property of dust.
Extended reading notes
Core claim
The central discovery is a quantified, controlled comparison: when the same detectors are evaluated on dusty versus dust-free frames from the same LiDAR sensors, every model loses performance, with average precision falling by 9.9 points for the most robust detector and 18.1 points for the least robust. Dust source also matters: naturally occurring dust mostly increases false positives and false negatives, while vehicle-stirred dust degrades heading-angle accuracy and inflates false positives. The paper further finds that a multi-task model that jointly learns segmentation and detection is among the most stable in dust, which it interprets as evidence that segmentation supervision helps when dust obscures object boundaries.
Load-bearing premise
The benchmark's conclusions rest on the assumption that the semi-automatic labeling process, in which a model trained on rough labels is corrected by human annotators, produces ground-truth dust and object labels accurate enough that the measured performance gaps are caused by dust, not by label noise or dust-label bias.
Editorial extensions
If this is right
- Dust cannot be treated as ordinary sensor noise: all evaluated single-task detectors drop between 9.9 and 18.1 average-precision points on dusty frames, so dust-aware training or preprocessing is needed for mining-road autonomy.
- The balanced dusty/dust-free test split gives future methods a single headline number, the AP drop, to optimize when claiming dust resistance.
- Because segmentation holds up better than detection in dust, sharing segmentation features with detection, as the multi-task baseline does, is a workable route to more stable detection.
- Dust-source type should be reported separately, since natural dust and vehicle-stirred dust produce different error patterns.
Reading between the lines
- Extending the published benchmark from the three scored classes to the full 14 annotated classes would likely show larger dust penalties for small or rare objects, since the long-tailed class distribution already makes them harder to detect.
- The six-sensor design could test whether dust tolerance tracks sensor line count or vertical field of view, but the paper does not report per-sensor accuracy, so that relationship remains an open question.
- The error-cause statistics suggest targeted interventions: natural dust calls for denoising and hard-negative mining, while vehicle-stirred dust calls for heading-aware losses or orientation refinement.
- The dataset's dust labels could also train a dust-density estimator as a gating module, letting a vehicle switch to a dust-mode detector when dust is present.
Editorial analysis
A structured set of objections, weighed in public.
Referee Report
Summary. The paper introduces LiDARDustX, a new LiDAR dataset for autonomous driving in dusty, unstructured environments such as open-pit mines and sand quarries. The dataset reportedly contains 30,000 annotated frames from six different LiDAR sensors, with 3D bounding boxes and point-cloud semantic segmentation labels, and is claimed to be predominantly composed of dust-affected scenes. The authors benchmark six 3D object detectors, five semantic segmentation networks, and one multi-task model, and analyze how dust degrades detection accuracy, reporting an average-precision drop between 9.9 and 18.1 points on dusty versus dust-free test subsets. The paper also presents an error-cause analysis based on a manual inspection of 100 error frames. The dataset is publicly announced via a GitHub link.
Significance. If the dataset is released as described and the numerical results are verified, LiDARDustX would fill a clear gap: currently available autonomous-driving datasets are overwhelmingly urban and structured, and dust is a realistic but underrepresented challenge for perception systems in mining and quarrying environments. The multi-sensor setup, the simultaneous support for detection and segmentation, the large annotated frame count, and the broad baseline evaluation are genuine strengths. The paper also makes a falsifiable claim about dust-induced performance degradation, which is valuable if the experimental protocol is made reproducible. The main weaknesses are internal statistical inconsistencies and an underspecified evaluation split, both of which affect the credibility of the headline quantitative claims.
major comments (4)
- [Abstract, Section I, Section III.A, Section III.E, Table I] The dataset statistics are internally inconsistent. The abstract states that 'over 80%' of the dataset comprises dust-affected scenes, while the introduction's contribution bullet states 'over 95%'. Section III.A says that 200 dust-rich sequences were selected, but Table I and Section III.E both report 180 sequences. Additionally, 180 sequences of approximately 20 seconds at the stated 5 Hz keyframe rate would yield roughly 18,000 frames, not the claimed 30,000. These discrepancies affect the dataset's identity and must be resolved with precise definitions and a single set of consistent numbers.
- [Section III.E and Section IV.D, Table III] The central result that dust degrades detection AP by 9.9–18.1 points depends on partitioning the test set into 'dusty' and 'dust-free' subsets, but the paper never defines how this partition is made. Section III.E only says the test set is 'comprised of an equal amount of dusty and dust-free data', and Section IV.D says performance was 'assessed on dust-affected and dust-free subsets'; there is no frame-level dust attribute, no threshold, and no manual protocol. The only dust signal in the annotation pipeline is the semantic Dust class, which is produced by a segmentation model trained on rough labels and then corrected by annotators (Section III.C.4–6). If the split inherits errors from these pseudo-labels, the independent variable of Table III is contaminated. Please specify the partition criterion, release per-frame dust labels, and report dust-point fraction statistics for both subsets.
- [Section V and Table IV] The error-cause analysis is internally contradictory. The text states that natural dust mainly increases false positives and false negatives without significantly affecting orientation accuracy, while vehicle-induced dust degrades the precision of orientation and increases false positives. Table IV shows the opposite pattern: vehicular activities have FP=21, FN=25, and orientation error=0, whereas naturally occurring dust has FP=19, FN=2, and orientation error=43. The table and the text cannot both be correct. The sampling protocol for the 'subjective examination' (100 frames, no seed, no detailed error taxonomy) is also not described. Please correct the discrepancy and provide a reproducible protocol for the error analysis.
- [Section III.C and Table III] The paper asserts that the annotations are high-precision and uses Table III to support quantitative conclusions, but it provides no annotation-quality metrics and no run-to-run variability estimates. There are no inter-annotator agreement statistics, no validation protocol for the pseudo-label refinement step, and no error bars or multiple-seed results for the benchmark numbers. Without such evidence, the observed AP drops cannot be separated from label noise and optimization variance. Please add quantitative annotation-quality measures and report standard deviations or confidence intervals for the main benchmark results.
minor comments (4)
- [References] Reference [12] is cited for CenterPoint, but the given title, 'Centerpoints: A link between optimization and convex geometry', is not the CenterPoint 3D object detection paper. Please cite the correct reference.
- [Table II and Section IV.C] The name of the multi-task model is written as 'LisD' in Table II and as 'LiSD' in the text; please standardize the spelling.
- [Section III.D] The paper mentions a 1:30 ratio between the least and most annotated classes, but the underlying counts are not stated numerically. Please provide the exact point counts for the smallest and largest semantic classes so the ratio can be verified.
- [Dataset release] The dataset is announced through a GitHub link, but the paper does not specify a versioned release, a persistent identifier such as a DOI, or a license. These details should be added for reproducibility and community use.
Circularity Check
No circular derivation: LiDARDustX is a new dataset with empirical benchmarks; the only self-reference is the authors' LiSD baseline, which is evaluated on the new data, not assumed.
full rationale
This paper contains no derivation chain whose output is equivalent to its inputs. The contributions are a new 30,000-frame LiDAR dataset, annotations, and benchmark evaluations. The dusty/dust-free test split is not fully specified (Sec. III.E only says the test set is 'comprised of an equal amount of dusty and dust-free data'), and the dust labels originate from a model-trained pseudo-label pipeline corrected by annotators (Sec. III.C.5-6); that is a measurement-validity concern about the independent variable, but the paper does not define the split in terms of the benchmark outputs, so no equation or fitted parameter is renamed as a prediction. The strongest self-referential element is that the top-performing multi-task model LiSD is the authors' prior work [20], and the paper highlights its superiority; however, LiSD's numbers are measured on the new dataset rather than imported from the citation, so the citation is not load-bearing. The internal inconsistency between the Table IV error-cause statistics and the prose description of natural versus vehicle dust is a correctness issue, not circularity. No self-definitional step, fitted-input-as-prediction, or uniqueness-imported-by-authors pattern is present.
Assumptions & free parameters
assumptions (4)
- domain assumption The six LiDAR sensors are synchronized and extrinsically calibrated so the stitched point clouds used for annotation are spatially consistent.
- domain assumption The semantic class 'dust' can be consistently distinguished from obstacles and ground by the annotators and the pseudo-label model.
- domain assumption The 70/30 training/test split preserves the dusty and dust-free frame distribution so the dust impact comparison in Section IV.D is fair.
- standard math Standard detection and segmentation metrics (mAP at 0.7/0.5 IoU, mIoU) are computed correctly on the released test set.
Cite this review
Pith. "Pith review of LiDARDustX: A LiDAR Dataset for Dusty Unstructured Road Environments." pith.science (2026). https://pith.science/paper/MIOTPN6E
@misc{pith2026250521914,
  author       = {Pith},
  title        = {Pith review of: LiDARDustX: A LiDAR Dataset for Dusty Unstructured Road Environments},
  year         = {2026},
  howpublished = {\url{https://pith.science/paper/MIOTPN6E}},
  note         = {Machine review of arXiv:2505.21914}
}
read the original abstract
Autonomous driving datasets are essential for validating the progress of intelligent vehicle algorithms, which include localization, perception, and prediction. However, existing datasets are predominantly focused on structured urban environments, which limits the exploration of unstructured and specialized scenarios, particularly those characterized by significant dust levels. This paper introduces the LiDARDustX dataset, which is specifically designed for perception tasks under high-dust conditions, such as those encountered in mining areas. The LiDARDustX dataset consists of 30,000 LiDAR frames captured by six different LiDAR sensors, each accompanied by 3D bounding box annotations and point cloud semantic segmentation. Notably, over 80% of the dataset comprises dust-affected scenes. By utilizing this dataset, we have established a benchmark for evaluating the performance of state-of-the-art 3D detection and segmentation algorithms. Additionally, we have analyzed the impact of dust on perception accuracy and delved into the causes of these effects. The data and further information can be accessed at: https://github.com/vincentweikey/LiDARDustX.
Figures


Figures from the paper (3 more)


Reference graph
Works this paper leans on
-
[1]
Are we ready for autonomous driving? the kitti vision benchmark suite,
A. Geiger, P. Lenz, and R. Urtasun, “Are we ready for autonomous driving? the kitti vision benchmark suite,” in2012 IEEE conference on computer vision and pattern recognition, pp. 3354–3361, IEEE, 2012
2012
-
[2]
nuscenes: A multimodal dataset for autonomous driving,
H. Caesar, V . Bankiti, A. H. Lang, S. V ora, V . E. Liong, Q. Xu, A. Krishnan, Y . Pan, G. Baldan, and O. Beijbom, “nuscenes: A multimodal dataset for autonomous driving,” inProceedings of the IEEE/CVF conference on computer vision and pattern recognition, pp. 11621–11631, 2020
2020
-
[3]
Large scale interactive motion forecasting for autonomous driving: The waymo open motion dataset,
S. Ettinger, S. Cheng, B. Caine, C. Liu, H. Zhao, S. Pradhan, Y . Chai, B. Sapp, C. R. Qi, Y . Zhou,et al., “Large scale interactive motion forecasting for autonomous driving: The waymo open motion dataset,” inProceedings of the IEEE/CVF International Conference on Computer Vision, pp. 9710–9719, 2021
work page 2021
-
[4]
Argoverse: 3d tracking and forecasting with rich maps,
M.-F. Chang, J. Lambert, P. Sangkloy, J. Singh, S. Bak, A. Hartnett, D. Wang, P. Carr, S. Lucey, D. Ramanan,et al., “Argoverse: 3d tracking and forecasting with rich maps,” inProceedings of the IEEE/CVF conference on computer vision and pattern recognition, pp. 8748–8757, 2019
work page 2019
-
[5]
A* 3d dataset: Towards autonomous driving in challenging environments,
Q.-H. Pham, P. Sevestre, R. S. Pahwa, H. Zhan, C. H. Pang, Y . Chen, A. Mustafa, V . Chandrasekhar, and J. Lin, “A* 3d dataset: Towards autonomous driving in challenging environments,” in2020 IEEE In- ternational conference on Robotics and Automation (ICRA), pp. 2267– 2273, IEEE, 2020
work page 2020
-
[6]
A2d2: Audi autonomous driving dataset,
J. Geyer, Y . Kassahun, M. Mahmudi, X. Ricou, R. Durgesh, A. S. Chung, L. Hauswald, V . H. Pham, M. Mühlegg, S. Dorn,et al., “A2d2: Audi autonomous driving dataset,”arXiv preprint arXiv:2004.06320, 2020
arXiv 2004
-
[7]
One million scenes for autonomous driving: Once dataset,
J. Mao, M. Niu, C. Jiang, H. Liang, J. Chen, X. Liang, Y . Li, C. Ye, W. Zhang, Z. Li,et al., “One million scenes for autonomous driving: Once dataset,”arXiv preprint arXiv:2106.11037, 2021
arXiv 2021
-
[8]
Semantickitti: A dataset for semantic scene un- derstanding of lidar sequences,
J. Behley, M. Garbade, A. Milioto, J. Quenzel, S. Behnke, C. Stach- niss, and J. Gall, “Semantickitti: A dataset for semantic scene un- derstanding of lidar sequences,” inProceedings of the IEEE/CVF international conference on computer vision, pp. 9297–9307, 2019
work page 2019
Show all 22 references
-
[9]
Automine: An unmanned mine dataset,
Y . Li, Z. Li, S. Teng, Y . Zhang, Y . Zhou, Y . Zhu, D. Cao, B. Tian, Y . Ai, Z. Xuanyuan,et al., “Automine: An unmanned mine dataset,” inProceedings of the IEEE/CVF Conference on Computer Vision and Pattern Recognition, pp. 21308–21317, 2022
2022
-
[10]
Pointpillars: Fast encoders for object detection from point clouds,
A. H. Lang, S. V ora, H. Caesar, L. Zhou, J. Yang, and O. Beijbom, “Pointpillars: Fast encoders for object detection from point clouds,” in2019 IEEE/CVF Conference on Computer Vision and Pattern Recognition (CVPR), Jun 2019
2019
-
[11]
Pv-rcnn: Point-voxel feature set abstraction for 3d object detection,
S. Shi, C. Guo, L. Jiang, Z. Wang, J. Shi, X. Wang, and H. Li, “Pv-rcnn: Point-voxel feature set abstraction for 3d object detection,” in2020 IEEE/CVF Conference on Computer Vision and Pattern Recognition (CVPR), Jun 2020
2020
-
[12]
Centerpoints: A link between optimization and convex geometry,
A. Basu and T. Oertel, “Centerpoints: A link between optimization and convex geometry,”arXiv: Optimization and Control,arXiv: Opti- mization and Control, Nov 2015
2015
-
[13]
Pillarnet: Real-time and high-performance pillar-based 3d object detection,
G. Shi, R. Li, and C. Ma, “Pillarnet: Real-time and high-performance pillar-based 3d object detection,” inEuropean Conference on Com- puter Vision, pp. 35–52, Springer, 2022
2022
-
[14]
V oxelnext: Fully sparse voxelnet for 3d object detection and tracking,
Y . Chen, J. Liu, X. Zhang, X. Qi, and J. Jia, “V oxelnext: Fully sparse voxelnet for 3d object detection and tracking,” inProceedings of the IEEE/CVF Conference on Computer Vision and Pattern Recognition, pp. 21674–21683, 2023
2023
-
[15]
Transfusion: Robust lidar-camera fusion for 3d object detection with transformers,
X. Bai, Z. Hu, X. Zhu, Q. Huang, Y . Chen, H. Fu, and C.-L. Tai, “Transfusion: Robust lidar-camera fusion for 3d object detection with transformers,” inProceedings of the IEEE/CVF conference on computer vision and pattern recognition, pp. 1090–1099, 2022
2022
-
[16]
Pointnet++: Deep hierarchical feature learning on point sets in a metric space,
C. Qi, L. Yi, H. Su, and L. Guibas, “Pointnet++: Deep hierarchical feature learning on point sets in a metric space,”Cornell University - arXiv,Cornell University - arXiv, Jun 2017
2017
-
[17]
Randla-net: Efficient semantic segmentation of large-scale point clouds,
Q. Hu, B. Yang, L. Xie, S. Rosa, Y . Guo, Z. Wang, N. Trigoni, and A. Markham, “Randla-net: Efficient semantic segmentation of large-scale point clouds,” in2020 IEEE/CVF Conference on Computer Vision and Pattern Recognition (CVPR), Jun 2020
2020
-
[18]
Cenet: Consolidation-and-exploration network for continuous domain adapta- tion,
C. Zhang, Y . Cheng, P. Wei, H. He, and J. Chen, “Cenet: Consolidation-and-exploration network for continuous domain adapta- tion,” in2022 IEEE/CVF Conference on Computer Vision and Pattern Recognition Workshops (CVPRW), Jun 2022
2022
-
[19]
Cylin- der3d: An effective 3d framework for driving-scene lidar semantic seg- mentation.,
H. Zhou, X. Zhu, X. Song, Y . Ma, Z. Wang, H. Li, and D. Lin, “Cylin- der3d: An effective 3d framework for driving-scene lidar semantic seg- mentation.,”arXiv: Computer Vision and Pattern Recognition,arXiv: Computer Vision and Pattern Recognition, Aug 2020
2020
-
[20]
Lisd: An efficient multi- task learning framework for lidar segmentation and detection,
J. Xu, S. Zuo, C. Wei, and W. Zhou, “Lisd: An efficient multi- task learning framework for lidar segmentation and detection,”arXiv preprint arXiv:2406.07023, 2024
2024 arXiv
-
[21]
The pascal visual object classes (voc) challenge,
M. Everingham, L. Van Gool, C. K. Williams, J. Winn, and A. Zisser- man, “The pascal visual object classes (voc) challenge,”International journal of computer vision, vol. 88, pp. 303–338, 2010
2010
-
[22]
V oxelnet: End-to-end learning for point cloud based 3d object detection,
Y . Zhou and O. Tuzel, “V oxelnet: End-to-end learning for point cloud based 3d object detection,” in2018 IEEE/CVF Conference on Computer Vision and Pattern Recognition, Jun 2018
2018
Reviewed August 7, 2026 · model on record in the stance chip above.
Discussion (0). Sign in to comment.