REVIEW 4 major objections 4 minor 3 references
A Human-Centric Approach to Explainable AI for Personalized Education
T0 review · 4 major / 4 minor · reviewed 2026-08-07 · deepseek-v4-flash
Pith's one-line read This thesis argues that post-hoc explainers are too inconsistent to serve as a trust layer in education, and that interpretable-by-design architectures plus an LLM explanation layer can deliver explanations that are accurate, real-time…
desk verdict A cumulative PhD thesis with a strong peer-reviewed core and a self-defined evaluation framework that needs scrutiny on criterion completeness. read the letter →
The pith
A machine-rendered reading of the paper's core claim, the machinery that carries it, and where it could break.
The reading
What carries the argument
The load-bearing mechanism is a set of five design targets for explanations—accurate with certainty, real-time, consistent, actionable, and human-understandable—used as the evaluation yardstick throughout the thesis. The technical machinery consists of three complementary components: MultiModN, which sequentially fuses latent representations from multiple modalities and therefore makes each modality's contribution naturally inspectable; InterpretCC, which uses adaptive sparsity to activate only the features or feature groups needed for each prediction, so the explanation is the actual decision path; and iLLuMinaTE, an LLM-XAI pipeline whose multi-stage prompts align generated feedback with cognitive theories of explanation. Together these components are intended to satisfy the five design targets simultaneously, without sacrificing accuracy.
What would settle it
Give teachers and students the same predictions with explanations from both a post-hoc pipeline and the proposed intrinsic-plus-LLM pipeline, ask them to make real advising decisions under blind conditions, and include fairness, causal validity, and cost of acting among the evaluation criteria; if post-hoc explanations prove equally actionable or more trusted, the thesis's central ranking would not hold.
Extended reading notes
Core claim
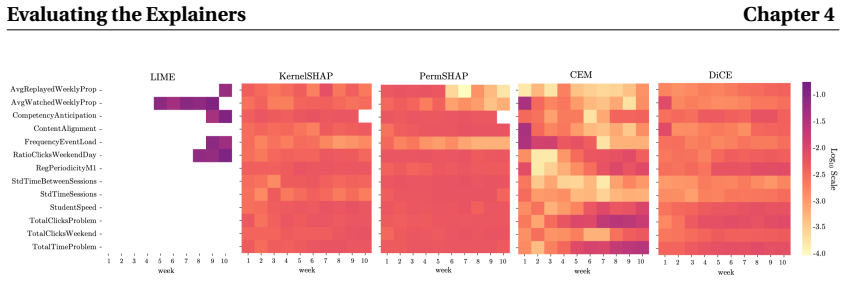
The core discovery is that explainability method choice, not the underlying model or the student data, dominates what an explanation highlights: across five courses and five explainers, the feature importance distributions clustered by explainer rather than by course, with LIME consistently farthest from the others. This systematic disagreement, together with expert educators disagreeing about which explanations to trust, motivates the thesis's move to architectures that are interpretable by design. The proposed models—MultiModN, a sequential multimodal modular network, and InterpretCC, a sparse mixture-of-experts model—match non-interpretable baselines on balanced accuracy while providing explanations directly tied to the model's own decision process. Adversarial training improves the consistency of counterfactual explanations but not of LIME and SHAP, showing that consistency must be addressed holistically. Finally, the iLLuMinaTE pipeline uses large language models to convert feature-based explanations into concise, actionable feedback aligned with social-science explanation theories, and students prefer these explanations for clarity and actionability.
Load-bearing premise
The five design targets are the thesis's own yardstick, drawn from a viewpoint paper rather than from stakeholders, so the verdict that post-hoc methods fail and intrinsic models succeed presupposes that these criteria are the right ones.
Editorial extensions
If this is right
- Classroom adoption of AI becomes more feasible because students receive instant, understandable feedback that they can act on, rather than raw feature scores.
- Post-hoc explainers should not be treated as a trust layer in education, since their explanations vary more with method choice than with the actual model or data.
- Interpretable-by-design architectures can match black-box accuracy while providing faithful, real-time explanations, removing the presumed tradeoff in this setting.
- Adversarial training can stabilize counterfactual explanations, but LIME and SHAP remain sensitive to random perturbations, so explainer consistency cannot be fixed by model robustness alone.
- Course design decisions can be grounded in explanations when educators are shown an ensemble of explainers, with a majority finding at least one actionable interpretation.
Reading between the lines
- If the evaluation criteria were broadened to include fairness, causal validity, or the cost of acting on an explanation, the relative ranking of post-hoc versus intrinsic approaches could change; the thesis does not test those criteria.
- The same evaluation template—five design targets plus user studies—could be exported to other human-centric domains such as healthcare or hiring, although the thesis only demonstrates it in education.
- A testable extension is whether the LLM communication layer would make post-hoc explanations appear equally actionable, which would separate the communication win from the architecture win.
Editorial analysis
A structured set of objections, weighed in public.
Referee Report
Summary. This PhD-style manuscript argues that post-hoc explainability methods (LIME, KernelSHAP, PermSHAP, CEM, DiCE) are systematically inconsistent when applied to student success prediction models and are therefore unsuitable as a trust layer for personalized education. It then proposes a shift toward intrinsically interpretable architectures: MultiModN (sequential multimodal fusion), InterpretCC (sparse mixture-of-experts with feature or group routing), adversarial training for explainer stability, and iLLuMinaTE (an LLM-based theory-driven communication layer that turns XAI outputs into feedback for students). The thesis evaluates these contributions across large MOOC datasets, five explainers, and four human studies with professors, teachers, learning scientists, and students, claiming that explainability can be made accurate, real-time, consistent, actionable, and human-understandable.
Significance. The constituent chapters of this thesis have already passed peer review at strong venues (NeurIPS, ICLR, AAAI, LAK, Learning@Scale, EDM), and the visible methodology is careful: balanced accuracy on imbalanced MOOCs, stratified sampling of representative students, five random seeds with overlapping confidence intervals in Chapter 8, and multiple human studies with domain experts. The authors also release code and models for the main technical contributions. If the framework-level claims are taken at face value, the work would be an important step toward human-centric XAI in education, particularly the move from post-hoc approximation to interpretable-by-design architectures combined with an LLM communication layer. The main risk is not the individual experiments but the framework that ties them together: the five design targets are sourced from the author's own under-review viewpoint paper and are then used as the yardstick for all comparative verdicts. This circularity is load-bearing and needs to be addressed head-on.
major comments (4)
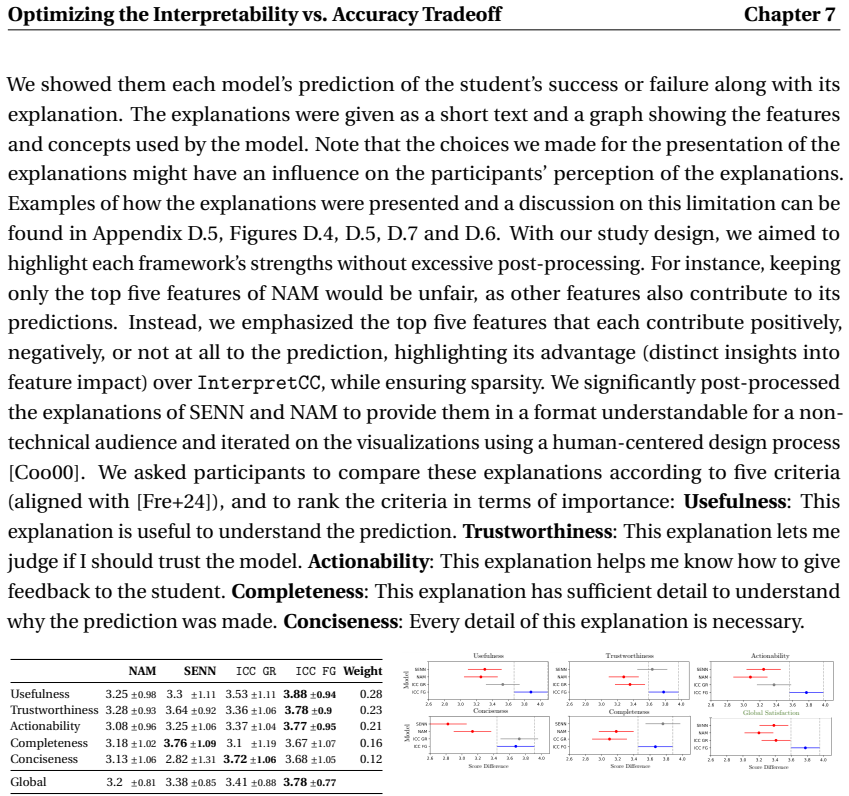
- [Section 1.3 and Chapter 10] The five design targets (accurate with certainty, real-time, consistent, actionable, human-understandable) are introduced in Section 1.3 as 'motivated originally in [SFK23]', the author's own under-review viewpoint paper, rather than as a standard elicited from stakeholders or derived from an established framework. Every contribution chapter then demonstrates that its method satisfies these targets, and Chapter 10 organizes the conclusions around them. This creates a circularity at the framework level: the comparative verdicts (post-hoc explainers fail; intrinsic models plus iLLuMinaTE succeed) presuppose that this self-authored yardstick is correct, complete, and correctly weighted. The user studies in Chapter 7 (Table 7.4) and Chapter 9 (Figure 9.5) let participants rank or choose within the dimensions the authors made available, but they do not elicit the dimensions themselves or their relative weights. If real deployment requires additional or differently weighted criteria, such as fairness, causal validity, the cost of acting on an explanation, privacy, or downstream learning outcomes, the evidence as presented cannot rank the proposed methods against those criteria. The thesis is transparent about the source of the framework, but transparency does not supply the missing stakeholder validation. I would ask for either a stakeholder elicitation study that derives and weights the design targets independently, or a substantial reframing that treats the five targets as working hypotheses rather than as the established basis for comparative conclusions.
- [Section 3.2.2 and Figure 3.4] The early-dropout filtering step removes students whose predicted failure probability exceeds 0.99 according to a logistic regression trained on assignment grades from the first two weeks. This is an ad hoc preprocessing choice: the threshold is tuned by grid search on the training courses, and the transfer results reported in Tables 3.2 and 3.3 and in Figures 3.3 are computed on the filtered population. Figure 3.4 shows that the broad patterns are similar on the full population, and the text states that the predictors 'have high accuracy on these students as well', but no quantitative comparison of transfer performance on filtered versus unfiltered populations is provided, nor is there a sensitivity analysis of the threshold. Because the filtering disproportionately affects courses with different assignment schedules, lengths, and dropout rates, this could bias the conclusion that behavior-plus-meta models transfer better than same-course baselines. The claim of generalizable student modeling needs a robustness check showing that the transfer rankings are stable across reasonable choices of the filtering threshold and across courses with very different early-assessment structures.
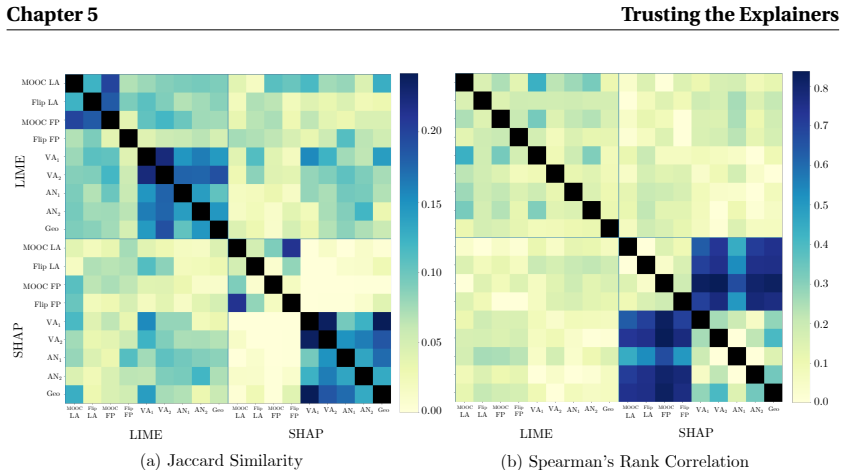
- [Section 4.3.2 and Figure 4.3] The central 'systematic disagreement' result is based on explanations for 100 uniformly sampled students per course and a single trained BiLSTM per course in Chapter 4, with a related design in Chapter 5. The sampling strategy balances on predicted probability intervals, but the resulting set is not shown to be representative of the full student distribution, and the PCA, Spearman correlation, and Jensen-Shannon distance analyses do not report bootstrap confidence intervals or variation across random seeds. Chapter 8 later studies seed variation and finds substantial explainer variance, but the earlier chapters' strong claim that the choice of explainer dominates the choice of course or model would be considerably more robust if the original comparison included multiple model initializations and repeated sampling with uncertainty estimates. As it stands, the claim could be sensitive to the particular 100-student samples and the single trained model per course.
- [Chapter 9 and overall framing] The 'actionable' design target is validated through student self-reported preference and Likert ratings (e.g., 89.2% preference, usefulness and actionability scores in Figures 9.5 and 9.6), not by measuring whether students or teachers can actually implement the suggestions or whether doing so improves learning outcomes. The abstract's claim that the work 'lays a foundation' for human-centric AI systems is more modest than the introduction's suggestion that classroom adoption becomes feasible, but the gap remains: perceived actionability is demonstrated, realized actionability is not. A small deployment study, a follow-up behavior measurement, or an explicit limitation statement that realized actionability is outside the scope would help calibrate the conclusions.
minor comments (4)
- [Section 2.2] The text says 'As illustrated in Figure 8.1' when describing the taxonomy of explainability stages; the correct cross-reference should be Figure 2.1.
- [Sections 1.2 and 2.2] There are typos: 'innaccuracies' in Section 1.2 and 'vase majority' in Section 2.2. Also, the sentence 'most of these studies have performed a-posteriori or post-hoc analyses, and not models for early success prediction' in Section 2.1 is awkward and should be rephrased.
- [Tables 4.1 and 5.3] Both tables refer to 'Section 7.5' for the features identified as important by at least one explainability method, but the relevant analyses appear in Sections 4.3.3 and 5.3; these cross-references should be corrected.
- [Table 9.1] Table 9.1 reports that explanations are 'Annotated by experts and GPT-4o', but the number of expert annotators and their inter-rater agreement are not stated in the main text; the reader should be pointed to Appendix E.2 with a concrete agreement figure.
Circularity Check
No material circularity: the only self-referential element is the [SFK23]-motivated five-target framework in Section 1.3, which frames but does not by construction force the thesis's empirical claims.
full rationale
The closest thing to a circular step is Section 1.3, where the thesis states 'we define five design targets that explanations should fulfill, motivated originally in [SFK23]' — a viewpoint paper co-authored by the thesis author. This is a minor self-citation and it does supply the normative yardstick (accurate-with-certainty, real-time, consistent, actionable, human-understandable) used to organize the contributions. However, the paper's load-bearing results are not equivalent to that yardstick by construction. The claim that post-hoc explainers are inconsistent is supported by direct quantitative comparisons (Spearman correlation, Jensen-Shannon distance, PCA) across five explainers on independently trained BiLSTM models (Chapter 4), by educator interviews (Chapter 5), and by random-seed and adversarial-robustness experiments (Chapter 8). The claims that the proposed interpretable architectures match non-interpretable baselines rest on performance comparisons with reported confidence intervals (Chapters 6 and 7), and the iLLuMinaTE preference and actionability claim rests on a 114-student user study measuring choices and Likert ratings (Chapter 9). The five targets are a normative scheme, not an equation into which findings are substituted; choosing the scheme affects how findings are weighted but does not make the measurements equal to the scheme's assumptions. The GPT-4o annotation of LLM-generated explanations (Table 9.1) is a measurement-protocol concern rather than a derivation-level circularity, and the thesis also reports expert agreement (Table E.2). I therefore find no significant circularity.
Assumptions & free parameters
free parameters (4)
- Early-dropout filtering threshold =
P(fail) > 0.99
- Explainer evaluation sample =
100 students per course (50 pass, 50 fail)
- InterpretCC sparsity controls =
Gumbel tau and activation threshold tuned per dataset
- iLLuMinaTE prompt templates =
Six theory prompt designs (Appendix E.2)
assumptions (5)
- domain assumption The five design targets (accurate with certainty, real-time, consistent, actionable, human-understandable) are the correct normative criteria for evaluating XAI in education.
- domain assumption The four behavioral feature sets from [MVK21] (Regularity, Engagement, Control, Participation, 42-45 features) sufficiently capture student behavior for success prediction and explanation.
- ad hoc to paper Removing early-dropout students (predicted failure probability above 0.99) does not bias the comparisons of transfer models and explainers.
- domain assumption Social-science theories of explanation (contrastive, Pearl's model, necessity and robustness, and others) can be faithfully operationalized by prompting an LLM.
- domain assumption Self-reported preference and perceived actionability in lab or online user studies predict real classroom use and learning benefit.
Cite this review
Pith. "Pith review of A Human-Centric Approach to Explainable AI for Personalized Education." pith.science (2026). https://pith.science/paper/YE6IUTVH
@misc{pith2026250522541,
  author       = {Pith},
  title        = {Pith review of: A Human-Centric Approach to Explainable AI for Personalized Education},
  year         = {2026},
  howpublished = {\url{https://pith.science/paper/YE6IUTVH}},
  note         = {Machine review of arXiv:2505.22541}
}
read the original abstract
Deep neural networks form the backbone of artificial intelligence research, with potential to transform the human experience in areas ranging from autonomous driving to personal assistants, healthcare to education. However, their integration into the daily routines of real-world classrooms remains limited. It is not yet common for a teacher to assign students individualized homework targeting their specific weaknesses, provide students with instant feedback, or simulate student responses to a new exam question. While these models excel in predictive performance, this lack of adoption can be attributed to a significant weakness: the lack of explainability of model decisions, leading to a lack of trust from students, parents, and teachers. This thesis aims to bring human needs to the forefront of eXplainable AI (XAI) research, grounded in the concrete use case of personalized learning and teaching. We frame the contributions along two verticals: technical advances in XAI and their aligned human studies. We investigate explainability in AI for education, revealing systematic disagreements between post-hoc explainers and identifying a need for inherently interpretable model architectures. We propose four novel technical contributions in interpretability with a multimodal modular architecture (MultiModN), an interpretable mixture-of-experts model (InterpretCC), adversarial training for explainer stability, and a theory-driven LLM-XAI framework to present explanations to students (iLLuMinaTE), which we evaluate in diverse settings with professors, teachers, learning scientists, and university students. By combining empirical evaluations of existing explainers with novel architectural designs and human studies, our work lays a foundation for human-centric AI systems that balance state-of-the-art performance with built-in transparency and trust.
Figures


Figures from the paper (41 more)








Reference graph
Works this paper leans on
-
[146]
How to Quantify Student’ s Regularity?
ISSN : 2307-387X. [Bor+16a] Mina Shirvani Boroujeni et al. “How to Quantify Student’ s Regularity?” In:Adap- tive and Adaptable Learning. Ed. by Katrien Verbert, Mike Sharples, and Tomaž Klobuˇ car. 2016. [Bor+16b] Mina Shirvani Boroujeni et al. “How to quantify student’ s regularity?” In:ECTEL. Springer. 2016, pp. 277–291. [BP15] Journal Broadbent and W ...
arXiv 2015
-
[405]
DOI : 10.1109/CCWC54503.2022.9720806. [Has17] Trevor J Hastie. “Generalized additive models”. In:Statistical models in S. Rout- ledge, 2017. [Haz+21] Hussein Hazimeh et al. “Dselect-k: Differentiable selection in the mixture of experts with applications to multi-task learning”. In: Advances in Neural Infor- mation Processing Systems 34 (2021), pp. 29335–2...
arXiv 2021
-
[2023]
URL : https://openreview.net/forum?id=i2_TvOFmEml. [Lin+22] Tianyang Lin et al. “A survey of transformers”. In: AI open 3 (2022), pp. 111–132. 257 Chapter E BIBLIOGRAPHY [Lin91] Jianhua Lin. “Divergence measures based on the Shannon entropy”. In: IEEE Tran. on Info. Theory 37.1 (1991), pp. 145–151. [Lip90] Peter Lipton. “Contrastive explanation”. In:Royal...
arXiv 2022
Reviewed August 7, 2026 · model on record in the stance chip above.
Discussion (0). Sign in to comment.