REVIEW 4 major objections 6 minor 2 cited by
A hybrid PDE-ABM model for angiogenesis and tumour microenvironment with application to resistance in cancer treatment
T0 review · 4 major / 6 minor · reviewed 2026-08-07 · deepseek-v4-flash
Pith's one-line read Tumour blood-vessel networks and early mutations jointly drive drug resistance in a hybrid PDE-agent model.
desk verdict Plausible hybrid model with suggestive results, but single-run evidence and hand-tuned parameters leave the central claims unestablished. read the letter →
The pith
A machine-rendered reading of the paper's core claim, the machinery that carries it, and where it could break.
The reading
What carries the argument
The engine of the argument is a hybrid discrete-continuous (HDC) model: reaction-diffusion PDEs for tumour angiogenic factor, oxygen, and drug concentration are solved on a grid with finite-difference and alternating-direction implicit methods, while tumour cells and endothelial tip cells are agents with rules for movement, branching, anastomosis, proliferation, apoptosis, and mutation. The load-bearing new component is the consecutive random mutation algorithm, in which each mutation multiplies a cell's death threshold, oxygen consumption rate, and proliferation rate by independent random factors drawn from $U[0.7,1.7]$ (bounded to $[0.5x,4x]$), producing gradual, non-directional trait changes. The feedback loop the authors identify is the mechanism that carries the biological conclusion: proliferation rate controls mutation frequency at a fixed mutation rate, and resistance controls survival under drug, so the two traits reinforce each other under selection and eventually yield dominance of cells carrying both.
What would settle it
Run the same agent-based simulation with the mutation rate decoupled from proliferation, for example as a fixed per-cell probability per time step rather than per division, and check whether high proliferation and high resistance still co-dominate; if they do not, the proposed feedback mechanism is not necessary for the result. Alternatively, in spatial data from EGFR-TKI-resistant non-small cell lung cancer, test whether resistant and fast-proliferating clones preferentially colocalise near vessels, since a uniform distribution would contradict the perivascular sanctuary claim.
Extended reading notes
Core claim
In the paper's own terms, the central discovery is that tumour-induced angiogenesis produces a microenvironment that enhances both pre-existing and mutation-induced drug resistance, and that spontaneous resistance is governed by a mutually reinforcing coupling between proliferation rate and resistance. In the pre-existing case, vessels supply oxygen near the tumour, and because oxygen-driven division halves cellular drug damage at each generation while drug damage accumulates linearly, the region around vessels becomes a sanctuary where resistant cells survive low-dose treatment. In the spontaneous case, a consecutive random mutation algorithm lets daughter cells alter death threshold, oxygen consumption, and proliferation rate by random factors; selection under drug pressure then favours cells with both elevated resistance and elevated proliferation, because at fixed mutation rate more divisions mean more mutation opportunities, and the resistant survivors keep proliferating. The paper identifies this feedback as the reason that cells combining high proliferation with high resistance eventually dominate, and it presents the early-time mutation accumulation window as the period when treatment can still succeed.
Load-bearing premise
The qualitative conclusions, such as the perivascular sanctuary, the earlier-mutation advantage, and the proliferation-resistance feedback, are assumed to survive changes in the hand-set parameters (TAF source $k=5$, oxygen supply $S_o=3.5$, adjusted TAF production $\eta=1000$) and in the ad hoc $U[0.7,1.7]$ mutation multiplier, but no sensitivity analysis or ensemble statistics are reported to verify this.
Editorial extensions
If this is right
- If the perivascular sanctuary mechanism is right, tumour cells nearest to newly formed vessels should be the hardest to eliminate with low-dose continuous therapy, and vessel-rich regions should be the first site of resistance-driven recurrence.
- If earlier and more frequent mutations confer greater survival advantage, then delaying resistance by reducing mutation opportunities, for example by cytostatic control of proliferation, should measurably improve treatment outcome rather than merely delaying regrowth.
- The model's resolution of the T790M conflict implies that the growth-disadvantage and growth-advantage phenotypes are not contradictory states of the same mutation but different evolutionary outcomes: the resistance mutation alone can slow growth, while co-selected additional alterations produce aggressively proliferating resistant clones.
- The optimal-scheduling comparison in the paper implies that pulsed high-dose and continuous low-dose regimens with equal total dose differ in which resistance mechanism they fail against, so treatment choice should depend on whether resistance is pre-existing or mutation-driven.
Reading between the lines
- A testable extension would be to make the mutation rate itself a function of local drug concentration and proliferation state rather than a fixed per-division constant, and to ask whether the high-proliferation/high-resistance correlation strengthens or weakens under that rule.
- If the feedback loop is general, then any therapy that decouples division from mutation, such as drugs that slow cycling without killing, should suppress the emergence of dual-trait dominance; this could be checked in agent-based models before clinical translation.
- The perivascular sanctuary prediction could be tested against spatial transcriptomics or multiplex imaging of EGFR-TKI-resistant lung tumours: resistant and highly proliferative clones should colocalise near vessels, whereas the model would be undermined if they are uniformly distributed.
Editorial analysis
A structured set of objections, weighed in public.
Referee Report
Summary. The paper proposes a hybrid PDE–agent-based model of tumour-induced angiogenesis and drug resistance, coupling reaction–diffusion equations for TAF, drug, and oxygen with agent-based tumour and endothelial cells, including stochastic branching, anastomosis, and a consecutive random mutation algorithm. The numerical study reports that pre-existing resistant cells create a perivascular sanctuary that sustains the tumour under continuous low-dose treatment; that spontaneous mutation at higher rates confers a survival advantage; that high proliferation and high resistance traits appear to reinforce each other and lead to dominance of cells carrying both traits; and that these findings explain conflicting experimental observations on the T790M EGFR mutation in NSCLC. The paper also compares continuous versus pulsed drug-delivery strategies.
Significance. If the reported findings are robust, the model would be a valuable in silico platform for studying how angiogenesis and the tumour microenvironment shape both pre-existing and acquired drug resistance, and it could motivate testable hypotheses about perivascular sanctuary sites and the co-selection of proliferation and resistance traits. The model has several strengths: it integrates a well-established angiogenesis framework (Anderson–Chaplain) with stochastic agent dynamics; it calibrates vascularization time to the 14-day experimental benchmark in Section 3.1; it includes a detailed parameter table and a flowchart in Appendix C; and Section 5(iv) explicitly acknowledges a real limitation (vessel-wall permeability). However, the central qualitative claims currently rest on single stochastic trajectories with hand-tuned parameters, and the clinical interpretation is analogical; unless these gaps are closed, the paper can only support a weaker, hypothesis-generation claim.
major comments (4)
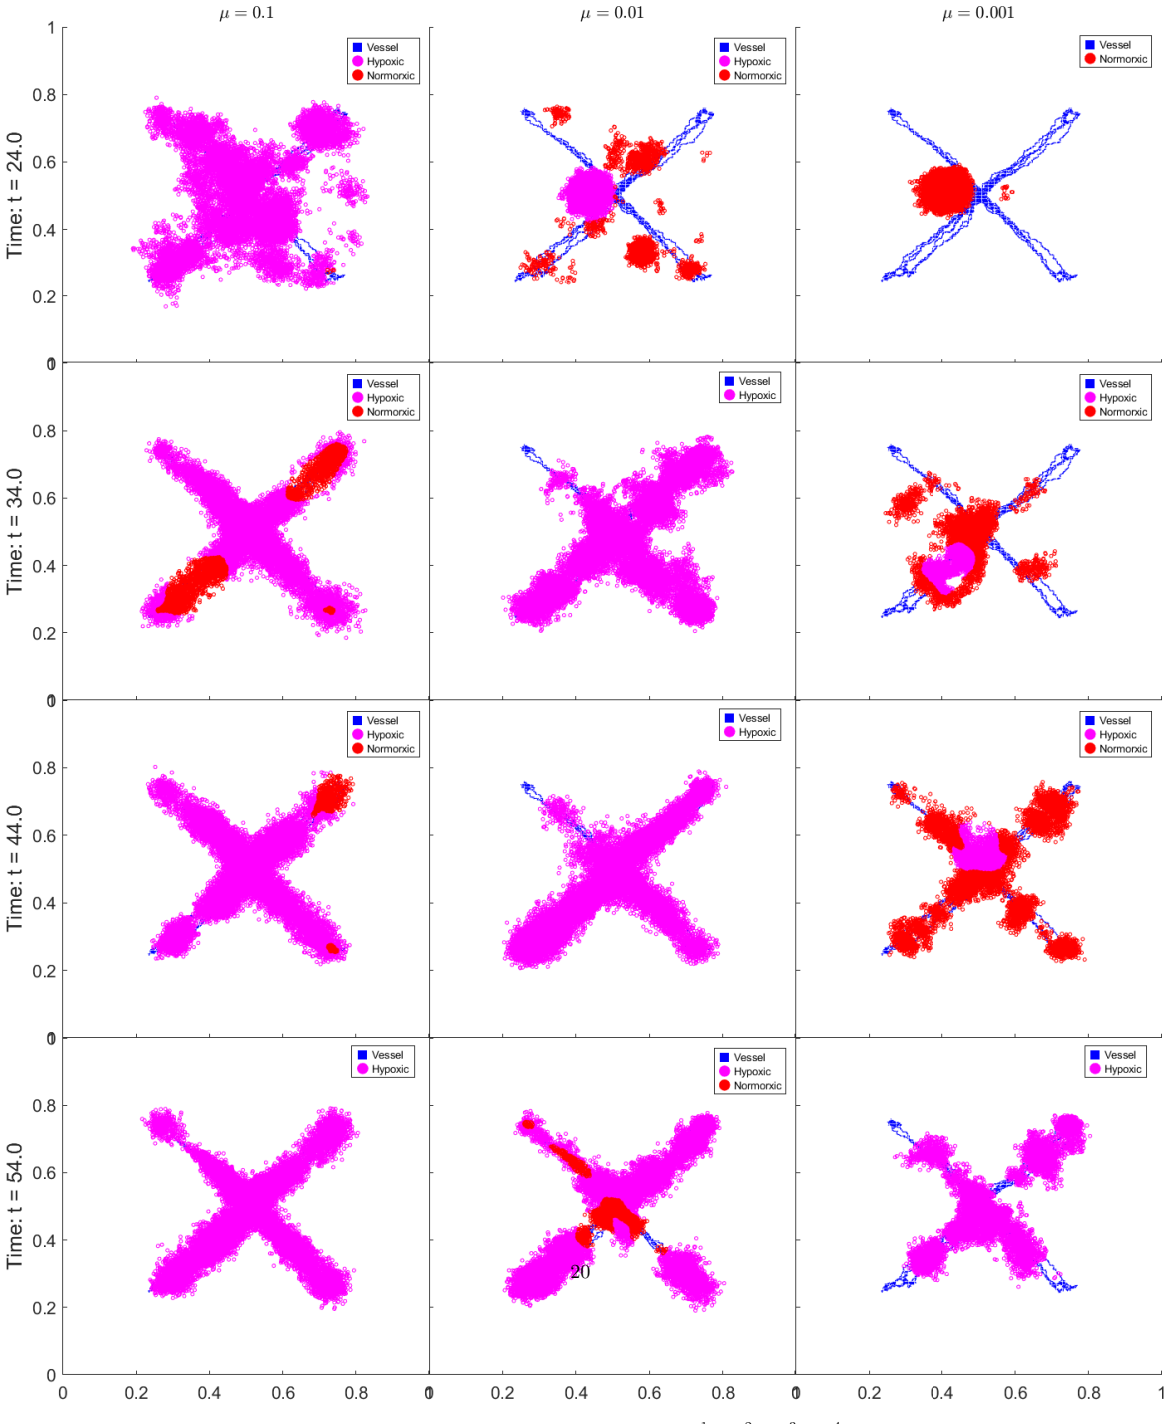
- [Section 3.6 (Figs. 7, 9–12)] The central qualitative claim—that high proliferation rate and high resistance are mutually reinforcing and culminate in the simultaneous emergence and final dominance of cells carrying both traits—is supported only by individual simulation runs. The model is heavily stochastic (Brownian motion for cell positions, U[0.7,1.7] mutation multipliers, random daughter-cell placement, Poisson branching, random anastomosis choices), yet no ensemble statistics, confidence intervals, or even the number of repeated runs are reported. Section 3.1 mentions 'extensive simulations (results not shown)' without giving the ensemble size or a summary statistic. Because the four-mutation-rate comparison and the spatial-overlap claims in Figures 7–12 could arise from a single atypical trajectory, the robustness of the central claim is unverified. Please report means and variances over repeated runs, and quantify the spatial and temporal co-occurrence of high-proliferation and high-resistance cells.
- [Section 2.4 and Section 3.6(ii)] The proposed 'mutually reinforcing relationship' is partly built into the model by construction. Section 2.4 states that mutations occur 'when tumour cells divide,' and Section 3.6(ii) then reasons that higher proliferation rates, at fixed mutation rates, lead to promoted mutation frequencies. Since mutation events are tied to division, a higher proliferation rate necessarily produces more mutation opportunities per unit time; the resulting positive feedback between proliferation and resistance is therefore a consequence of the mutation algorithm rather than an emergent property of the tumour–microenvironment interactions. To support the claim as an emergent finding, the authors should either decouple the per-unit-time mutation rate from the division rate (for example, by allowing division-independent mutational events and repeating the analysis) or explicitly state that the reinforcement is an assumption of the model.
- [Section 3.7, Table 1] Table 1 is missing the reported success/failure outcomes. The text states that check/cross symbols 'indicate the success and failure of treatment,' but the corresponding table entries are blank for all seven strategies and for both pre-existing and spontaneous resistance. As a result, the paper's comparative claim about treatment strategies—and any inference about optimal dosing—is not supported as printed. Please supply the complete table with the outcome of each strategy, and indicate the criterion used to define success (for example, extinction of the tumour within a specified time horizon). Ideally, report outcomes over an ensemble of stochastic runs rather than a single trajectory.
- [Section 4 and Appendix B] The claimed explanation of the T790M paradox is analogical rather than mechanistic. The model tracks generic 'proliferation rate' and 'death threshold' traits and contains no EGFR allele, no TKI, and no T790M; the link from the simulated co-dominance of fast-growing, drug-resistant cells to the conflicting clinical observations of T790M growth disadvantage versus advantage is asserted rather than derived. At minimum, the manuscript should change 'explain' to 'is consistent with a generic mechanism and predicts ...' and specify a clinical or experimental prediction that would distinguish the hypothesis. In addition, the parameter-reporting inconsistencies in Appendix B prevent reproduction of the calibration: the text states that eta is adjusted to 10^3 and that Do=0.35 and rho_o=0.57 are used, but Table B.2 lists eta=6.2669e3, Do=0.64, rho_o=34.3881, and the cell-cycle time is described in the text as 8 hours while Table B.2 gives M_age ~ U[0.9,1.1] days with non-dimensional values 9/16–11/16. These values should be reconciled, and a sensitivity analysis over k=5, S_o=3.5, and the mutation multiplier interval U[0.7,1.7] should be reported.
minor comments (6)
- [Section 2.1] The text announces random diffusion, chemotaxis, and haptotaxis, but the flux J_n contains only diffusion and chemotaxis; haptotaxis is never defined.
- [Section 2.1 / Appendix A / Section 6] The PDE discretization is described inconsistently: Section 2.1 says forward Euler finite differences are used for all PDEs, while Appendix A.2 introduces an ADI scheme and Section 6 says the ADI method was used; Appendix A.1 only details the endothelial-cell equation. Please clarify which scheme was used for each equation.
- [Appendix C] The flowchart refers to updating 'Fibronection' concentrations, but no fibronectin field appears in the model equations; the flowchart should be aligned with the model.
- [Section 2.4 / Section 3.6] The mutation intensity mu is called a Poisson intensity per time step, but Section 3.6 cites the biological rate per replication as 10^-6–10^-2 and then uses mu up to 10^-1; the relationship between the per-replication rate and the time-step intensity should be stated, and the use of values above the cited biological range should be justified.
- [Section 3.7] The term 'optimal' in the Introduction and Section 3.7 is not supported because only seven fixed strategies are compared and no objective function is defined; consider replacing 'optimal' with 'comparative' unless a formal optimization is performed.
- [Introduction and Section 3.1] There is a typo in the Introduction ('formulalted' in the sentence about Pillay et al.) and inconsistent spelling of 'brush border' ('brush board' in Section 3.1); please proofread.
Circularity Check
Partial circularity: the mutual-reinforcement and synchronized co-emergence claims restate the per-division simultaneous-trait mutation rule, and the 14.08-day vascularization and carrying-capacity results are calibration targets reported as findings.
-
self definitional
[Section 2.4 (Mutation); Section 3.6 (Spontaneous Mutation, item (ii), Figures 9-12)]
"When tumour cells divide, daughter cells may acquire mutations... higher proliferation rates at fixed mutation rates lead to promoted mutation frequencies, thereby boosting the likelihood of producing cells that are more resistant to treatment. As a result, high proliferation rates and high resistance traits reinforce each other... the appearance and prevalence of cells with increased proliferation rates appear to be in sync with those exhibiting enhanced resistance traits."
The paper presents the proliferation-to-resistance channel as a finding, but the channel is the model's per-division mutation rule restated: mutations occur only 'when tumour cells divide' (Section 2.4), so a faster-proliferating lineage necessarily draws more mutation multipliers, and resistance is defined as a higher death threshold that mutations can raise. The claimed synchronized appearance of high-proliferation and high-resistance cells is likewise forced by construction: one mutation event simultaneously multiplies death threshold, oxygen consumption, and proliferation rate in the same cell, so any cell becoming resistant changes its proliferation rate at the same instant.
-
fitted input called prediction
[Section 3.1 (Initial TAF Field)]
"We must choose the value of k so that our vascular growth is in agreement with some existing experimental data. In [12], 14 days is a typical value in many experiments for the time required to complete vascularization... After trial and error, we find that the appropriate value for k is k = 5, under which the time to complete vascularization in our simulation is 14.08 days, and the final pattern of vessels in Figure 1 is qualitatively similar to the result in Fig. 11 of [15]."
k = 5 is the fit: it is chosen 'after trial and error' specifically so that the simulated vascularization time matches the 14-day experimental value quoted from [12]. Reporting '14.08 days' as the model's output is then reporting the calibration target back as agreement with data; the agreement is forced by construction and carries no independent predictive content at that point of the argument. The qualitative brush-border comparison to [15] is likewise a post hoc pattern match within the fitted regime.
1 more flagged steps
-
fitted input called prediction
[Appendix B (Parameter Estimation); Section 3.3 (Vascularization)]
"When So is small, that is, So = 3, the tumour will experience hypoxia and cease to expand. In contrast, a high supply rate, that is, So = 5, facilitates enough access of tumour cells to oxygen, causing exponential tumour growth. We choose an intermediate value So = 3.5, which triggers the tumour to expand and eventually reach a new carrying capacity... the tumour population reaches a new carrying capacity... this is the mature stage of tumour development."
The carrying-capacity behaviour presented in Section 3.3 as a model result is the exact criterion used in Appendix B to select So: So = 3.5 is chosen because it 'triggers the tumour to expand and eventually reach a new carrying capacity.' The finding that the population reaches a 'mature stage' carrying capacity whose steady state is set by the supply rate is therefore the fitting target restated as an emergent outcome. The parameter table does label So 'calibrated,' but the narrative in Section 3.3 presents the resulting behaviour as a discovery rather than as the imposed selection criterion.
full rationale
I examined all six circularity patterns. There are no author self-citations in the reference list (references [1]-[46] are external), so the self-citation, uniqueness-import, and ansatz-smuggling patterns do not apply; the passive/active adaptation distinction is a classification of two mechanisms already encoded, not a renamed empirical result presented as new. Three constructive reductions were found. First, the central claim of mutual reinforcement between high proliferation and high resistance rests on the assertion that higher proliferation leads to higher mutation frequency, which is exactly the Section 2.4 rule that mutations occur upon division; and the synchronized appearance of the two traits is forced because each mutation event updates all three trait values in the same cell. Second, the vascularization time of 14.08 days is the calibration target for k = 5, then reported as agreement with experiment. Third, reaching a carrying capacity is the calibration target for So = 3.5, then reported as the model's mature-stage behaviour. The final dominance of dual-trait cells and the resistance-versus-mutation-rate ordering retain genuine emergent content from the agent-based dynamics (drug selection, hypoxia, crowding), and no parameter is fitted to the resistance conclusions themselves, so the paper is not wholly circular. The absence of ensemble statistics and sensitivity analysis is a robustness concern, not circularity, and is excluded per the review rules. Overall: partial circularity, score 6.
Assumptions & free parameters
free parameters (4)
- TAF source amplitude k =
5
- Oxygen supply rate So =
3.5
- TAF production rate eta (adjusted) =
1000
- Mutation multiplier interval =
U[0.7, 1.7] with clipping [0.5x, 4x]
assumptions (4)
- domain assumption The Anderson-Chaplain hybrid discrete-continuous framework is a valid description of tumor angiogenesis.
- ad hoc to paper The consecutive random mutation algorithm with U[0.7,1.7] multipliers approximates biological mutation.
- domain assumption The T790M mutation is representable by generic increases in death threshold, proliferation and oxygen consumption traits.
- ad hoc to paper The calibrated parameters (k, So, eta) can be varied without changing the qualitative conclusions.
Cite this review
Pith. "Pith review of A hybrid PDE-ABM model for angiogenesis and tumour microenvironment with application to resistance in cancer treatment." pith.science (2026). https://pith.science/paper/QZCSNGXX
@misc{pith2026250522580,
  author       = {Pith},
  title        = {Pith review of: A hybrid PDE-ABM model for angiogenesis and tumour microenvironment with application to resistance in cancer treatment},
  year         = {2026},
  howpublished = {\url{https://pith.science/paper/QZCSNGXX}},
  note         = {Machine review of arXiv:2505.22580}
}
read the original abstract
The main obstacle to effective cancer treatment is the development of drug resistance, which can be divided into two categories: spontaneous and acquired drug resistance. Non-small cell lung cancer (NSCLC) is the main cause of cancer-related deaths worldwide. A subset of lung cancer, adenocarcinomas, is characterised by mutations in the epidermal growth factor receptor (EGFR) gene. Treatment of EGFR-mutated lung adenocarcinomas has become less effective over time due to drug resistance development, which is associated with a second mutation in the EGFR gene. An important factor in the development of cancer is angiogenesis, which is the formation of blood vessels from the existing vasculature. These newly formed blood vessels provide oxygen and nutrients to tumour cells to maintain tumour growth and proliferation. We applied a hybrid discrete-continuous (HDC) model to capture the dynamic vasculature in the tumour microenvironment (TME). In the case of pre-existing resistance, the formation of angiogenic networks creates a microenvironment that supports tumour survival and enhances drug resistance. In the case of spontaneous mutation-induced resistance, earlier and more frequent mutations confer a greater survival advantage to the tumour population. There is also a mutually reinforcing relationship between a high proliferation rate and high resistance characteristics. These findings explain two conflicting experimental results about the second mutation in NSCLC.
Figures


Figures from the paper (9 more)




Forward citations
Cited by 2 Pith papers
-
Reflected Optimal Stopping with a Max-Type Payoff: Measure-Valued Stopping Gains and Killed Resolvent Representation
For reflected diffusion optimal stopping with G=x1∨αx2, the gain Γ is a signed measure with singular diagonal part −(n⊤an)/(2√(1+α²))σΔ, and V=G−R_C^r Γ (killed at first entry to the stopping set).
-
Multiplier Sensitivity in Isoperimetric Optimal Control
Under stated convexity and attainability conditions, the isoperimetric Pontryagin multiplier is the negative supergradient of the constrained value function, and this sensitivity can survive when the modified control-...
Reference graph
Works this paper leans on
-
[22]
Multiscale modeling of drug resistance in glioblastoma with gene mutations and angiogenesis
Heng Yang, Haofeng Lin, and Xiaoqiang Sun. Multiscale modeling of drug resistance in glioblastoma with gene mutations and angiogenesis. Computational and Structural Biotechnology Journal , 21:5285–5295, 2023
work page 2023
-
[1]
Environment-mediated drug resistance: a major contributor to minimal residual disease
Mark B Meads, Robert A Gatenby, and William S Dalton. Environment-mediated drug resistance: a major contributor to minimal residual disease. Nature reviews cancer, 9(9):665–674, 2009
work page 2009
-
[2]
The mathematics of cancer: integrating quantitative models
Philipp M Altrock, Lin L Liu, and Franziska Michor. The mathematics of cancer: integrating quantitative models. Nature Reviews Cancer, 15(12):730–745, 2015
work page 2015
-
[3]
Anyue Yin, Dirk Jan AR Moes, Johan GC van Hasselt, Jesse J Swen, and Henk-Jan Guchelaar. A review of mathemat- ical models for tumor dynamics and treatment resistance evolution of solid tumors. CPT: pharmacometrics & systems pharmacology, 8(10):720–737, 2019
work page 2019
-
[4]
Integrating models to quantify environment- mediated drug resistance
Noemi Picco, Erik Sahai, Philip K Maini, and Alexander RA Anderson. Integrating models to quantify environment- mediated drug resistance. Cancer research, 77(19):5409–5418, 2017
work page 2017
-
[5]
James M Greene, Jana L Gevertz, and Eduardo D Sontag. Mathematical approach to differentiate spontaneous and induced evolution to drug resistance during cancer treatment. JCO clinical cancer informatics , 3:1–20, 2019
work page 2019
-
[6]
Optimization of dosing for egfr-mutant non–small cell lung cancer with evolutionary cancer modeling
Juliann Chmielecki, Jasmine Foo, Geoffrey R Oxnard, Katherine Hutchinson, Kadoaki Ohashi, Romel Somwar, Lu Wang, Katherine R Amato, Maria Arcila, Martin L Sos, et al. Optimization of dosing for egfr-mutant non–small cell lung cancer with evolutionary cancer modeling. Science translational medicine, 3(90):90ra59–90ra59, 2011
work page 2011
-
[7]
Fr´ ed´ erique Billy, Benjamin Ribba, Olivier Saut, H´ el` ene Morre-Trouilhet, Thierry Colin, Didier Bresch, Jean-Pierre Boissel, Emmanuel Grenier, and Jean-Pierre Flandrois. A pharmacologically based multiscale mathematical model of angiogenesis and its use in investigating the efficacy of a new cancer treatment strategy. Journal of theoretical biology,...
work page 2009
Show all 46 references
-
[8]
A mathematical model to study the effects of drug resistance and vasculature on the response of solid tumors to chemotherapy
Trachette L Jackson and Helen M Byrne. A mathematical model to study the effects of drug resistance and vasculature on the response of solid tumors to chemotherapy. Mathematical biosciences, 164(1):17–38, 2000
2000
-
[9]
Angiogenesis and chemotherapy resistance: Optimizing chemotherapy scheduling using mathematical modeling
Mariusz Bodzioch, Piotr Bajger, and Urszula Fory´ s. Angiogenesis and chemotherapy resistance: Optimizing chemotherapy scheduling using mathematical modeling. Journal of Cancer Research and Clinical Oncology , 147(8):2281–2299, 2021
2021
-
[10]
Mathematical modeling of therapy-induced cancer drug resistance: connecting cancer mechanisms to population survival rates
Xiaoqiang Sun, Jiguang Bao, and Yongzhao Shao. Mathematical modeling of therapy-induced cancer drug resistance: connecting cancer mechanisms to population survival rates. Scientific reports, 6(1):22498, 2016
2016
-
[11]
Mesoscopic and continuum modelling of angiogenesis
Fabian Spill, Pilar Guerrero, Tomas Alarcon, Philip K Maini, and Helen M Byrne. Mesoscopic and continuum modelling of angiogenesis. Journal of mathematical biology , 70:485–532, 2015
2015
-
[12]
A mathematical model of tumour-induced capillary growth
D Balding and DLS McElwain. A mathematical model of tumour-induced capillary growth. Journal of theoretical biology, 114(1):53–73, 1985
1985
-
[13]
Mathematical models for tumour angiogenesis: numerical simulations and nonlinear wave solutions
Helen M Byrne and Mark AJ Chaplain. Mathematical models for tumour angiogenesis: numerical simulations and nonlinear wave solutions. Bulletin of mathematical biology , 57(3):461–486, 1995
1995
-
[14]
Modeling angiogenesis: A discrete to continuum description
Samara Pillay, Helen M Byrne, and Philip K Maini. Modeling angiogenesis: A discrete to continuum description. Physical Review E, 95(1):012410, 2017
2017
-
[15]
Continuous and discrete mathematical models of tumor-induced angio- genesis
Alexander RA Anderson and Mark AJ Chaplain. Continuous and discrete mathematical models of tumor-induced angio- genesis. Bulletin of mathematical biology , 60(5):857–899, 1998
1998
-
[16]
The mathematical modeling of cancer growth and angiogenesis by an individual based interacting system
Franco Flandoli, Marta Leocata, and Cristiano Ricci. The mathematical modeling of cancer growth and angiogenesis by an individual based interacting system. Journal of Theoretical Biology , 562:111432, 2023
2023
-
[17]
Agent-based modeling in molecular systems biology
Mohammad Soheilypour and Mohammad RK Mofrad. Agent-based modeling in molecular systems biology. BioEssays, 40(7):1800020, 2018
2018
-
[18]
Simulating cancer growth with multiscale agent-based modeling
Zhihui Wang, Joseph D Butner, Romica Kerketta, Vittorio Cristini, and Thomas S Deisboeck. Simulating cancer growth with multiscale agent-based modeling. In Seminars in cancer biology , volume 30, pages 70–78. Elsevier, 2015
2015
-
[19]
A hybrid multiscale model of solid tumour growth and invasion: evolution and the microenvi- ronment
Alexander RA Anderson. A hybrid multiscale model of solid tumour growth and invasion: evolution and the microenvi- ronment. In Single-cell-based models in biology and medicine , pages 3–28. Springer, 2007
2007
-
[20]
Emergence of anti-cancer drug resistance: exploring the importance of the microenvironmental niche via a spatial model
Jana L Gevertz, Zahra Aminzare, Kerri-Ann Norton, Judith P´ erez-Vel´ azquez, Alexandria Volkening, and Katarzyna A Rejniak. Emergence of anti-cancer drug resistance: exploring the importance of the microenvironmental niche via a spatial model. In Applications of dynamical sys...
2015
-
[21]
The role of environmentally mediated drug resistance in facilitating the spatial distribution of residual disease
Noemi Picco, Amy Milne, Philip Maini, and Alexander Anderson. The role of environmentally mediated drug resistance in facilitating the spatial distribution of residual disease. 2024
2024
-
[23]
Molecular mechanisms and clinical applications of angiogenesis
Peter Carmeliet and Rakesh K Jain. Molecular mechanisms and clinical applications of angiogenesis. Nature, 473(7347):298–307, 2011
2011
-
[24]
Evolutionary dynamics: exploring the equations of life
Martin A Nowak. Evolutionary dynamics: exploring the equations of life . Harvard university press, 2006
2006
-
[25]
A quantitative measurement of the human somatic mutation rate
David J Araten, David W Golde, Rong H Zhang, Howard T Thaler, Lucia Gargiulo, Rosario Notaro, and Lucio Luzzatto. A quantitative measurement of the human somatic mutation rate. Cancer research, 65(18):8111–8117, 2005
2005
-
[26]
Oncogenic activity of epidermal growth factor receptor kinase mutant alleles is enhanced by the t790m drug resistance mutation
Nadia Godin-Heymann, Ianthe Bryant, Miguel N Rivera, Lindsey Ulkus, Daphne W Bell, David J Riese, Jeffrey Settleman, and Daniel A Haber. Oncogenic activity of epidermal growth factor receptor kinase mutant alleles is enhanced by the t790m drug resistance mutation. Cancer resea...
2007
-
[27]
Epidermal growth factor receptor mutants from human lung cancers exhibit enhanced catalytic activity and increased sensitivity to gefitinib
Roseann Mulloy, Audrey Ferrand, Youngjoo Kim, Raffaella Sordella, Daphne W Bell, Daniel A Haber, Karen S Anderson, and Jeffrey Settleman. Epidermal growth factor receptor mutants from human lung cancers exhibit enhanced catalytic activity and increased sensitivity to gefitinib...
2007
-
[28]
Tumor angiogenesis and vascular patterning: a mathematical model
Rui DM Travasso, Eugenia Corvera Poir´ e, Mario Castro, Juan Carlos Rodrguez-Manzaneque, and Aurora Hern´ andez- Machado. Tumor angiogenesis and vascular patterning: a mathematical model. PloS one , 6(5):e19989, 2011
2011
-
[29]
Met amplification occurs with or without t790m mutations in egfr mutant lung tumors with acquired resistance to gefitinib or erlotinib
James Bean, Cameron Brennan, Jin-Yuan Shih, Gregory Riely, Agnes Viale, Lu Wang, Dhananjay Chitale, Noriko Motoi, 32 Janos Szoke, Stephen Broderick, et al. Met amplification occurs with or without t790m mutations in egfr mutant lung tumors with acquired resistance to gefitinib...
2007
-
[30]
Met inhibitors for targeted therapy of egfr tki-resistant lung cancer
Qiming Wang, Sen Yang, Kai Wang, and Shi-Yong Sun. Met inhibitors for targeted therapy of egfr tki-resistant lung cancer. Journal of hematology & oncology , 12:1–11, 2019
2019
-
[31]
Andrew Mckenzie, Aaron Cranston, Phil Mallinder, Nektaria Papadopoulou, Simon Jiang, Kerry Moakes, Yinfei Yin, David Onion, Anna Grabowska, Martin Page, et al. In vivo generation of egfr-tki resistance in a patient-derived xenograft (pdx) with an activating egfr mutation (l858...
2013
-
[32]
Effect of hydraulic conductivity and permeability on drug distribution, an investigation based on a part of a real tissue
Masod Sadipour, Mohammad Masoud Momeni, and Majid Soltani. Effect of hydraulic conductivity and permeability on drug distribution, an investigation based on a part of a real tissue. arXiv preprint arXiv:2304.06273 , 2023
2023 arXiv
-
[33]
Interstitial fluid flow and drug delivery in vascularized tumors: a computational model
Michael Welter and Heiko Rieger. Interstitial fluid flow and drug delivery in vascularized tumors: a computational model. PloS one , 8(8):e70395, 2013
2013
-
[34]
Real-time visualization and quantitation of vascular permeability in vivo: implications for drug delivery
Desmond BS Pink, Wendy Schulte, Missag H Parseghian, Andries Zijlstra, and John D Lewis. Real-time visualization and quantitation of vascular permeability in vivo: implications for drug delivery. PloS one , 7(3):e33760, 2012
2012
-
[35]
Numerical solution of partial differential equations: an introduction
Keith W Morton and David Francis Mayers. Numerical solution of partial differential equations: an introduction . Cam- bridge university press, 2005
2005
-
[36]
The three steps to cancer: a new concept of cancerigenesis
Meyer M Melicow. The three steps to cancer: a new concept of cancerigenesis. Journal of Theoretical Biology, 94(2):471– 511, 1982
1982
-
[37]
Differential binding of vegf isoforms to vegf receptor 2 in the presence of neuropilin-1: a computational model
Feilim Mac Gabhann and Aleksander S Popel. Differential binding of vegf isoforms to vegf receptor 2 in the presence of neuropilin-1: a computational model. American Journal of Physiology-Heart and Circulatory Physiology , 288(6):H2851– H2860, 2005
2005
-
[38]
A simple mechanistic model of sprout spacing in tumour-associated angiogenesis
B Addison-Smith, DLS McElwain, and PK Maini. A simple mechanistic model of sprout spacing in tumour-associated angiogenesis. Journal of Theoretical Biology , 250(1):1–15, 2008
2008
-
[39]
A spatial model of tumor-host interaction: application of chemotherapy
Peter Hinow, Philip Gerlee, Lisa J McCawley, Vito Quaranta, Madalina Ciobanu, Shizhen Wang, Jason M Graham, Bruce P Ayati, Jonathan Claridge, Kristin R Swanson, et al. A spatial model of tumor-host interaction: application of chemotherapy. Mathematical biosciences and engineer...
2009
-
[40]
Oxygen consumption rate of tissue measured by a micropolarographic method
GH Takahashi, I Fatt, and TK Goldstick. Oxygen consumption rate of tissue measured by a micropolarographic method. The Journal of general physiology , 50(2):317, 1966
1966
-
[41]
Heterogeneous response of individual multicellular tumour spheroids to immunotoxins and ricin toxin
Roberto Chignola, R Foroni, A Franceschi, M Pasti, C Candiani, C Anselmi, Giulio Fracasso, Giuseppe Tridente, and Marco Colombatti. Heterogeneous response of individual multicellular tumour spheroids to immunotoxins and ricin toxin. British journal of cancer , 72(3):607–614, 1995
1995
-
[42]
The exponential-gompertzian tumor growth model: Data from six tumor cell lines in vitro and in vivo
Romano Demicheli, Graziella Pratesi, and Roberto Foroni. The exponential-gompertzian tumor growth model: Data from six tumor cell lines in vitro and in vivo. estimate of the transition point from exponential to gompertzian growth and potential cinical implications. Tumori Jour...
1991
-
[43]
Response to chemotherapy of emt6 spheroids as measured by growth delay and cell survival
PR Twentyman. Response to chemotherapy of emt6 spheroids as measured by growth delay and cell survival. British journal of cancer , 42(2):297–304, 1980
1980
-
[44]
Cell kinetics of human squamous cell carcinomas in the oral cavity
Junko SAKUMA. Cell kinetics of human squamous cell carcinomas in the oral cavity. The Bulletin of Tokyo Medical and Dental University , 27(1):43–54, 1980
1980
-
[45]
Measurement of cell kinetics in human tumours in vivo using bromodeoxyuridine incorporation and flow cytometry
GD Wilson, NJ McNally, S Dische, MI Saunders, C Des Rochers, AA Lewis, and MH Bennett. Measurement of cell kinetics in human tumours in vivo using bromodeoxyuridine incorporation and flow cytometry. British journal of cancer , 58(4):423–431, 1988
1988
-
[46]
Estimating the growth kinetics of experimental tumors from as few as two determinations of tumor size: implications for clinical oncology
Roberto Chignola and Roberto Israel Foroni. Estimating the growth kinetics of experimental tumors from as few as two determinations of tumor size: implications for clinical oncology. IEEE transactions on biomedical engineering , 52(5):808– 815, 2005. 33
2005
Reviewed August 7, 2026 · model on record in the stance chip above.
Discussion (0). Sign in to comment.