REVIEW 4 major objections 5 minor 29 references
Detection of Endangered Deer Species Using UAV Imagery: A Comparative Study Between Efficient Deep Learning Approaches
T0 review · 4 major / 5 minor · reviewed 2026-08-07 · deepseek-v4-flash
Pith's one-line read This paper claims that adding an instance segmentation head to a small YOLOv11 detector improves detection of small, occluded marsh deer in UAV imagery compared with detection-only YOLOv11 and the larger RT-DETR-l.
desk verdict The dataset is the real contribution; the superiority claim for YOLOv11n-seg is not yet supported because the test set is unspecified and the 54 'found' deer may contaminate the labels. read the letter →
The pith
A machine-rendered reading of the paper's core claim, the machinery that carries it, and where it could break.
The reading
What carries the argument
The mechanism that carries the argument is the instance segmentation head added to the YOLOv11 nano backbone, making the YOLOv11n-seg variant. Following the YOLACT design, this head predicts prototype masks shared across detections together with per-instance mask coefficients, and the final mask for each object is a linear combination of prototypes weighted by those coefficients, so each animal must be localized by its silhouette rather than only by a box. Training on images resized to 1920×1920 keeps the few-pixel deer specimens recognizable, and the paper argues that having to predict exact boundaries is what lets the model distinguish overlapping animals that detection-only heads merge. The comparison is completed by per-model confidence thresholds (0.164 for YOLOv11n-seg, 0.174 for YOLOv11n-det, 0.255 for RT-DETR-l) tuned on the validation set, with mAP@50 as the headline metric.
What would settle it
Re-run the three models on a documented test set built from transects held out before any labeling, with the 54 expert-confirmed ‘new’ deer either excluded from all training data or explicitly marked as a separate evaluation, and compare per-image counting accuracy on images containing two deer that overlap. If YOLOv11n-seg’s edge over YOLOv11n-det disappears under that clean split, the claimed advantage is an artifact of the unspecified test set or of the models having seen the newly discovered deer during training.
Extended reading notes
Core claim
The central claim is that fine-grained segmentation masks are more than a decorative output: as a training signal, they make the detector itself better. The authors report that YOLOv11n-seg, the smallest of the three models, achieves the best balance of precision, recall, and F1-score at its tuned confidence threshold, and is the only model that reliably separates cases where two animals appear close together in one image. They conclude that “the model YOLOv11n-seg is superior, showing greater potential in situations where there is overlapping specimens since it takes advantage of training considering the segmentation masks.” RT-DETR-l, the transformer-based rival, was competitive on accuracy despite having no segmentation head, but its inference time grew to 3.1–3.2 seconds per image at 1920×1920, erasing its real-time advantage. The paper also reports that the models found 54 marsh deer that expert human labelers had missed, an increase of over 23% in the total count, and presents the mask-annotated image set as a resource it believes is unique among wildlife monitoring datasets.
Load-bearing premise
The load-bearing premise is that the test set used for the final metrics is a fair, independent sample of the flight imagery; the paper describes training and validation sets in detail but never defines the composition, size, or overlap of the test set, so the reported superiority of YOLOv11n-seg could in principle rest on an unverifiable split of the data.
Editorial extensions
If this is right
- Marsh deer census from drone imagery becomes more reliable with a segmentation-augmented detector, since the only model that told apart two deer in close proximity was the one trained on masks.
- RT-DETR-l cannot keep its real-time promise at 1920×1920 input resolution, so its fast convergence does not translate into practical large-scale surveys at the resolutions needed for small specimens.
- The combined models raised the detected deer count by over 23% compared with the expert census, showing that AI-assisted review can catch animals human labelers missed.
- Collecting precise segmentation masks is worth the annotation effort because the same masks improve the detection task itself, not just the visual output of the model.
Reading between the lines
- If the segmentation head acts as a general regularizer for small targets, the same mask-equipped YOLO recipe may transfer to other aerial wildlife census species with only a modest labeling investment; this is a testable extrapolation the paper does not make.
- The 23% increase from model-found deer, combined with the re-labeling workflow described in Section III-A, leaves open whether those newly found deer were folded into training data, which would create a feedback loop that flatters the final reported counts.
- A cheaper route to the same overlapping-specimen capability might be to keep a detection-only model but add an auxiliary ‘two animals here’ loss; the paper’s data alone cannot distinguish mask supervision from silhouette supervision more generally.
- For operational surveys, the relevant comparison is counting error per transect at a fixed budget of human verification time rather than mAP; the paper reports counting matrices for up to two deer per image that begin to answer this, but does not compute a population-density estimate from the corrected counts.
Editorial analysis
A structured set of objections, weighed in public.
Referee Report
Summary. This paper compares three object detectors—YOLOv11n-det, YOLOv11n-seg (with an instance segmentation head), and RT-DETR-l—for detecting marsh deer in high-resolution (1920x1920) UAV imagery from the Pantano Project in the Paraná Delta. The authors train on a dataset that includes fine-grained segmentation masks, a contribution they claim is novel for wildlife monitoring, and they report that YOLOv11n-seg achieves superior detection performance, particularly for overlapping specimens. The paper also reports that the network discovered 54 deer missed by initial human labeling, increasing the count from 231 to 285. The central conclusion is that YOLOv11n-seg is superior because the segmentation masks help in overlapping-specimen scenarios.
Significance. If the central claim holds, the paper would provide a useful practical result for UAV-based wildlife monitoring: that adding an instance segmentation head to a small YOLO model improves detection of small, occluded animals, and that the resulting model can assist human labelers in finding missed individuals. The dataset with precise segmentation masks is a potentially valuable resource for the community, and the comparison of a transformer-based detector (RT-DETR) with a lightweight fully convolutional detector at large input sizes is of independent interest. However, the significance is substantially tempered by evaluation weaknesses: the test set is not defined, the evaluation may be contaminated by model-discovered deer in the ground truth, and the headline advantage for overlapping specimens rests on a single counting-matrix cell without uncertainty quantification. The paper does not provide code or data availability, which limits reproducibility.
major comments (4)
- [Sections III-B-3 and IV-A] The test set is never defined. Section III-B-3 specifies only the training set (160 deer images, plus other classes) and a validation set (52 deer images, etc.), but Section IV-A reports metrics on a "test set" whose composition, size, and relationship to the training/validation splits are not given. Without a clear, independent test set, the reported superiority of YOLOv11n-seg over the other models cannot be verified or reproduced.
- [Sections III-A and IV-C] The "finding of unlabeled deer" introduces a circularity risk. The manuscript states that the network found 54 deer that were later confirmed by experts and that the final count rose from 231 to 285, implying these model-proposed detections were added to the ground-truth labels. If any of these 54 deer appear in the test set used for evaluation—and the text does not rule this out—then the detector under test has contributed to its own ground truth, making the reported metrics partially circular. The authors must clearly state whether any of the 54 deer are present in the test-set labels and, if so, re-run the evaluation after removing them.
- [Section IV-B and Figures 9-11] The claim that YOLOv11n-seg is superior in overlapping-specimen cases rests on a single cell of the counting matrices: the bottom-right entries in Figures 9-11, where the model is said to correctly predict two animals in close proximity. No sample size is reported for that cell, no confidence interval is given, and there are no repeated training runs. With 262 deer images total and presumably few multi-deer images, the observed difference could easily be due to chance. Quantitative evidence—such as the number of images in that cell, a confidence interval, or a statistical test—is required to support this load-bearing claim.
- [Section IV-A] Each model is evaluated at its own validation-tuned confidence threshold (0.255 for RT-DETR-l, 0.174 for YOLOv11n-det, 0.164 for YOLOv11n-seg), and the reported precision, recall, F1-score, and mAP@50 values are single point estimates without error bars, variance, or repeated runs. Threshold tuning on the validation set followed by reporting on an undefined test set can inflate apparent differences between models. The comparison should include threshold-independent metrics (e.g., precision-recall curves) or variance estimates to establish that the observed differences are not artifacts of threshold selection or training stochasticity.
minor comments (5)
- [Throughout] There are frequent typographical spacing errors in "UA V" (e.g., in the abstract and introduction), and "sligthly" appears in the conclusions; these should be corrected.
- [Section II] The citation [22] is given as the source for DETR, but the reference listed is "An end-to-end transformer model for 3D object detection" by Misra et al., which is not the DETR paper. The correct reference is Carion et al., "End-to-End Object Detection with Transformers," ECCV 2020. This should be fixed, as the current citation does not support the text.
- [Section II] The phrase "achieved an mAP@10 of 0.950" in the discussion of the authors' previous work is likely a typo; typical metrics are mAP@50 or mAP@0.5. Please clarify the intended metric.
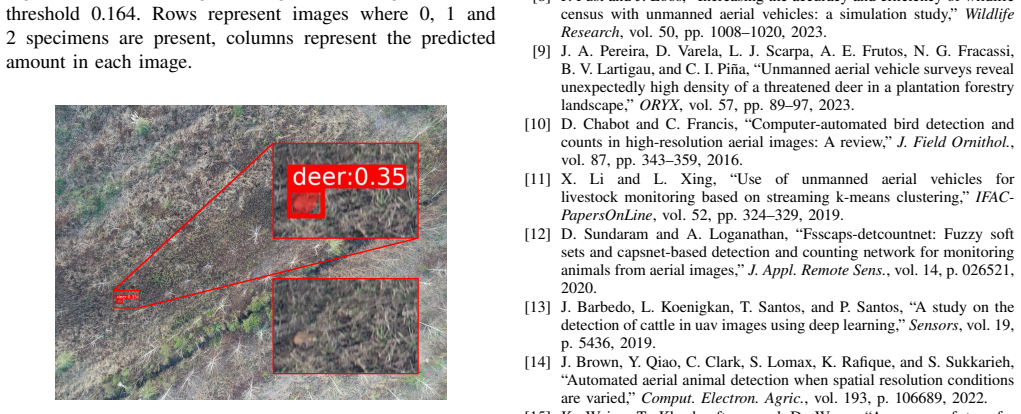
- [Figure 1] Figure 1 is described as showing a sample image from the test set, but since the test set is not defined anywhere in the paper, the figure caption is ambiguous. Once the test set is properly described, the caption should reference it explicitly.
- [General] The paper does not state whether the dataset, code, or trained models will be made publicly available. Given that one of the contributions is the dataset with segmentation masks, a data availability statement would strengthen the reproducibility of the work.
Circularity Check
Central model comparison is not circular, but the 'finding of 54 unlabeled deer' is self-referential: those detections were added to the ground-truth labels used to train and evaluate the same models, so the discovery claim is not independent evidence.
-
fitted input called prediction
[Section III-A (Dataset) and Section IV-C (Finding of Unlabeled Deer)]
"In addition, during the course of work, the network was able to find new unlabeled deer that were later confirmed by experts. The final count is of 285 marsh deer distributed between 262 images. Precise segmentation masks were created for those images. ... In total, the model identified 54 deer that were initially missed, representing an increase of over 23% in the total count."
The 54 deer that the model 'found' were confirmed by experts and then folded into the dataset (final count 285; segmentation masks created), and this same dataset is used to train and evaluate the models. The claimed discovery is therefore not an independent signal: the model's own detections became part of the ground truth against which its performance is measured, and the 23% increase is computed relative to a label set that already includes those detections. If any of these 54 deer appear in the test set used for the Section IV-A metrics, the evaluation is partially scored against labels generated by the system under test.
full rationale
The paper's main claim is a comparative evaluation: YOLOv11n-det, YOLOv11n-seg, and RT-DETR-l are trained on the same data and compared with standard detection metrics and counting matrices. That comparison is a genuine experimental manipulation, not a definitional equivalence: the segmentation head is an architectural difference, and its effect is measured, not assumed. No equations in the paper reduce to their own inputs, and no load-bearing argument relies on self-citation. The only circular element is the 'Finding of Unlabeled Deer' claim: deer initially missed by human labelers but detected by the network were confirmed by experts, added to the final count of 285, given segmentation masks, and then used for training and evaluation. Reporting those same 54 deer as a model achievement is circular in the sense that the model's outputs were incorporated into the ground truth it is later credited for discovering. This does not invalidate the central YOLOv11n-seg superiority argument, which is based on metrics and counting matrices, but it does contaminate the 'finding' result as an independent measure of model quality. Additionally, the paper defines training and validation sets in Section III-B-3 but never defines the test set used in Section IV-A, so whether any of the 54 model-discovered deer appear in the test labels cannot be ruled out. That is a correctness risk rather than a strict circularity, but it compounds the self-referential nature of the finding claim. Overall, the central derivation is independent, but one secondary prediction is partially circular, warranting a moderate score rather than a high one.
Assumptions & free parameters
free parameters (1)
- confidence thresholds per model =
0.255 (RT-DETR-l), 0.174 (YOLOv11n-det), 0.164 (YOLOv11n-seg)
assumptions (5)
- domain assumption Expert and volunteer manual review of the 39,798 photographs provides complete and accurate ground truth.
- domain assumption The unspecified test set is representative and independent of training and validation.
- domain assumption Optimal confidence thresholds selected on validation generalize to the test set.
- domain assumption YOLO and RT-DETR default hyperparameters from Ultralytics are appropriate and equivalent across models.
- domain assumption IoU 50% is a valid metric for small, imprecisely bounded objects.
Cite this review
Pith. "Pith review of Detection of Endangered Deer Species Using UAV Imagery: A Comparative Study Between Efficient Deep Learning Approaches." pith.science (2026). https://pith.science/paper/4DHSOFYE
@misc{pith2026250600154,
  author       = {Pith},
  title        = {Pith review of: Detection of Endangered Deer Species Using UAV Imagery: A Comparative Study Between Efficient Deep Learning Approaches},
  year         = {2026},
  howpublished = {\url{https://pith.science/paper/4DHSOFYE}},
  note         = {Machine review of arXiv:2506.00154}
}
read the original abstract
This study compares the performance of state-of-the-art neural networks including variants of the YOLOv11 and RT-DETR models for detecting marsh deer in UAV imagery, in scenarios where specimens occupy a very small portion of the image and are occluded by vegetation. We extend previous analysis adding precise segmentation masks for our datasets enabling a fine-grained training of a YOLO model with a segmentation head included. Experimental results show the effectiveness of incorporating the segmentation head achieving superior detection performance. This work contributes valuable insights for improving UAV-based wildlife monitoring and conservation strategies through scalable and accurate AI-driven detection systems.
Figures


Figures from the paper (8 more)


Reference graph
Works this paper leans on
-
[1]
S. T. Buckland, D. R. Anderson, K. P. Burnham, J. L. Laake, D. L. Borchers, and L. Thomas,Advanced distance sampling: estimating abundance of biological populations. OUP Oxford, 2004
work page 2004
-
[2]
G. Groom, M. Stjernholm, R. D. Nielsen, A. Fleetwood, and I. K. Petersen, “Remote sensing image data and automated analysis to describe marine bird distributions and abundances,”Ecological Informatics, vol. 14, pp. 2–8, 2013
work page 2013
-
[3]
“Proyecto Pantano,” 2022. [Online]. Available: https://www. proyectopantano.org/
work page 2022
-
[4]
You Only Look Once: Unified, Real-Time Object Detection ,
J. Redmon, S. Divvala, R. Girshick, and A. Farhadi, “ You Only Look Once: Unified, Real-Time Object Detection ,” in2016 IEEE Conference on Computer Vision and Pattern Recognition (CVPR). Los Alamitos, CA, USA: IEEE Computer Society, Jun. 2016, pp. 779–788. [Online]. Available: https://doi.ieeecomputersociety.org/10. 1109/CVPR.2016.91
work page 2016
-
[5]
G. Jocher, A. Chaurasia, and J. Qiu, “Ultralytics YOLO,” 2025. [Online]. Available: https://github.com/ultralytics/ultralytics
work page 2025
-
[6]
DETRs Beat YOLOs on Real-Time Object Detection,
Y . Zhao, W. Lv, S. Xu, J. Wei, G. Wang, Q. Dang, Y . Liu, and J. Chen, “DETRs Beat YOLOs on Real-Time Object Detection,” in Proceedings of the IEEE/CVF Conference on Computer Vision and Pattern Recognition, 2024, pp. 16 965–16 974
work page 2024
-
[7]
J. Linchant, J. Lisein, J. Semeki, P. Lejeune, and C. Vermeulen, “Are unmanned aircraft systems (uas s) the future of wildlife monitoring? a review of accomplishments and challenges,”Mammal review, vol. 45, no. 4, pp. 239–252, 2015
work page 2015
-
[8]
P. Fust and J. Loos, “Increasing the accuracy and efficiency of wildlife census with unmanned aerial vehicles: a simulation study,”Wildlife Research, vol. 50, pp. 1008–1020, 2023
work page 2023
Show all 29 references
-
[9]
Unmanned aerial vehicle surveys reveal unexpectedly high density of a threatened deer in a plantation forestry landscape,
J. A. Pereira, D. Varela, L. J. Scarpa, A. E. Frutos, N. G. Fracassi, B. V . Lartigau, and C. I. Pi˜na, “Unmanned aerial vehicle surveys reveal unexpectedly high density of a threatened deer in a plantation forestry landscape,”ORYX, vol. 57, pp. 89–97, 2023
2023
-
[10]
Computer-automated bird detection and counts in high-resolution aerial images: A review,
D. Chabot and C. Francis, “Computer-automated bird detection and counts in high-resolution aerial images: A review,”J. Field Ornithol., vol. 87, pp. 343–359, 2016
2016
-
[11]
Use of unmanned aerial vehicles for livestock monitoring based on streaming k-means clustering,
X. Li and L. Xing, “Use of unmanned aerial vehicles for livestock monitoring based on streaming k-means clustering,”IFAC- PapersOnLine, vol. 52, pp. 324–329, 2019
2019
-
[12]
Fsscaps-detcountnet: Fuzzy soft sets and capsnet-based detection and counting network for monitoring animals from aerial images,
D. Sundaram and A. Loganathan, “Fsscaps-detcountnet: Fuzzy soft sets and capsnet-based detection and counting network for monitoring animals from aerial images,”J. Appl. Remote Sens., vol. 14, p. 026521, 2020
2020
-
[13]
A study on the detection of cattle in uav images using deep learning,
J. Barbedo, L. Koenigkan, T. Santos, and P. Santos, “A study on the detection of cattle in uav images using deep learning,”Sensors, vol. 19, p. 5436, 2019
2019
-
[14]
Automated aerial animal detection when spatial resolution conditions are varied,
J. Brown, Y . Qiao, C. Clark, S. Lomax, K. Rafique, and S. Sukkarieh, “Automated aerial animal detection when spatial resolution conditions are varied,”Comput. Electron. Agric., vol. 193, p. 106689, 2022
2022
-
[15]
A survey of transfer learning,
K. Weiss, T. Khoshgoftaar, and D. Wang, “A survey of transfer learning,”J. Big Data, vol. 3, p. 9, 2016
2016
-
[16]
Self-supervised pretraining and controlled augmentation improve rare wildlife recognition in uav images,
X. Zheng, B. Kellenberger, R. Gong, I. Hajnsek, and D. Tuia, “Self-supervised pretraining and controlled augmentation improve rare wildlife recognition in uav images,” inProceedings of the IEEE/CVF International Conference on Computer Vision. Montreal, BC, Canada: IEEE/CVF, Oc...
2021
-
[17]
Operational data augmentation in classifying single aerial images of animals,
E. Okafor, R. Smit, L. Schomaker, and M. Wiering, “Operational data augmentation in classifying single aerial images of animals,” inProceedings of the 2017 IEEE International Conference on INnovations in Intelligent SysTems and Applications (INISTA). Gdynia, Poland: IEEE, July...
2017
-
[18]
Best practices to train deep models on imbalanced datasets—a case study on animal detection in aerial imagery,
B. Kellenberger, D. Marcos, and D. Tuia, “Best practices to train deep models on imbalanced datasets—a case study on animal detection in aerial imagery,” inProceedings of the Joint European Conference on Machine Learning and Knowledge Discovery in Databases, Springer. Dublin, ...
2018
-
[19]
W AID: A Large-Scale Dataset for Wildlife Detection with Drones,
C. Mou, T. Liu, C. Zhu, and X. Cui, “W AID: A Large-Scale Dataset for Wildlife Detection with Drones,”Applied Sciences, vol. 13, no. 18, 2023
2023
-
[20]
Deer survey from drone thermal imagery using enhanced faster R-CNN based on ResNets and FPN,
H. Lyu, F. Qiu, L. An, D. Stow, R. Lewison, and E. Bohnett, “Deer survey from drone thermal imagery using enhanced faster R-CNN based on ResNets and FPN,”Ecological Informatics, vol. 79, p. 102383, 2024
2024
-
[21]
Efficient endangered deer species monitoring with uav aerial imagery and deep learning,
A. Roca, G. Torre, J. I. Giribet, G. Castro, L. Colombo, I. Mas, and J. Pereira, “Efficient endangered deer species monitoring with uav aerial imagery and deep learning,” in2024 IEEE Biennial Congress of Argentina (ARGENCON), 2024, pp. 1–8
2024
-
[22]
An end-to-end transformer model for 3d object detection,
I. Misra, R. Girdhar, and A. Joulin, “An end-to-end transformer model for 3d object detection,” inProceedings of the IEEE/CVF international conference on computer vision, 2021, pp. 2906–2917
2021
-
[23]
Deep residual learning for image recognition,
K. He, X. Zhang, S. Ren, and J. Sun, “Deep residual learning for image recognition,” inProceedings of the IEEE conference on computer vision and pattern recognition, 2016, pp. 770–778
2016
-
[24]
Microsoft COCO: Common Objects in Context,
T.-Y . Lin, M. Maire, S. Belongie, J. Hays, P. Perona, D. Ramanan, P. Doll ´ar, and C. L. Zitnick, “Microsoft COCO: Common Objects in Context,” inComputer Vision–ECCV 2014: 13th European Conference, Zurich, Switzerland, September 6-12, 2014, Proceedings, Part V 13. Springer, 2...
2014
-
[25]
Mask R-CNN,
K. He, G. Gkioxari, P. Doll ´ar, and R. Girshick, “Mask R-CNN,” in Proceedings of the IEEE international conference on computer vision, 2017, pp. 2961–2969
2017
-
[26]
Spatial pyramid pooling in deep convolutional networks for visual recognition,
K. He, X. Zhang, S. Ren, and J. Sun, “Spatial pyramid pooling in deep convolutional networks for visual recognition,”IEEE Transactions on Pattern Analysis and Machine Intelligence, vol. 37, no. 9, pp. 1904– 1916, 2015
1904
-
[27]
CSPNet: A new backbone that can enhance learning capability of CNN,
C.-Y . Wang, H.-Y . M. Liao, Y .-H. Wu, P.-Y . Chen, J.-W. Hsieh, and I.-H. Yeh, “CSPNet: A new backbone that can enhance learning capability of CNN,” inProceedings of the IEEE/CVF conference on computer vision and pattern recognition workshops, 2020, pp. 390– 391
2020
-
[28]
CBAM: Convolutional block attention module,
S. Woo, J. Park, J.-Y . Lee, and I. S. Kweon, “CBAM: Convolutional block attention module,” inProceedings of the European conference on computer vision (ECCV), 2018, pp. 3–19
2018
-
[29]
YOLACT: Real-time instance segmentation,
D. Bolya, C. Zhou, F. Xiao, and Y . J. Lee, “YOLACT: Real-time instance segmentation,” inProceedings of the IEEE/CVF international conference on computer vision, 2019, pp. 9157–9166
2019
Reviewed August 7, 2026 · model on record in the stance chip above.
Discussion (0). Sign in to comment.