REVIEW 3 major objections 6 minor 40 references
Improving the Calibration of Confidence Scores in Text Generation Using the Output Distribution's Characteristics
T0 review · 3 major / 6 minor · reviewed 2026-08-07 · deepseek-v4-flash
Pith's one-line read Confidence in text generation is better read from the whole output distribution than from the top-ranked sequence, and two new probability-only scores improve calibration on summarization, translation, and QA.
desk verdict Ratio metric has a k=1 inconsistency that invalidates two reported results, but the rest is a solid empirical study of simple confidence metrics. read the letter →
The pith
A machine-rendered reading of the paper's core claim, the machinery that carries it, and where it could break.
The reading
What carries the argument
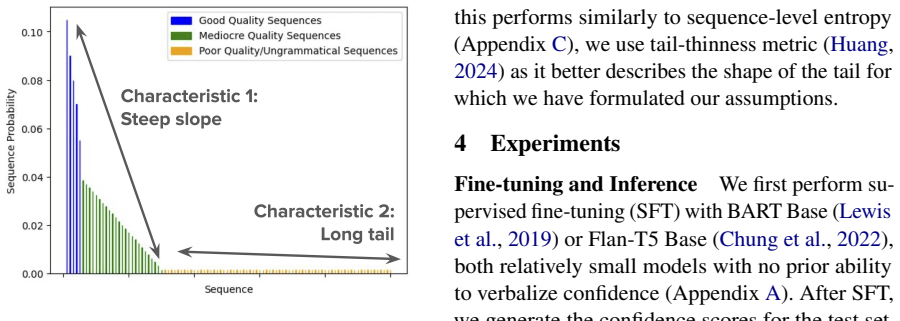
The load-bearing objects are two scores computed from the probability distribution over beam search outputs. The ratio score is $p_{\hat y^{(1)}}(x)\,/\,p_{\hat y^{(k)}}(x)$, the probability of the top-ranked beam divided by that of the $k$-th ranked beam, with $k$ tuned on a validation set per task; it captures the hypothesis that a confident model clearly separates its best sequence from an average one. The tail-thinness score is $\sum_{i=1}^{N}p_{\hat y^{(i)}}(x)^2$ after softmax normalization of the $N$ beam probabilities, adapted from a recently proposed tail-index measure; it quantifies how quickly probability mass dies away from a few good sequences. Both are computed purely from the model's own output probabilities, so they need no trained verifier, similarity model, dropout passes, or task-specific heuristics, and both are designed to stay meaningful when several different outputs are valid.
What would settle it
Recompute the same Spearman correlations with human quality ratings or with any independent quality metric on the same generated outputs; if the ratio and tail-thinness scores do not rank first more often than the baselines, the claimed calibration improvement is an artifact of the automatic metric.
Extended reading notes
Core claim
The paper's central discovery is that in text generation, confidence is a property of the shape of the distribution over candidate sequences, not of the probability of any single sequence. For each input, the authors use beam search to obtain $N=100$ candidate sequences and their probabilities; the ratio method computes $p_{\hat y^{(1)}}(x)/p_{\hat y^{(k)}}(x)$, how much more probable the best beam is than the $k$-th ranked beam, with $k$ tuned per task. The tail-thinness method computes $\sum_{i=1}^{N} p_{\hat y^{(i)}}(x)^2$ after softmax-normalizing the beam probabilities, scoring how quickly probability mass dies out. Both scores embody the hypothesis that a confident model assigns high probability to a select set of good sequences and low probability to many bad ones, irrespective of how many valid outputs exist. The empirical result is that these scores correlate more strongly with BLEU, F1, and ROUGE-L than the replicated probability, similarity, and dropout baselines do, with tail thinness ranking first in 10 of 16 model-dataset pairs and ratio in 8 of 16.
Load-bearing premise
The load-bearing premise is that Spearman correlation between a confidence score and one automatic quality metric (BLEU, F1, or ROUGE-L) measures calibration, even though the paper's own Appendix D shows those metrics can rate good outputs as bad and bad outputs as good.
Editorial extensions
If this is right
- Because the required probabilities are already produced by beam search, low-confidence outputs can be flagged at decoding time without any extra trained verifier.
- The scores make no task-specific assumptions, so the same recipe should transfer to other open-ended generation tasks beyond the nine datasets tested.
- The tuned parameter $k$ behaves interpretably: small $k$ suits close-ended question answering, while large $k$ suits open-ended translation and summarization.
- Applications that trigger human review or abstention on low-confidence outputs can use these scores with fine-tuned BART and Flan-T5 systems.
Reading between the lines
- A direct extension the paper does not test is applying ratio and tail-thinness scores to sampled outputs from larger instruction-tuned models; the distribution-shape rationale should carry over if the hypothesis is general.
- The appendix shows tail thinness and beam entropy perform almost identically, so the practical gain may come from analyzing the full beam distribution rather than from the specific formula; an ablation with matched tuning could isolate the source.
- The ratio method's $k$ is effectively an estimate of how many sequences count as good, so a semantic-clustering estimate of valid-output count could replace the tuned $k$ and make the method fully heuristic-free.
- Because the paper's own examples show reference-based metrics can mislabel quality, a human-rated evaluation set is the natural next test; it could either shrink or enlarge the reported gap over baselines.
Editorial analysis
A structured set of objections, weighed in public.
Referee Report
Summary. The paper proposes two confidence metrics for text generation based on the probabilities of beam-search outputs: Ratio, defined as the probability of the top beam divided by the k-th beam's probability, and Tail Thinness, defined as the sum of squared softmax-normalized beam probabilities. The authors fine-tune BART and Flan-T5 on three tasks (summarization, translation, QA) across nine datasets and measure Spearman correlations between confidence scores and BLEU/ROUGE-L/F1. They report that the proposed methods achieve the best correlation more frequently than probability, similarity, and dropout baselines (10/16 for tail thinness, 8/16 for ratio), discuss the role of the hyperparameter k, and provide failure-case analyses.
Significance. The proposed metrics are simple, inference-only, and potentially task-agnostic, and the paper includes a code repository, fine-tuning details, dataset splits, hyperparameters, and bootstrap significance tests, which are strengths for reproducibility. If the empirical claims hold, the methods would offer a low-cost alternative to similarity- or dropout-based confidence estimation. However, the central empirical claim currently rests on correlations with automatic quality metrics, and one reported configuration of the ratio method appears mathematically impossible as written, so the main result needs correction before the significance can be fully assessed.
major comments (3)
- [§3 (Ratio definition) and Tables 1/3] The ratio method is defined as Ratio(x) = p^(1)(x)/p^(k)(x) with beams sorted in descending order. For k=1, this ratio is identically 1 for every example, so the Spearman correlation with any quality score is undefined (or 0 in implementations that return a default value). Table 3 reports k=1 for HotpotQA BART, HotpotQA Flan-T5, and SQUAD BART, while Table 1 reports nonzero Spearman correlations (0.249, 0.360, and 0.505) for these configurations. This is inconsistent with the published formula. The authors should clarify the actual implementation (for example, whether k counts beams below the top beam or the denominator uses a different rank) and verify or correct the affected Table 1 entries, since the ratio method's overall 8/16 best-frequency count depends on these numbers.
- [§4 and Table 1 caption] The table reports the absolute value of Spearman correlation, while Section 3 defines calibration as a positive correlation between confidence and output quality. If any confidence score is negatively correlated with quality, taking absolute values can present a miscalibrated score as calibrated. The paper should report signed correlations, or justify that negative correlations cannot occur, because the relative ranking of methods can change if signs are flipped.
- [§5, Appendix D, and Limitations] The headline claim of improved calibration is measured solely by Spearman correlation with a single automatic metric (BLEU, F1, or ROUGE-L). Appendix D itself documents cases where these metrics rate a repeated-phrase summary as good and a correct-gist summary as bad, so the reported correlations are with a noisy proxy for output quality. The limitation is acknowledged, but the paper should either qualify the central claim or provide supplementary evidence (for example, correlation with human judgments on a subset) to show that the improvement transfers to true output quality.
minor comments (6)
- [Figure 5] Figure 5 is labeled 'on test set' while Section 3 states that k is tuned on a validation set and reported on the test set. If the figure is meant to illustrate the validation-based selection, it should plot validation correlations; otherwise it should be clearly labeled as a post-hoc test-set analysis.
- [Abstract] The abstract says the metrics need 'no further fine-tuning or heuristics,' but the method tunes k and a softmax temperature on a validation set for each dataset. Suggest rephrasing to 'no additional training' and acknowledging validation-based hyperparameter selection.
- [Appendix C, Table 5] Appendix C shows that the tail-thinness results are very close to beam-level entropy (for example, 0.649 vs 0.649 on FLORES Filipino with BART). The main text should discuss this relationship more explicitly so readers can assess the novelty of the tail measure.
- [§5, Results] The statements 'better correlation on 6 out of 9 datasets' (BART) and '4 out of 9 datasets' (Flan-T5) would be clearer if the text specified whether the count refers to cases where at least one of the two proposed methods beats all baselines, since the two methods do not always both win on the same datasets.
- [Appendix A, Table 3] The text says 'we report the temperature used in Appendix A,' but the temperature values appear in Table 3; consider adding a cross-reference to the table.
- [References] The reference for Huang (2024) lacks a publication venue or arXiv identifier; please complete the bibliographic entry.
Circularity Check
No circularity: the proposed confidence metrics are evaluated against held-out quality metrics and do not reduce by construction to their inputs.
full rationale
The paper's central claim is empirical: two proposed confidence scores (Ratio and Tail Thinness) are computed from beam-search sequence probabilities and correlated with external reference-based quality metrics (BLEU, F1, ROUGE-L) on held-out test sets. No derivation step equates an output to an input by definition. The Ratio score is p^(1)/p^(k), with k tuned on validation and then fixed on the test set; the Tail Thinness is a normalized sum of squared probabilities with a softmax temperature tuned on validation. These are standard hyperparameter choices, not fitted predictions, and the reported test correlations are independent of the validation-tuned values. The tail-thinness metric is adapted from Huang (2024), which is not a self-citation by the current authors, and the paper explicitly discloses in Appendix C that it performs similarly to beam-level entropy, so there is no renaming of a known result presented as a new derivation. Appendix D's failure cases and the limitations section acknowledge that automatic metrics may rate outputs poorly; this is a caveat about the evaluation proxy, not a circular dependency. The noted k=1 anomaly (a constant Ratio score cannot yield the nonzero Spearman correlations in Table 1 for HotpotQA and SQUAD with BART) is an internal consistency or reproducibility concern that the authors should address, but it is not an instance of a prediction being equivalent to its input by construction, so it does not raise the circularity score under the stated rules.
Assumptions & free parameters
free parameters (3)
- k in Ratio method =
1 to 99 depending on dataset (Table 3)
- softmax temperature for Tail Thinness =
0.001 to 1.0 depending on dataset (Table 3)
- beam count N =
100 (fixed cap)
assumptions (4)
- domain assumption Beam search top-N sequences and their normalized probabilities are a representative sample of the model's output distribution.
- domain assumption A confident model assigns high probability to a select set of good sequences and low probability to bad ones, producing a steep slope and thin tail.
- domain assumption Spearman correlation with a single automatic metric measures calibration.
- standard math Sequence probabilities are computed as products of token probabilities.
Cite this review
Pith. "Pith review of Improving the Calibration of Confidence Scores in Text Generation Using the Output Distribution's Characteristics." pith.science (2026). https://pith.science/paper/CV6WMJVM
@misc{pith2026250600637,
  author       = {Pith},
  title        = {Pith review of: Improving the Calibration of Confidence Scores in Text Generation Using the Output Distribution's Characteristics},
  year         = {2026},
  howpublished = {\url{https://pith.science/paper/CV6WMJVM}},
  note         = {Machine review of arXiv:2506.00637}
}
read the original abstract
Well-calibrated model confidence scores can improve the usefulness of text generation models. For example, users can be prompted to review predictions with low confidence scores, to prevent models from returning bad or potentially dangerous predictions. However, confidence metrics are not always well calibrated in text generation. One reason is that in generation, there can be many valid answers, which previous methods do not always account for. Hence, a confident model could distribute its output probability among multiple sequences because they are all valid. We propose task-agnostic confidence metrics suited to generation, which rely solely on the probabilities associated with the model outputs without the need for further fine-tuning or heuristics. Using these, we are able to improve the calibration of BART and Flan-T5 on summarization, translation, and QA datasets.
Figures


Figures from the paper (2 more)


Reference graph
Works this paper leans on
-
[1]
Taylor Berg-Kirkpatrick, David Burkett, and Dan Klein. 2012. https://aclanthology.org/D12-1091/ An empirical investigation of statistical significance in NLP . In Proceedings of the 2012 Joint Conference on Empirical Methods in Natural Language Processing and Computational Natural Language Learning, pages 995--1005, Jeju Island, Korea. Association for Com...
2012
-
[2]
Ond r ej Bojar, Rajen Chatterjee, Christian Federmann, Yvette Graham, Barry Haddow, Shujian Huang, Matthias Huck, Philipp Koehn, Qun Liu, Varvara Logacheva, Christof Monz, Matteo Negri, Matt Post, Raphael Rubino, Lucia Specia, and Marco Turchi. 2017. http://www.aclweb.org/anthology/W17-4717 Findings of the 2017 conference on machine translation (wmt17) . ...
work page 2017
-
[3]
Chi, Jeff Dean, Jacob Devlin, Adam Roberts, Denny Zhou, Quoc V
Hyung Won Chung, Le Hou, Shayne Longpre, Barret Zoph, Yi Tay, William Fedus, Eric Li, Xuezhi Wang, Mostafa Dehghani, Siddhartha Brahma, Albert Webson, Shixiang Shane Gu, Zhuyun Dai, Mirac Suzgun, Xinyun Chen, Aakanksha Chowdhery, Sharan Narang, Gaurav Mishra, Adams Yu, Vincent Zhao, Yanping Huang, Andrew Dai, Hongkun Yu, Slav Petrov, Ed H. Chi, Jeff Dean,...
-
[4]
Yassir Fathullah, Guoxuan Xia, and Mark John Francis Gales. 2023. https://api.semanticscholar.org/CorpusID:258741024 Logit-based ensemble distribution distillation for robust autoregressive sequence uncertainties . ArXiv, abs/2305.10384
arXiv 2023
-
[5]
Haixia Han, Tingyun Li, Shisong Chen, Jie Shi, Chengyu Du, Yanghua Xiao, Jiaqing Liang, and Xin Lin. 2024. http://arxiv.org/abs/2404.10315 Enhancing confidence expression in large language models through learning from past experience
arXiv 2024
-
[6]
Hening Huang. 2024. https://doi.org/10.32388/9B8HK9 A new measure of the tail-heaviness of a probability distribution
-
[7]
Yuheng Huang, Jiayang Song, Zhijie Wang, Shengming Zhao, Huaming Chen, Felix Juefei-Xu, and Lei Ma. 2023. http://arxiv.org/abs/2307.10236 Look before you leap: An exploratory study of uncertainty measurement for large language models
arXiv 2023
-
[8]
Amita Kamath, Robin Jia, and Percy Liang. 2020. https://doi.org/10.18653/v1/2020.acl-main.503 Selective question answering under domain shift . In Proceedings of the 58th Annual Meeting of the Association for Computational Linguistics, pages 5684--5696, Online. Association for Computational Linguistics
Show all 40 references
-
[9]
Sanyam Kapoor, Nate Gruver, Manley Roberts, Katherine Collins, Arka Pal, Umang Bhatt, Adrian Weller, Samuel Dooley, Micah Goldblum, and Andrew Gordon Wilson. 2024. http://arxiv.org/abs/2406.08391 Large language models must be taught to know what they don't know
2024 arXiv
-
[10]
Byeongchang Kim, Hyunwoo Kim, and Gunhee Kim. 2018. http://arxiv.org/abs/1811.00783 Abstractive summarization of reddit posts with multi-level memory networks
2018 arXiv
-
[11]
Lorenz Kuhn, Yarin Gal, and Sebastian Farquhar. 2023. https://openreview.net/forum?id=VD-AYtP0dve Semantic uncertainty: Linguistic invariances for uncertainty estimation in natural language generation . In The Eleventh International Conference on Learning Representations
2023
-
[12]
Aviral Kumar and Sunita Sarawagi. 2019. https://api.semanticscholar.org/CorpusID:67855916 Calibration of encoder decoder models for neural machine translation . ArXiv, abs/1903.00802
2019 arXiv
-
[13]
Balaji Lakshminarayanan, Alexander Pritzel, and Charles Blundell. 2017. http://arxiv.org/abs/1612.01474 Simple and scalable predictive uncertainty estimation using deep ensembles
2017 arXiv
-
[14]
Mike Lewis, Yinhan Liu, Naman Goyal, Marjan Ghazvininejad, Abdelrahman Mohamed, Omer Levy, Veselin Stoyanov, and Luke Zettlemoyer. 2019. http://arxiv.org/abs/1910.13461 BART: denoising sequence-to-sequence pre-training for natural language generation, translation, and comprehe...
2019 arXiv
-
[15]
Chin-Yew Lin. 2004. https://aclanthology.org/W04-1013/ ROUGE : A package for automatic evaluation of summaries . In Text Summarization Branches Out, pages 74--81, Barcelona, Spain. Association for Computational Linguistics
2004
-
[16]
Stephanie Lin, Jacob Hilton, and Owain Evans. 2022. https://openreview.net/forum?id=8s8K2UZGTZ Teaching models to express their uncertainty in words . Transactions on Machine Learning Research
2022
-
[17]
Zhen Lin, Shubhendu Trivedi, and Jimeng Sun. 2023. https://api.semanticscholar.org/CorpusID:258967487 Generating with confidence: Uncertainty quantification for black-box large language models . Trans. Mach. Learn. Res., 2024
2023
-
[18]
Jeremiah Zhe Liu, Zi Lin, Shreyas Padhy, Dustin Tran, Tania Bedrax-Weiss, and Balaji Lakshminarayanan. 2020. http://arxiv.org/abs/2006.10108 Simple and principled uncertainty estimation with deterministic deep learning via distance awareness
2020 arXiv
-
[19]
Andrey Malinin and Mark Gales. 2021. http://arxiv.org/abs/2002.07650 Uncertainty estimation in autoregressive structured prediction
2021 arXiv
-
[20]
Andrey Malinin, Bruno Mlodozeniec, and Mark John Francis Gales. 2019. https://api.semanticscholar.org/CorpusID:141465546 Ensemble distribution distillation . ArXiv, abs/1905.00076
2019 arXiv
-
[21]
Kenton Murray and David Chiang. 2018. https://doi.org/10.18653/v1/W18-6322 Correcting length bias in neural machine translation . In Proceedings of the Third Conference on Machine Translation: Research Papers, pages 212--223, Brussels, Belgium. Association for Computational Li...
2018 doi
-
[22]
Cohen, and Mirella Lapata
Shashi Narayan, Shay B. Cohen, and Mirella Lapata. 2018. https://doi.org/10.18653/v1/D18-1206 Don`t give me the details, just the summary! topic-aware convolutional neural networks for extreme summarization . In Proceedings of the 2018 Conference on Empirical Methods in Natura...
2018 doi
-
[23]
Alexander Nikitin, Jannik Kossen, Yarin Gal, and Pekka Marttinen. 2024. https://api.semanticscholar.org/CorpusID:270123445 Kernel language entropy: Fine-grained uncertainty quantification for llms from semantic similarities . ArXiv, abs/2405.20003
2024 arXiv
-
[24]
Team NLLB. 2022. No language left behind: Scaling human-centered machine translation
2022
-
[25]
Kishore Papineni, Salim Roukos, Todd Ward, and Wei-Jing Zhu. 2002. https://doi.org/10.3115/1073083.1073135 B leu: a method for automatic evaluation of machine translation . In Proceedings of the 40th Annual Meeting of the Association for Computational Linguistics, pages 311--3...
2002
-
[26]
Yotam Perlitz, Ariel Gera, Michal Shmueli-Scheuer, Dafna Sheinwald, Noam Slonim, and Liat Ein-Dor. 2023. https://doi.org/10.18653/v1/2023.emnlp-main.611 Active learning for natural language generation . In Proceedings of the 2023 Conference on Empirical Methods in Natural Lang...
2023 doi
-
[27]
Pranav Rajpurkar, Jian Zhang, Konstantin Lopyrev, and Percy Liang. 2016. https://doi.org/10.18653/v1/D16-1264 SQ u AD : 100,000+ questions for machine comprehension of text . In Proceedings of the 2016 Conference on Empirical Methods in Natural Language Processing, pages 2383-...
2016 doi
-
[28]
Allen Roush and Arvind Balaji. 2020. https://aclanthology.org/2020.argmining-1.1/ D ebate S um: A large-scale argument mining and summarization dataset . In Proceedings of the 7th Workshop on Argument Mining, pages 1--7, Online. Association for Computational Linguistics
2020
-
[29]
Bartezzaghi, Jasmina Bogojeska, Adelmo Cristiano Innocenza Malossi, and Thang Vu
Maximilian Schmidt, A. Bartezzaghi, Jasmina Bogojeska, Adelmo Cristiano Innocenza Malossi, and Thang Vu. 2022. https://api.semanticscholar.org/CorpusID:254044648 Combining data generation and active learning for low-resource question answering . In International Conference on ...
2022
-
[30]
Liu, and Christopher D
Abigail See, Peter J. Liu, and Christopher D. Manning. 2017. https://doi.org/10.18653/v1/P17-1099 Get to the point: Summarization with pointer-generator networks . In Proceedings of the 55th Annual Meeting of the Association for Computational Linguistics (Volume 1: Long Papers...
2017 doi
-
[31]
Katherine Tian, Eric Mitchell, Allan Zhou, Archit Sharma, Rafael Rafailov, Huaxiu Yao, Chelsea Finn, and Christopher Manning. 2023. https://doi.org/10.18653/v1/2023.emnlp-main.330 Just ask for calibration: Strategies for eliciting calibrated confidence scores from language mod...
2023 doi
-
[32]
Artem Vazhentsev, Akim Tsvigun, Roman Vashurin, Sergey Petrakov, Daniil Vasilev, Maxim Panov, Alexander Panchenko, and Artem Shelmanov. 2023. https://doi.org/10.18653/v1/2023.findings-acl.93 Efficient out-of-domain detection for sequence to sequence models . In Findings of the...
2023 doi
-
[33]
Thomas Wolf, Lysandre Debut, Victor Sanh, Julien Chaumond, Clement Delangue, Anthony Moi, Pierric Cistac, Tim Rault, Rémi Louf, Morgan Funtowicz, Joe Davison, Sam Shleifer, Patrick von Platen, Clara Ma, Yacine Jernite, Julien Plu, Canwen Xu, Teven Le Scao, Sylvain Gugger, Mari...
2020 arXiv
-
[34]
Xiao, Aidan N
Tim Z. Xiao, Aidan N. Gomez, and Yarin Gal. 2020. http://arxiv.org/abs/2006.08344 Wat zei je? detecting out-of-distribution translations with variational transformers
2020 arXiv
-
[35]
Duygu Nur Yaldiz, Yavuz Faruk Bakman, Baturalp Buyukates, Chenyang Tao, Anil Ramakrishna, Dimitrios Dimitriadis, and Amir Salman Avestimehr. 2024. https://api.semanticscholar.org/CorpusID:270560969 Do not design, learn: A trainable scoring function for uncertainty estimation i...
2024 arXiv
-
[36]
Zhilin Yang, Peng Qi, Saizheng Zhang, Yoshua Bengio, William Cohen, Ruslan Salakhutdinov, and Christopher D. Manning. 2018. https://doi.org/10.18653/v1/D18-1259 H otpot QA : A dataset for diverse, explainable multi-hop question answering . In Proceedings of the 2018 Conference...
2018 doi
-
[37]
Polina Zablotskaia, Du Phan, Joshua Maynez, Shashi Narayan, Jie Ren, and Jeremiah Liu. 2023. https://doi.org/10.18653/v1/2023.findings-emnlp.197 On uncertainty calibration and selective generation in probabilistic neural summarization: A benchmark study . In Findings of the As...
2023 doi
-
[38]
Yuekai Zhao, Haoran Zhang, Shuchang Zhou, and Zhihua Zhang. 2020. https://doi.org/10.18653/v1/2020.findings-emnlp.162 Active learning approaches to enhancing neural machine translation . In Findings of the Association for Computational Linguistics: EMNLP 2020, pages 1796--1806...
2020 doi
-
[39]
URL: " 'urlintro :=
ENTRY address author booktitle chapter edition editor howpublished institution journal key month note number organization pages publisher school series title type volume year eprint doi pubmed url lastchecked label extra.label sort.label short.list INTEGERS output.state before...
-
[40]
write newline
" write newline "" before.all 'output.state := FUNCTION n.dashify 't := "" t empty not t #1 #1 substring "-" = t #1 #2 substring "--" = not "--" * t #2 global.max substring 't := t #1 #1 substring "-" = "-" * t #2 global.max substring 't := while if t #1 #1 substring * t #2 gl...
Reviewed August 7, 2026 · model on record in the stance chip above.
Discussion (0). Sign in to comment.