REVIEW 4 major objections 3 minor 30 references
ShaTS: A Shapley-based Explainability Method for Time Series Artificial Intelligence Models applied to Anomaly Detection in Industrial Internet of Things
T0 review · 4 major / 3 minor · reviewed 2026-08-07 · deepseek-v4-flash
Pith's one-line read Computing Shapley values on a priori feature groups preserves temporal dependencies and identifies the attacked process first in 19 of 21 SWaT attacks, against 8 for post hoc SHAP.
desk verdict ShaTS is a clean engineering idea with an open-source implementation, but the paper's central claim of outperforming SHAP is undermined by a top-1 counting error and a missing baseline. read the letter →
The pith
A machine-rendered reading of the paper's core claim, the machinery that carries it, and where it could break.
The reading
What carries the argument
The load-bearing device is a priori feature grouping: partitioning the model input into groups (time instants, sensor/actuator identities, or industrial processes) before any coalition is evaluated, and then treating each group as a single Shapley player. This makes each attribution semantically interpretable and shrinks the player set from 690 raw feature values to 10, 44, or 6 players, so the approximate Shapley computation with $m = 20\cdot|G|$ sampled coalitions stays tractable and preserves temporal structure. The approximation follows the stratified sampling scheme of reference [15], with the coalition value estimated by averaging model predictions over a background dataset.
What would settle it
Count the top-1 hits in Table 4 under the paper's own rule: ShaTS must name the attacked sensor first in 14 of the 21 detected attacks (SHAP in 6) and the attacked process first in 19 (SHAP in 8); a different count would falsify the claim.
Extended reading notes
Core claim
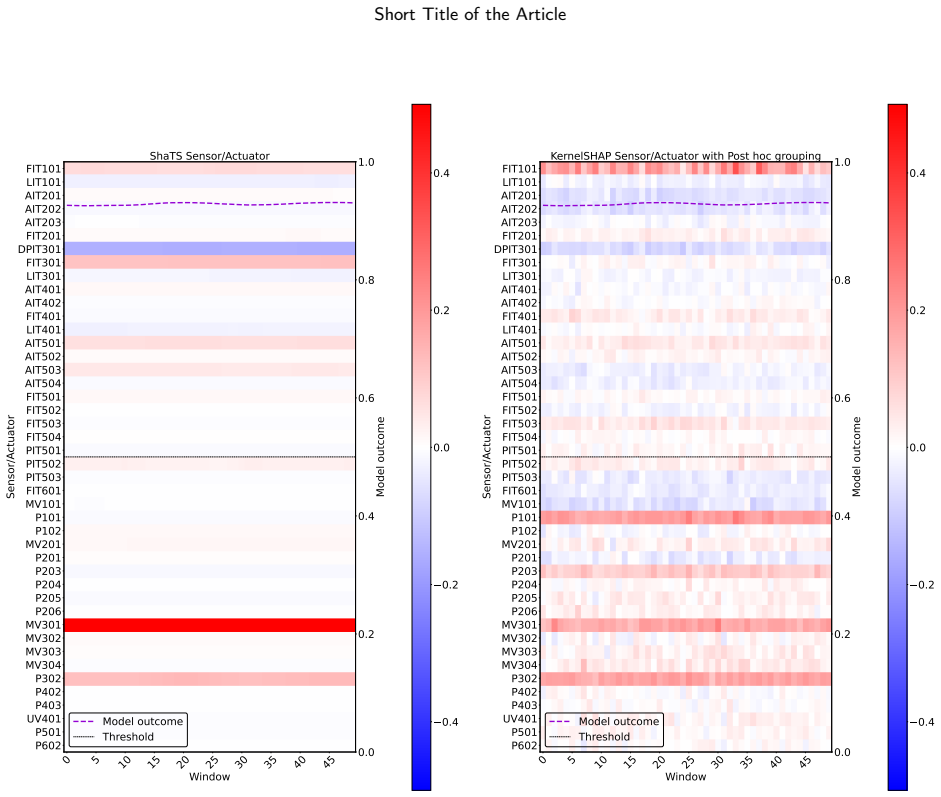
The central discovery is that where you put the grouping in Shapley computation changes both the quality and the cost of the explanation. ShaTS partitions each time window into a small set of semantically meaningful players, either the 10 instants, the 44 sensors/actuators, or the 6 SWaT processes, and then runs the Shapley formula over those groups using a sampled-coalition approximation with a 500-instance background dataset. The reported result is that this yields sharper attributions than computing KernelSHAP on all features and aggregating post hoc: the attacked sensor is the top-ranked group in 14 of 21 attacks with ShaTS versus 6 with SHAP, and the attacked process in 19 of 21 versus 8. Resource measurements show ShaTS staying within the 16 GB GPU limit and near-constant per-window execution time as window size grows, whereas the SHAP baseline often spills to CPU and exceeds the one-second real-time threshold.
Load-bearing premise
The evaluation assumes that the SWaT attack labels are the ground truth for a good explanation and measures 'correct' by whether the attacked sensor or process is the top-ranked attribution; if operators or a random/permutation baseline were used instead, the reported advantage over SHAP could shrink or disappear.
Editorial extensions
If this is right
- If the paper's results hold, an anomaly detector can be paired with an explanation service that tells the operator which process and which sensor/actuator to inspect while the attack is still ongoing.
- At the sensor and process level, explanation cost stops growing with the window length, because the number of players is fixed by the grouping; this makes longer context windows practical for real-time monitoring.
- The method is model-agnostic, so the same a priori grouping device can be added to LSTM, CNN, or GRU anomaly detectors without retraining them.
- The comparison suggests that post hoc aggregation of per-feature Shapley values, the common practice in the reviewed literature, systematically dilutes the attribution to the true attacked component.
Reading between the lines
- I infer that the grouping principle should transfer to other multivariate time-series settings with natural groups, such as ECG leads, network flows, or weather stations; rerunning the same protocol on a second labeled dataset would test this.
- A natural next evaluation, not reported in the paper, would have operators rank explanations or would compare ShaTS against a random/permutation baseline; that would test whether the top-1 metric is truly measuring explanation quality.
- The resource advantage is largely structural, since grouping reduces the number of Shapley players; other Shapley estimators that accept grouped players would likely show similar gains, independent of the specific sampling scheme used here.
Editorial analysis
A structured set of objections, weighed in public.
Referee Report
Summary. The paper introduces ShaTS, a model-agnostic Shapley-based explanation method for time-series models. ShaTS computes Shapley values on a priori defined feature groups (time instants, individual sensors/actuators, or industrial processes) rather than on raw features, with an exact formula and a stratified-sampling approximation. The method is integrated into an LSTM-based anomaly-detection pipeline and evaluated on the SWaT benchmark against KernelSHAP with post hoc grouping. The authors report that ShaTS better identifies attacked sensors/actuators and processes, produces temporally consistent explanations, and is substantially more resource-efficient. The resource-efficiency experiments are detailed; the explainability comparison, however, rests on a top-1 hit-rate metric whose counting rule is inconsistent with the reported table and which lacks a chance baseline or significance testing.
Significance. If the evaluation issues are resolved, the contribution is a useful and principled extension of Shapley values to a priori feature groups for time-series models. The core Shapley equations are standard and correctly presented, the sampling estimator is a published approach, and no parameters are fitted to the benchmark. The open-source release and detailed resource measurements are strengths. The claimed superiority over SHAP in explainability, however, is not yet supported: the sensor-level counts in Section 5.5.1 and Table 4 are not reproducible under the paper's own top-1 rule, and the absence of a random or frequency baseline makes it difficult to interpret even the corrected hit rates. The temporal-consistency claim is supported only by visual inspection.
major comments (4)
- [Section 5.5.1 / Table 4] The headline sensor-level counts (ShaTS 14/21, SHAP 6/21) cannot be reproduced from Table 4 under the stated rule that the top-ranked component is the one with the highest average contribution. Applying that rule literally to the table's top entries yields 13 ShaTS hits (attacks 2, 6, 7, 8, 10, 19, 23, 27, 31, 32, 34, 36, 39) and 5 SHAP hits (attacks 2, 6, 8, 23, 39). If the intended rule instead counts any attacked element appearing anywhere in the printed top-3, the counts are 15 and 8. Neither matches 14/6. The authors must state the exact counting convention, correct the counts accordingly, and provide per-attack decision lists in a machine-readable form. This is load-bearing because the claimed explainability advantage over SHAP rests entirely on this comparison.
- [Section 5.5.1 (Experiment 2)] The top-1 hit-rate comparison has no chance baseline and no uncertainty quantification. With 21 attacks and 44 possible sensors, a uniform random top-1 guess would be expected to hit about 0.5 attacks; a frequency baseline that always selects the most frequently attacked sensor would also score several hits by construction, and the reported SHAP count of 6 is close to such a baseline. The authors should report a random baseline, a frequency baseline, and confidence intervals or a permutation test over attack labels. The same concern applies to the process-level comparison, where random expectation is about 3.5 of 21. Without these, the statement that ShaTS 'outperforms SHAP' at the sensor/actuator level is not statistically supported.
- [Section 5.5.1 (normalization)] The metric used for Table 4 is the average of 'normalized' contribution per group, where normalization divides by the sum of all group values in a window. Since Shapley values can be negative, dividing by their signed sum is not well defined without specifying whether absolute values are used, and small differences can be amplified by this normalization. The manuscript should specify the exact normalization (signed, absolute, or min-max) and demonstrate that the top-1 conclusions are stable under reasonable alternative normalizations.
- [Section 5.5.1 (Experiment 1)] The temporal-consistency analysis is entirely qualitative. The claim that ShaTS 'preserves temporal dependencies' and 'revealed a clear shift in influence' is based on visual inspection of Figure 4, with no quantitative metric for either method. For example, the authors could measure the fraction of windows in which the top-ranked time instant falls in the anomalous portion of the window, or compute a rank correlation between the attribution profile and the attack boundary. Without such a metric, the temporal-superiority claim is not supported.
minor comments (3)
- [Table 4 / Table 2 / Figure 5] Attack 4 is listed as targeting MV504, but MV504 does not appear in Table 2's process mapping, in Figure 5's sensor list, or in the 44 active sensors/actuators described in Section 5.2.3. If MV504 was removed during preprocessing or is not part of the modeled feature set, the sensor-level evaluation of Attack 4 is ill-defined and should be clarified or excluded.
- [Figures 8 and 9] The background-dataset size labels are rendered as one concatenated string ("32016080402010"); please use separate tick labels for readability.
- [Table 3] The grid search lists 'Number of Epochs' as a hyperparameter but only tests the single value 5; please either report the actual range searched or remove this entry from the table.
Circularity Check
No significant circularity: ShaTS computes standard Shapley values over a priori semantic groups; no fitted parameter is relabeled as a prediction and the evaluation is external.
full rationale
The derivation chain is self-contained. ShaTS uses the standard Shapley value definition (Eqs. 1-4) and a published sampling estimator (Eqs. 10-15, based on the Maleki et al. approximation). The grouping strategies are constructed from the SWaT benchmark's semantic structure (temporal instants, sensor/actuator identities, process membership from Table 2), not from quantities fitted to the evaluation outcome. No parameter entering the Shapley computation is tuned to match the attack labels, and the comparison against KernelSHAP uses the same background dataset. The claims of temporal consistency and focused attribution are design consequences of grouping, but they are presented as an empirical comparison against an external benchmark, not derived from self-referential inputs. The only self-citations ([28], [30]) are related-work and figure-source citations; they are not load-bearing for the correctness of the method, and no uniqueness theorem is imported. Concerns about the top-1 evaluation metric, the absence of a random baseline, or the Table 4 counting inconsistency would be validity or evidentiary issues, not circularity: they do not make any equation or fitted value equivalent to the paper's conclusion. Therefore the circularity score is 0.
Assumptions & free parameters
free parameters (2)
- Number of sampled coalitions m =
20 * |G| (200 temporal, 880 sensor/actuator, 120 process)
- Background dataset size K =
500
assumptions (3)
- domain assumption The SWaT process-to-sensor mapping in Table 2 is the correct semantic grouping for process-level explanations.
- standard math Shapley axioms and the Maleki et al. sampling approximation apply when groups of features are treated as players.
- domain assumption Group-level Shapley values computed with background-substituted values faithfully reflect the temporal and semantic structure of the model.
Cite this review
Pith. "Pith review of ShaTS: A Shapley-based Explainability Method for Time Series Artificial Intelligence Models applied to Anomaly Detection in Industrial Internet of Things." pith.science (2026). https://pith.science/paper/VOI37G7M
@misc{pith2026250601450,
  author       = {Pith},
  title        = {Pith review of: ShaTS: A Shapley-based Explainability Method for Time Series Artificial Intelligence Models applied to Anomaly Detection in Industrial Internet of Things},
  year         = {2026},
  howpublished = {\url{https://pith.science/paper/VOI37G7M}},
  note         = {Machine review of arXiv:2506.01450}
}
read the original abstract
Industrial Internet of Things environments increasingly rely on advanced Anomaly Detection and explanation techniques to rapidly detect and mitigate cyberincidents, thereby ensuring operational safety. The sequential nature of data collected from these environments has enabled improvements in Anomaly Detection using Machine Learning and Deep Learning models by processing time windows rather than treating the data as tabular. However, conventional explanation methods often neglect this temporal structure, leading to imprecise or less actionable explanations. This work presents ShaTS (Shapley values for Time Series models), which is a model-agnostic explainable Artificial Intelligence method designed to enhance the precision of Shapley value explanations for time series models. ShaTS addresses the shortcomings of traditional approaches by incorporating an a priori feature grouping strategy that preserves temporal dependencies and produces both coherent and actionable insights. Experiments conducted on the SWaT dataset demonstrate that ShaTS accurately identifies critical time instants, precisely pinpoints the sensors, actuators, and processes affected by anomalies, and outperforms SHAP in terms of both explainability and resource efficiency, fulfilling the real-time requirements of industrial environments.
Figures


Figures from the paper (7 more)




Reference graph
Works this paper leans on
-
[1]
X. Xu, Y. Lu, B. Vogel-Heuser, L. Wang, Industry 4.0 and industry 5.0—inception, conception and perception, Journal of manufacturing systems 61 (2021) 530–535.doi:10.1016/j.jmsy.2021.10.006
- [2]
-
[3]
J. Lee, H. Davari, J. Singh, V. Pandhare, Industrial artificial intelligence for industry 4.0-based manufacturing systems, Manufacturing letters 18 (2018) 20–23.doi:10.1016/j.mfglet.2018.09.002
- [4]
-
[5]
K. E. Hemsley, E. Fisher, et al., History of industrial control system cyber incidents, Tech. rep., Idaho National Lab.(INL), Idaho Falls, ID (United States) (2018).doi:10.2172/1505628
-
[6]
Molnar, Interpretable Machine Learning, 3rd Edition, 2025
C. Molnar, Interpretable Machine Learning, 3rd Edition, 2025. URLhttps://christophm.github.io/interpretable-ml-book
work page 2025
-
[7]
H.Chen,I.C.Covert,S.M.Lundberg,S.-I.Lee,Algorithmstoestimateshapleyvaluefeatureattributions,NatureMachineIntelligence5(6) (2023) 590–601.doi:10.1038/s42256-023-00657-x
-
[8]
3145–3153.doi:10.48550/arXiv.1704.02685
A.Shrikumar,P.Greenside,A.Kundaje, Learningimportantfeaturesthroughpropagatingactivationdifferences,in:Internationalconference on machine learning, PMlR, 2017, pp. 3145–3153.doi:10.48550/arXiv.1704.02685
Show all 30 references
- [9]
- [10]
- [11]
-
[12]
S.M.Lundberg,G.Erion,H.Chen,A.DeGrave,J.M.Prutkin,B.Nair,R.Katz,J.Himmelfarb,N.Bansal,S.-I.Lee,Fromlocalexplanations toglobalunderstandingwithexplainableaifortrees,Naturemachineintelligence2(1)(2020)56–67.doi:10.1038/s42256-019-0138-9
2020 doi
- [13]
-
[14]
Simon, T
G. Simon, T. Vincent, A Projected Stochastic Gradient Algorithm for Estimating Shapley Value Applied in Attribute Importance, Springer International Publishing, 2020, p. 97–115.doi:10.1007/978-3-030-57321-8_6
2020 doi
- [15]
- [16]
-
[17]
Huang, Y
Z. Huang, Y. Wu, A survey on explainable anomaly detection for industrial internet of things, in: 2022 IEEE Conference on Dependable and Secure Computing (DSC), IEEE, 2022, pp. 1–9.doi:10.1109/DSC54232.2022.9888874
2022
- [18]
-
[19]
T.T.Huong,T.P.Bac,K.N.Ha,N.V.Hoang,N.X.Hoang,N.T.Hung,K.P.Tran,Federatedlearning-basedexplainableanomalydetection for industrial control systems, IEEE Access 10 (2022) 53854–53872.doi:10.1109/ACCESS.2022.3173288
2022
-
[20]
Brusa, L
E. Brusa, L. Cibrario, C. Delprete, L. G. Di Maggio, Explainable ai for machine fault diagnosis: understanding features’ contribution in machine learning models for industrial condition monitoring, Applied Sciences 13 (4) (2023) 2038.doi:10.3390/app13042038
2023 doi
-
[21]
Jacob, F
V. Jacob, F. Song, A. Stiegler, B. Rad, Y. Diao, N. Tatbul, Exathlon: a benchmark for explainable anomaly detection over time series, Proc. VLDB Endow. 14 (11) (2021) 2613–2626.doi:10.14778/3476249.3476307
2021
-
[22]
C. W. Hong, C. Lee, K. Lee, M.-S. Ko, K. Hur, Explainable artificial intelligence for the remaining useful life prognosis of the turbofan engines, in: 2020 3rd ieee international conference on knowledge innovation and invention (ickii), IEEE, 2020, pp. 144–147.doi: 10.1109/ICK...
2020
-
[23]
Mathuros, S
K. Mathuros, S. Venugopalan, S. Adepu, Waxai: Explainable anomaly detection in industrial control systems and water systems, in: Proceedings of the 10th ACM Cyber-Physical System Security Workshop, 2024, pp. 3–15.doi:10.1145/3626205.3659147
2024
-
[24]
Symp, 2024.doi:10.14722/ndss.2024.23216
C.Fung,E.Zeng,L.Bauer,Attributionsforml-basedicsanomalydetection:Fromtheorytopractice,in:Proc.31stNetw.Distrib.Syst.Secur. Symp, 2024.doi:10.14722/ndss.2024.23216
2024
- [25]
-
[26]
Hwang, T
C. Hwang, T. Lee, E-sfd: Explainable sensor fault detection in the ics anomaly detection system, IEEE Access 9 (2021) 140470–140486. doi:10.1109/ACCESS.2021.3119573
2021
-
[27]
C. Tang, L. Xu, B. Yang, Y. Tang, D. Zhao, Gru-based interpretable multivariate time series anomaly detection in industrial control system, Computers & Security 127 (2023) 103094.doi:10.1016/j.cose.2023.103094
2023
-
[28]
Á.L.PeralesGómez,L.FernándezMaimó,A.HuertasCeldrán,F.J.GarcíaClemente,Aninterpretablesemi-supervisedsystemfordetecting cyberattacksusinganomalydetectioninindustrialscenarios,IETInformationSecurity17(4)(2023)553–566.doi:10.5167/uzh-255604
2023 doi
-
[29]
A. P. Mathur, N. O. Tippenhauer, [dataset] swat: A water treatment testbed for research and training on ics security, in: 2016 international workshop on cyber-physical systems for smart water networks (CySWater), IEEE, 2016, pp. 31–36
2016
-
[30]
Á. L. Perales Gómez, L. Fernández Maimó, A. Huertas Celdrán, F. J. García Clemente, Madics: A methodology for anomaly detection in industrial control systems, Symmetry 12 (10) (2020) 1583.doi:10.3390/sym12101583. First Author et al.:Preprint submitted to ElsevierPage 23 of 23
2020 doi
Reviewed August 7, 2026 · model on record in the stance chip above.
Discussion (0). Sign in to comment.