REVIEW 4 major objections 5 minor 1 cited by
A Data-Based Architecture for Flight Test without Test Points
T0 review · 4 major / 5 minor · reviewed 2026-08-07 · deepseek-v4-flash
Pith's one-line read The paper claims that a flight-test architecture can eliminate test points: a Gaussian-process reduced-order model, seeded by a physics-based prior and updated with unconstrained maneuver data, predicts T-38 short-period frequency within…
desk verdict The architecture is a real idea; the T-38 demo's headline numbers likely reflect the A-7 prior more than the data. read the letter →
The pith
A machine-rendered reading of the paper's core claim, the machinery that carries it, and where it could break.
The reading
What carries the argument
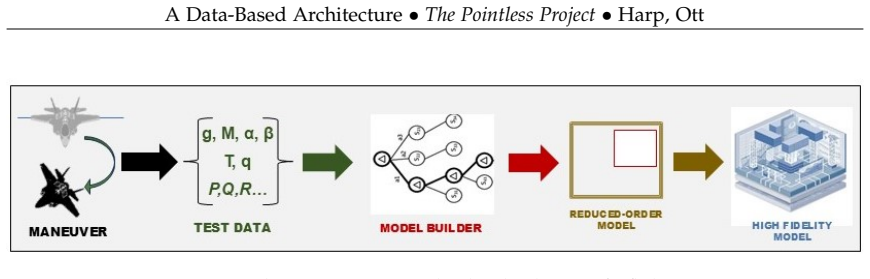
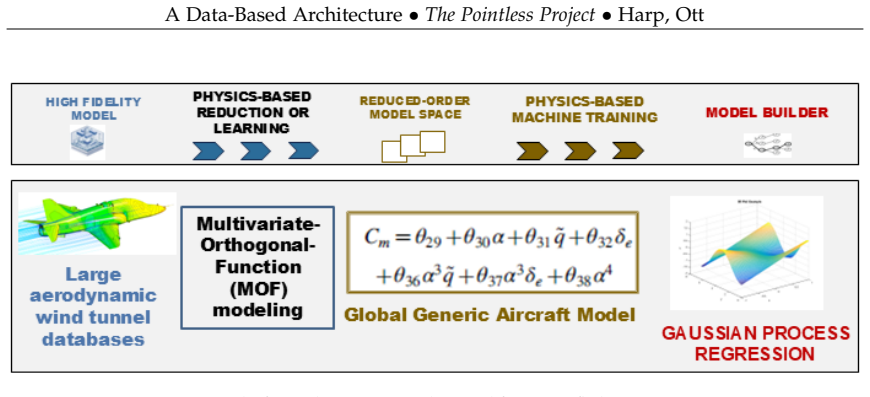
The load-bearing object is a Gaussian process, a distribution over functions updated by observed data, defined over the map from aircraft state to pitching moment coefficient, with a physics-based mean function drawn from a generic aerodynamic model and a neural-network kernel controlling smoothness. The posterior mean is differentiable, so its gradients evaluated at trim conditions give the stability derivatives that enter the short-period frequency and damping formulas. The supporting procedural machinery is the two-stage architecture: offline, a reduced-order model space is built from a high-fidelity model and a model builder is trained on it; online, flight data update the model builder in near real time, and the refined reduced-order model can feed back to update the high-fidelity model. Empirically fitted trim functions for angle of attack and stabilator deflection as functions of dynamic pressure are what convert arbitrary maneuver data into local derivative evaluations at comparable flight conditions.
What would settle it
Rerun the same Gaussian process pipeline on the same rollercoaster data with the generic aerodynamic mean function replaced by a constant mean and by the aerodynamic model of a second, unrelated aircraft, and also with the input data low-pass filtered below 0.0036 Hz. If the recovered T-38C short-period frequency and damping curves shift by more than the paper's reported 5% and 11% margins, the recovery of the high-frequency mode is attributable to the prior rather than to the flight data.
Extended reading notes
Core claim
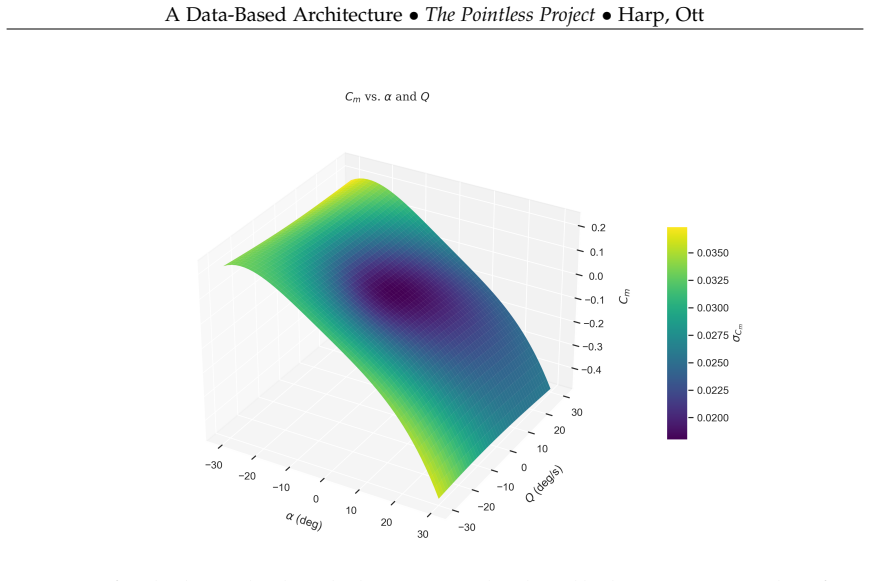
The central claim, stated on the paper's own terms, is that the fundamental output of developmental flight test should be a direct representation of the physics of the system under test, obtained by inverting the model-test-validate cycle. The demonstration is a single Gaussian-process hypersurface mapping aircraft state (Mach, density, dynamic pressure, body rates, angle of attack, stabilator deflection) to pitching moment coefficient, initialized with the generic aerodynamic mean function of a similar but different aircraft (the A-7) and updated with roughly five minutes of unconstrained rollercoaster data whose input energy is about 1% of the short-period frequency. Posterior differentiation at experimentally determined trim conditions recovers stability derivatives, and a second-order equivalent system then yields short-period frequency and damping as functions of dynamic pressure and Mach. The paper reports that this one function predicts short-period frequency to within 5% of the error internal to the historical record for any dynamic pressure, and damping to within 11% for any dynamic pressure and Mach combination, and that the recovered parameters agree with a published system-identification estimate at 0.7 Mach and 32,000 feet. The authors attribute the recovery of high-frequency modes from low-frequency data to the physics-based prior, explicitly as a hypothesis.
Load-bearing premise
The entire demonstration rests on the hypothesis that a physics-based prior, in the form of a generic aerodynamic mean function, lets a Gaussian process recover high-frequency short-period behavior from rollercoaster data whose input energy is near 0.0036 Hz, about 1% of the short-period frequency, so that if this hypothesis is false, the extracted stability derivatives and frequency and damping curves reflect the prior, not the data.
Editorial extensions
If this is right
- Test points disappear as execution requirements: data collected outside databands and tolerances refine the reduced-order model rather than being discarded, which the paper estimates could have accelerated one large program by a factor of six.
- The output of a flight-test campaign is a compact, differentiable, physics-based reduced-order model with quantified uncertainty at every point, not a series of spot-check comparisons.
- A single hypersurface generated from about five minutes of low-frequency rollercoaster data predicts T-38C short-period frequency within 5% and damping within 11% of the error internal to the historical record, across dynamic pressure and Mach without dedicated test points.
- Because the hypersurface embeds dynamic-pressure and Mach dependence implicitly, stability derivatives and short-period parameters can be evaluated at any as-flown condition and updated after each maneuver in near real time.
- The refined reduced-order model can be traced back to update the original high-fidelity model, so validation happens simultaneously with model refinement.
Reading between the lines
- Beyond the paper: the decisive check of the physics-based prior hypothesis is to rerun the pipeline with a constant mean function and with a different generic aircraft as the prior; if the recovered frequency and damping curves move by more than the claimed 5% and 11%, the curves are being supplied by the prior, not the data.
- Beyond the paper: the demonstrated error metric compares the new curve to the scatter among historical estimates, not to an absolute ground truth; an independent, dedicated maneuver on the same T-38C airframe at the same trim conditions would be the stronger validation.
- Beyond the paper: the architecture turns maneuver planning into optimal experimental design, since flight time should be spent where the posterior variance of the learned hypersurface is largest.
- Beyond the paper: the slogan that all data are good data is conditional on the data carrying information; a perfectly steady trim record should barely move the posterior, and the model's own uncertainty would reveal whether a maneuver actually constrained the short-period dynamics.
Editorial analysis
A structured set of objections, weighed in public.
Referee Report
Summary. The paper proposes a 'point-less' flight test architecture intended to invert the traditional model-test-validate cycle. In this architecture, a Gaussian Process Regression (GPR) model with a physics-based mean function (the A-7E Morelli aerodynamic model) ingests unconstrained, low-frequency 'rollercoaster' maneuver data from a single T-38C sortie. The resulting differentiable hypersurface for the pitching moment coefficient Cm is differentiated at trim conditions to obtain stability derivatives, which are then used to compute short-period frequency and damping as continuous functions of dynamic pressure and Mach. These curves are compared against consolidated historical T-38 data from four sources spanning 1961-2024. The authors claim the frequency curve matches the historical record to within 5% of its internal error and the damping curves to within 11%, concluding that the architecture can eliminate test points and yield a refined reduced-order model from arbitrary 'as-flown' data.
Significance. If the central claim is sustained, the paper would make a noteworthy contribution: it offers a concrete, data-driven alternative to the test-point paradigm, with the potential to reduce the number of required maneuvers and to reuse data that would traditionally be discarded. Credit is due for collecting and presenting actual T-38C flight test data, for consolidating a historically scattered set of comparison points, and for framing the inversion of the model-test-validate cycle in a clear way. However, the demonstration as presented has several load-bearing gaps: the GP hyperparameters and noise variance are not reported, the substitution M_alpha_dot = M_q/3 is unjustified, no uncertainty is propagated from the GP posterior to the derived short-period quantities, and the paper itself labels as a hypothesis the key mechanism by which low-frequency data are claimed to recover high-frequency short-period behavior. The high-dynamic-pressure region of Table 2 also contradicts the headline accuracy claim. These issues mean that the proof-of-concept is plausible but not yet established.
major comments (4)
- [Sec. 4.2.2, Eqs. (19)-(20)] The Gaussian process kernel hyperparameters and the noise variance ν are never reported. The posterior mean in Eq. (25) is a weighted combination of the A-7 mean function and the flight data, with the relative weight controlled by ν through A = (K + νI)^(-1)(y - m(X)). Without reporting ν (and any kernel parameters), the reader cannot assess whether the posterior is data-dominated or prior-dominated. Furthermore, although the paper emphasizes uncertainty quantification, the short-period results in Eqs. (28)-(29) are computed from the deterministic posterior mean gradient in Eq. (27) with no propagation of the posterior covariance Σ* from Eq. (16). The claimed uncertainty quantification therefore does not extend to the headline quantities ωSP and ζSP.
- [Sec. 4.3.3, Eq. (29)] The replacement M_alpha_dot = M_q/3 is introduced without derivation, citation, or sensitivity analysis, yet ζSP depends directly on this term through Eq. (29). Since the paper's central quantitative claim concerns damping, this substitution is load-bearing. The authors should justify the factor (for example, by providing a reference, by identifying M_alpha_dot from a maneuver that actually excites it, or by demonstrating that the final results are insensitive to reasonable variations in this factor).
- [Sec. 4.4, Table 2 and Figs. 12-14] The summary claim that the method predicted short-period frequency 'to within 5% of the error internal to the historical record' and damping 'to within 11%' is not supported across all dynamic pressure regions. In the high-dynamic-pressure row of Table 2, the prediction error for ωSP is 30.2% versus 25.6% for the historical record (4.6 percentage points worse), and for ζSP it is 26.3% versus 15.8% (10.5 percentage points worse). These are the largest discrepancies in the table and are not explained. The conclusion that the method 'exceeded the consistency of the historical record' is only true for the moderate and low dynamic pressure regions. The paper should either restrict its claim, report confidence intervals on the error metrics, or provide a data-region explanation for why performance degrades at high dynamic pressure.
- [Sec. 4.4, Eq. (25) and the rollercoaster excitation] The paper itself labels as a hypothesis the recovery of high-frequency short-period modes from 0.0036 Hz rollercoaster input. This is a critical issue because the posterior mean µ(x) = m(x) + k(x,X)^T A is a prior plus a data correction, and during a rollercoaster α and Q are strongly correlated and slowly varying. Such data can constrain only a low-frequency combination of Cmα and CmQ, not the individual derivatives that enter Eqs. (28)-(29). The separation between these derivatives is largely supplied by the A-7 mean function. To support the claim that Figs. 12-14 represent a data-refined T-38 ROM rather than a projection of the A-7 prior, the authors should plot the prior-only short-period curves alongside the posterior curves and quantify the magnitude of the data correction. Without this, the central distinction between 'learning from the data' and 'inheriting the prior' is not demonstrated.
minor comments (5)
- [Abstract and Sec. 4.4] The phrase 'within 5% of the error internal to the historical record' is ambiguous: Table 2 reports differences in percentage points, not relative percentages. The abstract should define the metric clearly (e.g., 'within 5 percentage points of the historical internal error').
- [Sec. 4.4] The historical comparison data are plotted without uncertainty bars, and the GP-derived curves are shown without posterior uncertainty bands, even though the GPR framework provides such bands. Adding error bars to Figs. 12-14 would make the comparison much more informative.
- [Sec. 4.1] The text says the rollercoaster is an 'arbitrary' maneuver, yet the authors targeted particular Mach and altitude combinations for historical comparison. The qualification in footnote 7 is helpful, but the main text should be consistent about what 'arbitrary' means in this context.
- [Sec. 4.3.1, Eqs. (21)-(22)] The trim functions αtrim(qbar) and δetrim(qbar) are fitted to data with coefficients a, b, c, d, but no fit quality or uncertainty is reported. Since these functions determine the trim state at which all derivatives are evaluated, reporting their goodness of fit would strengthen the analysis.
- [Throughout] There are several typos and formatting artifacts (e.g., 'T est' in the title, 'datbands' for 'databands', 'condescension' in Sec. 2.4). A careful proofread would improve readability.
Circularity Check
No significant circularity: the central short-period predictions are checked against independent historical data, and the only concrete circular step is a minor in-sample Cm fit presented with prediction language.
-
fitted input called prediction
[Section 4.4, Figure 11 (training setup in Section 4.2.2)]
"The true values of Cm, calculated using equation 3, are represented by the dashed line, serving as the ground truth. The solid line denotes the GP prediction, accompanied by a shaded region that captures the 95% confidence interval, representing the model's uncertainty in its predictions."
The GP was updated using observed data whose targets y(i) are noisy observations of Cm (Section 4.2.2), and the dashed 'ground truth' in Figure 11 is Cm computed by equation 3 from the same maneuver. The comparison therefore shows the posterior mean against its own training targets: the close agreement is an in-sample fit, not a forecast of unseen data. This step is not load-bearing, because the central short-period result is evaluated against four external historical sources (SIDPAC, CIFER, TPS doublets, AFFTC 1961) rather than against this plot.
full rationale
Walking the derivation chain: the forward process uses the external A-7 Morelli generic aerodynamic model [9] as the GP mean function, the GP update equations (15)-(16) are standard, and the short-period formulas (28)-(29) are textbook second-order approximations. The posterior derivative decomposition of Eq. (27) into a prior gradient plus a data correction is exact, not circular. Crucially, the reported omega_SP(qbar) and zeta_SP(qbar, Mach) curves are not fit to the historical omega_SP/zeta_SP values: the historical record is used only to target rollercoaster dynamic pressures and as a final benchmark, so the 'within 5%/11% of historical internal error' claim is an external comparison. The paper contains no load-bearing self-citation chain and no uniqueness theorem imported from the authors. The main caveat is identifiability, not circularity: a rollercoaster excites AOA oscillations at 0.0036 Hz, about 1% of the short-period frequency, so the data may not separately constrain Cm_alpha and Cm_Q; if the data correction in Eq. (27) is uninformative in those directions, the extracted derivatives and hence omega_SP and zeta_SP are inherited from the A-7 prior. The authors explicitly label this mechanism only as a hypothesis ('We hypothesize that we were able to reproduce high-frequency modes with low-frequency experimental content due to our imposition of a physics-based prior'), and they do not report GP hyperparameters, noise variance nu, or a prior-only ablation, leaving the data-versus-prior attribution uncontrolled. That is a validation gap to weigh under correctness risk, not a circular step. The single concrete circularity is Figure 11, where GP 'prediction' is compared with the same Cm values used for training; this is minor and does not support the paper's central claim by itself.
Assumptions & free parameters
free parameters (4)
- Gaussian process kernel hyperparameters =
not reported
- Gaussian process noise variance ν =
not reported
- Trim function coefficients a, b, c, d =
not reported
- Short-period damping substitution coefficient =
1/3
assumptions (5)
- standard math Rigid-body equations of motion (1-3) with standard notation
- domain assumption Small perturbation, linearization assumptions for short period
- ad hoc to paper A-7E generic aerodynamic model is a valid mean function for T-38C GPR
- ad hoc to paper Physics-based prior allows recovery of high-frequency modes from low-frequency (0.0036 Hz) data
- domain assumption 2-DOF linear short-period model (eqs 28-29) adequately represents the aircraft despite the paper's claim that 'there is no such thing as the short period'
Cite this review
Pith. "Pith review of A Data-Based Architecture for Flight Test without Test Points." pith.science (2026). https://pith.science/paper/45L2BNMC
@misc{pith2026250602315,
  author       = {Pith},
  title        = {Pith review of: A Data-Based Architecture for Flight Test without Test Points},
  year         = {2026},
  howpublished = {\url{https://pith.science/paper/45L2BNMC}},
  note         = {Machine review of arXiv:2506.02315}
}
read the original abstract
The justification for the "test point" derives from the test pilot's obligation to reproduce faithfully the pre-specified conditions of some model prediction. Pilot deviation from those conditions invalidates the model assumptions. Flight test aids have been proposed to increase accuracy on more challenging test points. However, the very existence of databands and tolerances is the problem more fundamental than inadequate pilot skill. We propose a novel approach, which eliminates test points. We start with a high-fidelity digital model of an air vehicle. Instead of using this model to generate a point prediction, we use a machine learning method to produce a reduced-order model (ROM). The ROM has two important properties. First, it can generate a prediction based on any set of conditions the pilot flies. Second, if the test result at those conditions differ from the prediction, the ROM can be updated using the new data. The outcome of flight test is thus a refined ROM at whatever conditions were flown. This ROM in turn updates and validates the high-fidelity model. We present a single example of this "point-less" architecture, using T-38C flight test data. We first use a generic aircraft model to build a ROM of longitudinal pitching motion as a hypersurface. We then ingest unconstrained flight test data and use Gaussian Process Regression to update and condition the hypersurface. By proposing a second-order equivalent system for the T-38C, this hypersurface then generates parameters necessary to assess MIL-STD-1797B compliance for longitudinal dynamics.
Figures


Figures from the paper (11 more)




Forward citations
Cited by 1 Pith paper
-
Real-Time Flight Test Maneuver Selection with Monte Carlo Tree Search
Shallow MCTS lookahead over GP variance reduction picks flight-test maneuvers with higher uncertainty reduction per unit fuel than greedy or fixed-card baselines in X-Plane simulation.
Reference graph
Works this paper leans on
-
[1]
Data-driven model reduction via operator inference for coupled aeroelastic flutter,
B. G. Zastrow, A. Chaudhuri, K. E. Willcox, A. Ashley, and M. Henson, “Data-driven model reduction via operator inference for coupled aeroelastic flutter,” AIAA SciTech, 2023. doi: https://doi.org/10.2514/6.2023-0330
-
[2]
V . Luquin, S. S. McCoy, O. R. Garcia, A. W. Latkin, and W. N. Hashii, “The new era of loads flight testing: Artificial intelligence (AI) in real-time envelope expansion testing,” in The Society of Flight Test Engineers Annual International Symposium, vol. 53rd, 2023
work page 2023
-
[3]
Test and evaluation—where the rubber meets the road in digital engineering,
E. Bjorkman and J. Grigaliunas, “Test and evaluation—where the rubber meets the road in digital engineering,” Defense Acquisition Magazine, Nov. 2021
work page 2021
-
[4]
T. R. Yechout, Introduction to Aircraft Flight Mechanics. AIAA, 2003
work page 2003
-
[5]
R. C. Nelson, Flight Stability and Automatic Control, 2d ed. McGraw-Hill, 1998
work page 1998
-
[6]
J. A. Grauer and E. A. Morelli, Eds., Introduction to the Advances in Aircraft System Identification from Flight Test Data, vol. 60, Virtual Collection 5, Journal of Aircraft, Sep. 2023
work page 2023
-
[7]
Outcome-based framework for online model validation and risk awareness,
J. Jurado and C. McGehee, “Outcome-based framework for online model validation and risk awareness,” in The Society of Flight Test Engineers European Chapter Symposium, 2023
work page 2023
-
[8]
Risk awareness: A new framework for risk management in flight test,
D. Wickert, “Risk awareness: A new framework for risk management in flight test,” in The Society of Experimental Test Pilots Annual Symposium, vol. 62nd, 2023. 26 Approved for public release: distribution unlimited. Originally published in the proceedings of the Society of Experimental Test Pilots’ 68th Annual Symposium; authors retain copyright. A Data-B...
work page 2023
Show all 21 references
-
[9]
Generic global aerodynamic model for aircraft,
J. A. Grauer and E. A. Morelli, “Generic global aerodynamic model for aircraft,” Journal of Aircraft, vol. 52, no. 1, Jan. 2015
2015
-
[10]
Global nonlinear aerodynamic modeling using multivariate orthogonal func- tions,
E. Morelli, “Global nonlinear aerodynamic modeling using multivariate orthogonal func- tions,” Journal of Aircraft, vol. 32, no. 2, pp. 270–277, 1995. doi: doi:10.2514/3.46712
1995 doi
-
[11]
Global nonlinear parametric modeling with application to f-16 aerodynamics,
E. Morelli, “Global nonlinear parametric modeling with application to f-16 aerodynamics,” in Proceedings of the 1998 American Control Conference, vol. 2, IEEE Publications, Jun. 1998
1998
-
[12]
Klein and E
V . Klein and E. Morelli,Aircraft System Identification: Theory and Practice . AIAA, 2006, pp. 27– 179, AIAA Education Series
2006
-
[13]
M. J. Kochenderfer and T. A. Wheeler, Algorithms for Optimization. MIT Press, 2019
2019
-
[14]
Limited aerodynamic system identification of the T-38A using SIDPAC software,
M. J. Shepherd, T. R. Jorris, and W. R. Gray, “Limited aerodynamic system identification of the T-38A using SIDPAC software,” in 2010 IEEE Aerospace Conference, IEEE, 2010, pp. 1–10
2010
-
[15]
T-38c transfer function modeling in system identification using comprehensive identification frequency response (cifer),
C. Welborn, “T-38c transfer function modeling in system identification using comprehensive identification frequency response (cifer),” M.S. thesis, California Polytechnic State University, San Luis Obispo, CA, Aug. 2020
2020
-
[16]
T-38c limited flight test and evaluation of flying qualities,
H. K. T. Team, “T-38c limited flight test and evaluation of flying qualities,” United States Air Force Test Pilot School, Edwards AFB, CA, Tech. Rep. TPS 23B, Jan. 2024
2024
-
[17]
T-38 peace patch i test plan, longitudinal and lateral-directional,
H. P . T. Team, “T-38 peace patch i test plan, longitudinal and lateral-directional,” United States Air Force Test Pilot School, Edwards AFB, CA, Tech. Rep. TPS 23B, Jan. 2024
2024
-
[18]
T-ssa cateoory ii stability and control tests,
W. A. Lusby and N. J. Hanks, “T-ssa cateoory ii stability and control tests,” Air Force Flight Test Center, Edwards AFB, CA, Tech. Rep. AFFTC-TR-61-15, Aug. 1961, Retrieved from DTIC
1961
-
[19]
Gray, “Sweeps,” Email to the author from Chief Test Pilot USAF Test Pilot School, Sep
W. Gray, “Sweeps,” Email to the author from Chief Test Pilot USAF Test Pilot School, Sep. 2024
2024
-
[20]
Toward real-time computational-fluid-dynamics- based aeroelastic computations using a database of reduced-order information,
D. Amsallem, J. Cortial, and C. Farhat, “Toward real-time computational-fluid-dynamics- based aeroelastic computations using a database of reduced-order information,” AIAA Journal, vol. 48, no. 9, pp. 2029–2037, Sep. 2010. doi: 10.2514/1.J050233
2010 doi
-
[21]
A nonparametric probabilistic approach for quantifying uncertain- ties in low-dimensional and high-dimensional nonlinear models,
C. Soize and C. Farhat, “A nonparametric probabilistic approach for quantifying uncertain- ties in low-dimensional and high-dimensional nonlinear models,” Int. J. Numer. Meth. Engng, vol. 109, pp. 837–888, 2017. doi: 10.1002/nme.5312. Approved for public release: distribution ...
2017 doi
Reviewed August 7, 2026 · model on record in the stance chip above.
Discussion (0). Sign in to comment.