REVIEW 4 major objections 5 minor 1 cited by
A Pretrained Probabilistic Transformer for City-Scale Traffic Volume Prediction
T0 review · 4 major / 5 minor · reviewed 2026-08-07 · deepseek-v4-flash
Pith's one-line read A transformer that treats traffic volume as a probabilistic sum of vehicle trajectories predicts city-scale volumes accurately from just 20% of sensors, after pretraining on simulated traffic.
desk verdict TrafficPPT has a promising architecture but the edge-volume conversion in Eqs. (3)-(4) is mathematically biased, so the reported numbers do not support the central claims. read the letter →
The pith
A machine-rendered reading of the paper's core claim, the machinery that carries it, and where it could break.
The reading
What carries the argument
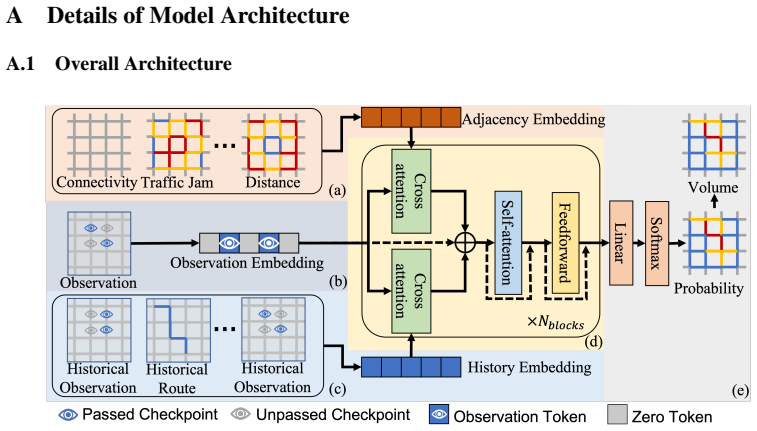
The central object is the trajectory probability tensor $Y\in[0,1]^{B\times T\times V}$, assigning every vehicle a probability of being at every node at every time step; traffic volume is read off as the expectation of edge occupancy over this tensor. The volume identity that carries the argument is Eqs. (3)-(4): per-vehicle edge occupancy is $\dot{Y}[b,t,i]=Y[b,t,o_i]Y[b,t+1,d_i]+Y[b,t,o_i]Y[b,t+1,o_i]$ for edge $e_i=(o_i,d_i)$, capturing both a transition from origin to destination and a dwell at the origin, and the volume on edge $i$ at time $t$ is $\sum_b \dot{Y}[b,t,i]/\sum_j \dot{Y}[b,t,j]$, the normalization forcing each vehicle's total occupancy mass to one. The objective that makes the machinery trainable is the cross-entropy loss of Eq. (2) against one-hot complete trajectories under BERT-style random masking, which reduces the KL-divergence objective exactly when ground-truth trajectories are available. The architecture is a transformer with multi-view attention: observation tokens serve as queries against road-network adjacency tokens via multi-query attention and against historical trajectory tokens via multi-head attention, followed by self-attention and a feed-forward block, with all heterogeneous inputs embedded into a shared latent space.
What would settle it
Apply Eqs. (3)-(4) to the one-hot ground-truth trajectories in the Jinan test set and compare the recovered volumes with the true per-road counts: since the dwell term credits every outgoing edge of a vehicle that is waiting at a node, the recovered counts will diverge from the true counts, and the magnitude of that divergence measures how much of the reported error stems from the conversion itself rather than from the learned probabilities.
Extended reading notes
Core claim
The paper's central claim is that city-scale traffic volume is the aggregate of many stochastic vehicle trajectories, and that a transformer can learn the per-vehicle probability distributions and convert them into accurate volumes even when observations are extremely incomplete. Formally, the model outputs a trajectory probability tensor $Y[b,t,v]$, the probability that vehicle $b$ occupies node $v$ at time step $t$, trained by minimizing cross-entropy against one-hot complete trajectories under random masking (a simplification of the KL-divergence objective of Eq. (1) when the ground truth is complete). Edge occupancy is derived through Eqs. (3)-(4): the probability that a vehicle occupies edge $e_i=(o_i,d_i)$ at time $t$ is the product of its origin-node and destination-node probabilities plus a dwell term, $\dot{Y}[b,t,i]=Y[b,t,o_i]\,Y[b,t+1,d_i]+Y[b,t,o_i]\,Y[b,t+1,o_i]$, and volumes are the per-edge sums over vehicles normalized so each vehicle contributes a total weight of one. With this machinery and a two-stage pretrain-on-simulation/fine-tune-on-city pipeline, TrafficPPT reports MAE values roughly half those of Cam-Traj-Rec and Traj2Traj at a 50% checkpoint ratio, and at 20% observation it already beats both baselines at their 50% setting.
Load-bearing premise
The load-bearing premise is that representing edge occupancy by multiplying origin and destination node probabilities, adding a dwell term (Eq. (3)), and normalizing each vehicle's contributions to sum to one (Eq. (4)) yields unbiased traffic volumes, a heuristic the paper asserts without proof.
Editorial extensions
If this is right
- At a 20% checkpoint ratio, TrafficPPT reports lower MAE than Cam-Traj-Rec and Traj2Traj achieve with 50% of checkpoints, so cities with very sparse camera coverage could still obtain accurate road-level volumes.
- The pretraining/fine-tuning pipeline makes the model data-efficient: fine-tuning converges faster and to a lower loss than training from scratch, and the shared backbone is reused across cities with only the embedding layers retrained.
- Because inference is non-autoregressive and produces all road volumes in one pass, inference is far cheaper than the baselines (3.35 s versus 41.5-93.2 s on Boston), which matters for real-time city-scale deployment.
- The probabilistic output represents the uncertainty from unobserved traffic, giving operators not just a point forecast but a distribution over possible uses of each road.
Reading between the lines
- A test the paper does not run: applying Eqs. (3)-(4) to the one-hot ground-truth trajectories of a test set and comparing against the true per-road counts would isolate how much of the reported error comes from the edge-conversion heuristic rather than from the learned trajectory probabilities.
- The per-vehicle normalization in Eq. (4) makes every vehicle contribute exactly one unit of occupancy at every time step, which presumes all vehicles are present on the network for the whole horizon; in real data with trips starting and ending inside the window, volumes at boundary roads and time steps would be biased even if trajectory probabilities were perfect.
- The current experiments pretrain on simulated trajectories for the same two road networks used for fine-tuning and hold out no third city, so the paper's claim that the pretrained model adapts to genuinely unseen cities is not yet directly tested.
- The same recipe — learn per-agent occupancy distributions, then sum them into counts — transfers to other sparsely observed flow problems, such as pedestrian counts or shared-bike repositioning, where per-agent trajectory probabilities are learnable but dense coverage is unavailable.
Editorial analysis
A structured set of objections, weighed in public.
Referee Report
Summary. The paper proposes TrafficPPT, a transformer-based model that predicts city-scale traffic volume by first estimating per-vehicle probability distributions over road-network nodes and then converting these node probabilities into edge-level volume via a normalization heuristic. The model is pretrained on simulated trajectory data and fine-tuned on target cities, and the authors report that TrafficPPT outperforms two baselines (Cam-Traj-Rec and Traj2Traj) on Boston and Jinan, especially under sparse observations. The central claim is that with only 20% observation ratio, TrafficPPT already beats the baselines at 50%.
Significance. If correct, the proposed framework would be a valuable step toward uncertainty-aware, data-efficient city-scale traffic volume estimation, combining a probabilistic trajectory model with a pretraining/fine-tuning paradigm. The architecture is reasonably detailed, the idea of aggregating probabilistic trajectories is interesting, and the authors state that code will be open. However, the significance is substantially undercut by a mathematical flaw in the volume-conversion equations and by an experimental evaluation that relies on simulated data for one of the two cities, uses only two baselines, and does not report variance or significance.
major comments (4)
- [Sec. 3.2, Eqs. (3)-(4)] The volume conversion is biased even when the learned trajectory distribution equals the ground-truth one-hot distribution. For a vehicle dwelling at node o for K-1 steps before traversing edge e=(o,d), Eq. (3) gives Y[t,o]*Y[t+1,o] = 1 for every outgoing edge of o during each dwell step, not just for e. Eq. (4) then normalizes, assigning 1/deg(o) to each outgoing edge, so the true edge receives only 1+(K-1)/deg(o) instead of K, and phantom volume is placed on other outgoing edges. Because outdegree and dwell duration vary across the city, this bias is spatially nonuniform and cannot be expected to cancel. The training loss in Eq. (2) supervises node-level probabilities, not edge volumes, so the error is not corrected by training. This is a load-bearing flaw: the reported MAE numbers rest on this estimator.
- [Sec. 4.1.1 and Abstract] The abstract and introduction claim evaluation on "real-world datasets," but the Boston road network and trajectories are generated by a simulator, with 500,000 simulated training trajectories and 10,000 simulated test trajectories. Only the Jinan dataset is real. The claim of city-scale validation on real data is therefore overstated, and the Boston results should be described as simulation-based or the experiments should be rerun on real data.
- [Sec. 4.1.2 and Sec. 3.4] The pretraining described in Sec. 3.4 uses simulated data from multiple cities and an advanced simulator, but Sec. 4.1.2 states that "we use only the vanilla simulator during pretraining and do not include data from additional cities." Thus the multi-city pretraining contribution is not actually tested in the experiments; the comparison in Fig. 7 only shows fine-tuning versus training from scratch on the same data. The paper should either include multi-city pretraining experiments or temper the claims about generalizable pretraining.
- [Sec. 4.2, Table 1] Only two baselines are compared, and although each experiment is repeated three times, no standard deviations, confidence intervals, or significance tests are reported. The strong claim that TrafficPPT at 20% observation beats baselines at 50% is based on point estimates; with only two competitors and no error bars, this finding is not established.
minor comments (5)
- [Sec. 4.2.2 and Fig. 5] The heading and figure caption contain the typo "V olume" instead of "Volume."
- [Sec. 4.4] The first sentence is duplicated: "We conduct an ablation study to assess the impact of various We conduct an ablation study to evaluate the impact of various computation-efficient mechanisms."
- [Appendix B, Table 3] Table 3 is garbled: the Jinan row appears incomplete, and the column headers are ambiguous. Please reformat the table so each setting is clearly associated with the correct city and hyperparameter.
- [References] Several references (e.g., [3], [4], [17], [19]) are cited as arXiv preprints without arXiv identifiers, making them hard to locate. Please provide complete bibliographic information.
- [Sec. 3.2] In Eq. (3), the notation Y is used for the predicted distribution, but Y was previously defined as the ground-truth one-hot tensor; use q_theta consistently to distinguish prediction from ground truth.
Circularity Check
No significant circularity: volumes are a fixed transform (Eqs. 3-4) of trajectory probabilities trained via Eq. (2); no fitted parameter is renamed as a prediction and no load-bearing self-citation exists.
full rationale
The paper's derived quantity, the traffic volume V ol[i,t], is defined in Eq. (4) as the normalization over edges of the edge-occupancy probabilities ˙Y constructed in Eq. (3) from the predicted node-trajectory tensor Y. The tensor Y is trained by the cross-entropy in Eq. (2) against one-hot ground-truth node trajectories, and no volume term appears in the loss. The volume is therefore a transparent, deterministic transform of the model output rather than a fitted quantity relabeled as a prediction, and there is no fitted constant or prior distribution that could make the sparse-data comparisons forced by construction. The reference list contains no self-citations by Shen, Pan, or Xue, so there is no load-bearing self-citation or imported uniqueness theorem. Two substantive weaknesses do not meet the circularity bar and should be treated as correctness and validation risks. First, Eq. (3)-(4) is internally inconsistent even at the global optimum of the loss: for a one-hot dwell step with Y[t,o]=Y[t+1,o]=1, the dwell term contributes 1 to every outgoing edge of o, so after normalization each outgoing edge receives 1/deg(o) instead of the true edge receiving 1; perfect trajectory estimation therefore produces degree- and dwell-dependent volume bias. Second, Section 4.1.2 states 'we use only the vanilla simulator during pretraining and do not include data from additional cities,' which contradicts the Abstract's claim of pretraining 'spanning multiple urban scenarios' and means the Boston evaluation, itself simulator-generated, does not test cross-city generalization. Section 4.4 also contains a duplicated sentence ('We conduct an ablation study to assess the impact of various We conduct an ablation study'). These are correctness, scope, and editing concerns, not cases where an output equals its input by definition or construction.
Assumptions & free parameters
free parameters (5)
- Maximum time steps T =
60
- Number of historical trajectories N =
4
- Default checkpoint observation ratio alpha =
0.5
- Discretization factor for continuous road attributes =
10 or 20
- Model architecture hyperparameters =
Boston: 8 blocks, 64 hidden, 16 heads; Jinan: 30 blocks, 30 hidden, 50 heads (as reported)
assumptions (5)
- domain assumption Vehicle movements are independent probabilistic processes over the road network.
- domain assumption Ground truth complete trajectories are available for training with one-hot labels.
- ad hoc to paper Edge occupancy probability factorizes as origin node probability times destination node probability plus a dwell term (Eq. 3).
- ad hoc to paper Per-vehicle volume contributions are normalized to sum to 1 (Eq. 4).
- domain assumption Simulator-generated shortest-path trajectories approximate real traffic patterns for pretraining.
Cite this review
Pith. "Pith review of A Pretrained Probabilistic Transformer for City-Scale Traffic Volume Prediction." pith.science (2026). https://pith.science/paper/46QVDP66
@misc{pith2026250602654,
  author       = {Pith},
  title        = {Pith review of: A Pretrained Probabilistic Transformer for City-Scale Traffic Volume Prediction},
  year         = {2026},
  howpublished = {\url{https://pith.science/paper/46QVDP66}},
  note         = {Machine review of arXiv:2506.02654}
}
read the original abstract
City-scale traffic volume prediction plays a pivotal role in intelligent transportation systems, yet remains a challenge due to the inherent incompleteness and bias in observational data. Although deep learning-based methods have shown considerable promise, most existing approaches produce deterministic point estimates, thereby neglecting the uncertainty arising from unobserved traffic flows. Furthermore, current models are typically trained in a city-specific manner, which hinders their generalizability and limits scalability across diverse urban contexts. To overcome these limitations, we introduce TrafficPPT, a Pretrained Probabilistic Transformer designed to model traffic volume as a distributional aggregation of trajectories. Our framework fuses heterogeneous data sources-including real-time observations, historical trajectory data, and road network topology-enabling robust and uncertainty-aware traffic inference. TrafficPPT is initially pretrained on large-scale simulated data spanning multiple urban scenarios, and later fine-tuned on target cities to ensure effective domain adaptation. Experiments on real-world datasets show that TrafficPPT consistently surpasses state-of-the-art baselines, particularly under conditions of extreme data sparsity. Code will be open.
Figures


Figures from the paper (8 more)




Forward citations
Cited by 1 Pith paper
-
AGNFormer I: Reconstruction of AGN spectra using a probabilistic transformer model
An uncertainty-aware transformer reconstructs masked AGN broad lines and spectral halves with 4-16% flux errors and beats eleven purpose-built Lyα-reconstruction algorithms on a blind benchmark.
Reference graph
Works this paper leans on
-
[1]
Eleni I Vlahogianni, Matthew G Karlaftis, and John C Golias. Short-Term Traffic Forecast- ing: Where We Are And Where We’re Going.Transportation Research Part C: Emerging Technologies (TRC), 2014
work page 2014
-
[2]
Yisheng Lv, Yanjie Duan, Wenwen Kang, Zhengxi Li, and Fei-Yue Wang. Traffic Flow Prediction With Big Data: A Deep Learning Approach.IEEE Transactions on Intelligent Transportation Systems (T-ITS), 2014
work page 2014
-
[3]
Bing Yu, Haoteng Yin, and Zhanxing Zhu. Spatio-Temporal Graph Convolutional Networks: A Deep Learning Framework For Traffic Forecasting.arXiv, 2017
work page 2017
-
[4]
Diffusion Convolutional Recurrent Neural Network: Data-Driven Traffic Forecasting.arXiv, 2017
Yaguang Li, Rose Yu, Cyrus Shahabi, and Yan Liu. Diffusion Convolutional Recurrent Neural Network: Data-Driven Traffic Forecasting.arXiv, 2017
work page 2017
-
[5]
Shen Fang, Xianbing Pan, Shiming Xiang, and Chunhong Pan. Meta-MSNet: Meta-Learning Based Multi-Source Data Fusion For Traffic Flow Prediction.IEEE Signal Processing Letters (SPL), 2020
work page 2020
-
[6]
Traffic Flow Matrix-Based Graph Neural Network With Attention Mechanism For Traffic Flow Prediction
Jian Chen, Li Zheng, Yuzhu Hu, Wei Wang, Hongxing Zhang, and Xiping Hu. Traffic Flow Matrix-Based Graph Neural Network With Attention Mechanism For Traffic Flow Prediction. Information Fusion (IF), 2024
work page 2024
-
[7]
Jing Chen, ZhaoChong Zhang, GuoWei Yang, Wei Wang, JiaJia Zhang, and ChunHui Wu. Vehicle Flow Prediction At Checkpoint Considering Trajectory Based On Convolutional Long Short-Term Memory Network. InAsia Symposium on Image Processing (ASIP), 2023
work page 2023
-
[8]
City-Scale Vehicle Trajectory Data From Traffic Camera Videos.Scientific Data (Sci
Fudan Yu, Huan Yan, Rui Chen, Guozhen Zhang, Yu Liu, Meng Chen, and Yong Li. City-Scale Vehicle Trajectory Data From Traffic Camera Videos.Scientific Data (Sci. Data), 2023
work page 2023
Show all 41 references
-
[9]
PKET-GCN: Prior Knowledge Enhanced Time-Varying Graph Convolution Network For Traffic Flow Prediction
Yinxin Bao, Jiali Liu, Qinqin Shen, Yang Cao, Weiping Ding, and Quan Shi. PKET-GCN: Prior Knowledge Enhanced Time-Varying Graph Convolution Network For Traffic Flow Prediction. Information Sciences (INS), 2023
2023
-
[10]
Short-Term Traffic Flow Prediction Based On Spatio-Temporal Analysis And CNN Deep Learning.Transportmetrica A: Transport Science (Transport
Weibin Zhang, Yinghao Yu, Yong Qi, Feng Shu, and Yinhai Wang. Short-Term Traffic Flow Prediction Based On Spatio-Temporal Analysis And CNN Deep Learning.Transportmetrica A: Transport Science (Transport. A), 2019
2019
-
[11]
M-Mix: Pattern- wise Missing Mix For Filling The Missing Values In Traffic Flow Data.Neural Computing and Applications (NCA), 2024
Xiaoyu Guo, Weiwei Xing, Xiang Wei, Weibin Liu, Jian Zhang, and Wei Lu. M-Mix: Pattern- wise Missing Mix For Filling The Missing Values In Traffic Flow Data.Neural Computing and Applications (NCA), 2024
2024
-
[12]
Deep Spatio-Temporal Residual Networks For Citywide Crowd Flows Prediction
Junbo Zhang, Yu Zheng, and Dekang Qi. Deep Spatio-Temporal Residual Networks For Citywide Crowd Flows Prediction. InProceedings of the AAAI Conference on Artificial Intelligence (AAAI), 2017
2017
-
[13]
Dynamic Spatial-Temporal Graph Convolutional Neural Networks For Traffic Forecasting
Zulong Diao, Xin Wang, Dafang Zhang, Yingru Liu, Kun Xie, and Shaoyao He. Dynamic Spatial-Temporal Graph Convolutional Neural Networks For Traffic Forecasting. InProceedings of the AAAI Conference on Artificial Intelligence (AAAI), 2019
2019
-
[14]
Dynamic Spatial-Temporal Representation Learning For Traffic Flow Prediction.IEEE Transactions on Intelligent Transportation Systems (IEEE T-ITS), 2020
Lingbo Liu, Jiajie Zhen, Guanbin Li, Geng Zhan, Zhaocheng He, Bowen Du, and Liang Lin. Dynamic Spatial-Temporal Representation Learning For Traffic Flow Prediction.IEEE Transactions on Intelligent Transportation Systems (IEEE T-ITS), 2020
2020
-
[15]
Spatio-Temporal Hybrid Graph Convolutional Network For Traffic Forecasting In Telecommunication Networks
Marcus Kalander, Min Zhou, Chengzhi Zhang, Hanling Yi, and Lujia Pan. Spatio-Temporal Hybrid Graph Convolutional Network For Traffic Forecasting In Telecommunication Networks. arXiv, 2020
2020
-
[16]
Urban Traffic Prediction From Mobility Data Using Deep Learning.IEEE Network (IEEE Netw.), 2018
Zhidan Liu, Zhenjiang Li, Kaishun Wu, and Mo Li. Urban Traffic Prediction From Mobility Data Using Deep Learning.IEEE Network (IEEE Netw.), 2018
2018
-
[17]
Learning Probabilistic Intersection Traffic Models For Trajectory Prediction.arXiv, 2020
Andrew Patterson, Aditya Gahlawat, and Naira Hovakimyan. Learning Probabilistic Intersection Traffic Models For Trajectory Prediction.arXiv, 2020. 10
2020
-
[18]
The Path Inference Filter: Model- Based Low-Latency Map Matching of Probe Vehicle Data.IEEE Transactions on Intelligent Transportation Systems (IEEE T-ITS), 2013
Timothy Hunter, Pieter Abbeel, and Alexandre Bayen. The Path Inference Filter: Model- Based Low-Latency Map Matching of Probe Vehicle Data.IEEE Transactions on Intelligent Transportation Systems (IEEE T-ITS), 2013
2013
-
[19]
On The Distribution Of Probe Traffic Volume Estimated From Their Footprints.arXiv, 2023
Kentaro Iio, Gulshan Noorsumar, Dominique Lord, and Yunlong Zhang. On The Distribution Of Probe Traffic Volume Estimated From Their Footprints.arXiv, 2023
2023
-
[20]
Explainable Trajectory Representation Through Dictionary Learning
Yuanbo Tang, Zhiyuan Peng, and Yang Li. Explainable Trajectory Representation Through Dictionary Learning. InACM International Conference on Advances in Geographic Information Systems (ACM SIGSPATIAL), 2023
2023
-
[21]
Long Short-Term Memory Neural Network For Traffic Speed Prediction Using Remote Microwave Sensor Data
Xiaolei Ma, Zhimin Tao, Yinhai Wang, Haiyang Yu, and Yunpeng Wang. Long Short-Term Memory Neural Network For Traffic Speed Prediction Using Remote Microwave Sensor Data. Transportation Research Part C: Emerging Technologies (Transp. Res. Part C), 2015
2015
-
[22]
T-GCN: A Temporal Graph Convolutional Network For Traffic Prediction.IEEE Transactions on Intelligent Transportation Systems (IEEE T-ITS), 2019
Ling Zhao, Yujiao Song, Chao Zhang, Yu Liu, Pu Wang, Tao Lin, Min Deng, and Haifeng Li. T-GCN: A Temporal Graph Convolutional Network For Traffic Prediction.IEEE Transactions on Intelligent Transportation Systems (IEEE T-ITS), 2019
2019
-
[23]
View Vertically: A Hierarchical Network For Trajectory Prediction Via Fourier Spectrums
Conghao Wong, Beihao Xia, Ziming Hong, Qinmu Peng, Wei Yuan, Qiong Cao, Yibo Yang, and Xinge You. View Vertically: A Hierarchical Network For Trajectory Prediction Via Fourier Spectrums. InEuropean Conference on Computer Vision (ECCV), 2022
2022
-
[24]
Recon- structing Transit Vehicle Trajectory Using High-Resolution GPS Data
Yuzhu Huang, Awad Abdelhalim, Anson Stewart, Jinhua Zhao, and Haris Koutsopoulos. Recon- structing Transit Vehicle Trajectory Using High-Resolution GPS Data. InIEEE International Conference on Intelligent Transportation Systems (ITSC), 2023
2023
-
[25]
Gpt-4 Technical Report.arXiv preprint arXiv:2303.08774, 2023
Josh Achiam, Steven Adler, Sandhini Agarwal, Lama Ahmad, Ilge Akkaya, Florencia Leoni Aleman, Diogo Almeida, Janko Altenschmidt, Sam Altman, Shyamal Anadkat, et al. Gpt-4 Technical Report.arXiv preprint arXiv:2303.08774, 2023
2023 arXiv
-
[26]
Deepseek-v3 Technical Report.arXiv preprint arXiv:2412.19437, 2024
Aixin Liu, Bei Feng, Bing Xue, Bingxuan Wang, Bochao Wu, Chengda Lu, Chenggang Zhao, Chengqi Deng, Chenyu Zhang, Chong Ruan, et al. Deepseek-v3 Technical Report.arXiv preprint arXiv:2412.19437, 2024
2024 arXiv
-
[27]
Bert: Pre-Training Of Deep Bidirectional Transformers For Language Understanding
Jacob Devlin, Ming-Wei Chang, Kenton Lee, and Kristina Toutanova. Bert: Pre-Training Of Deep Bidirectional Transformers For Language Understanding. InProceedings of the 2019 Conference of the North American Chapter of the Association for Computational Linguistics: Human Langua...
2019
-
[28]
Improving Language Understanding By Generative Pre-Training
Alec Radford, Karthik Narasimhan, Tim Salimans, Ilya Sutskever, et al. Improving Language Understanding By Generative Pre-Training. 2018
2018
-
[29]
Masked Autoencoders Are Scalable Vision Learners
Kaiming He, Xinlei Chen, Saining Xie, Yanghao Li, Piotr Dollár, and Ross Girshick. Masked Autoencoders Are Scalable Vision Learners. InProceedings of the IEEE/CVF Conference on Computer Vision and Pattern Recognition, 2022
2022
-
[30]
Strategies For Pre-Training Graph Neural Networks.arXiv preprint arXiv:1905.12265, 2019
Weihua Hu, Bowen Liu, Joseph Gomes, Marinka Zitnik, Percy Liang, Vijay Pande, and Jure Leskovec. Strategies For Pre-Training Graph Neural Networks.arXiv preprint arXiv:1905.12265, 2019
1905 arXiv
-
[31]
Gpt-Gnn: Gen- erative Pre-Training Of Graph Neural Networks
Ziniu Hu, Yuxiao Dong, Kuansan Wang, Kai-Wei Chang, and Yizhou Sun. Gpt-Gnn: Gen- erative Pre-Training Of Graph Neural Networks. InProceedings of the 26th ACM SIGKDD International Conference on Knowledge Discovery & Data Mining, 2020
2020
-
[32]
Masked Token Enabled Pre-Training: A Task-Agnostic Approach For Understanding Complex Traffic Flow.IEEE Transactions on Mobile Computing, 2024
Lu Hou, Yunxin Geng, Lingyi Han, Haojun Yang, Kan Zheng, and Xianbin Wang. Masked Token Enabled Pre-Training: A Task-Agnostic Approach For Understanding Complex Traffic Flow.IEEE Transactions on Mobile Computing, 2024
2024
-
[33]
Trafficformer: An Efficient Pre-Trained Model For Traffic Data
Guangmeng Zhou, Xiongwen Guo, Zhuotao Liu, Tong Li, Qi Li, and Ke Xu. Trafficformer: An Efficient Pre-Trained Model For Traffic Data. In2025 IEEE Symposium on Security and Privacy (SP), 2024. 11
2024
-
[34]
Traf- ficBERT: Pre-Trained Model With Large-Scale Data For Long-Range Traffic Flow Forecasting
KyoHoon Jin, JeongA Wi, EunJu Lee, ShinJin Kang, SooKyun Kim, and YoungBin Kim. Traf- ficBERT: Pre-Trained Model With Large-Scale Data For Long-Range Traffic Flow Forecasting. Expert Systems with Applications, 2021
2021
-
[35]
GQA: Training Generalized Multi-Query Transformer Models From Multi-Head Checkpoints.arXiv, 2023
Joshua Ainslie, James Lee-Thorp, Michiel de Jong, Yury Zemlyanskiy, Federico Lebrón, and Sumit Sanghai. GQA: Training Generalized Multi-Query Transformer Models From Multi-Head Checkpoints.arXiv, 2023
2023
-
[36]
OpenStreetMap
OpenStreetMap contributors. OpenStreetMap. https://www.openstreetmap.org/ copyright, 2023
2023
-
[37]
Osmnx: New Methods For Acquiring, Constructing, Analyzing, And Visualizing Complex Street Networks.Computers, Environment and Urban Systems, 2017
Geoff Boeing. Osmnx: New Methods For Acquiring, Constructing, Analyzing, And Visualizing Complex Street Networks.Computers, Environment and Urban Systems, 2017
2017
-
[38]
Cblab: Supporting The Training Of Large- Scale Traffic Control Policies With Scalable Traffic Simulation
Chumeng Liang, Zherui Huang, Yicheng Liu, Zhanyu Liu, Guanjie Zheng, Hanyuan Shi, Kan Wu, Yuhao Du, Fuliang Li, and Zhenhui Jessie Li. Cblab: Supporting The Training Of Large- Scale Traffic Control Policies With Scalable Traffic Simulation. InProceedings of the 29th ACM SIGKDD...
2023
-
[39]
Spatio-Temporal Vehicle Trajectory Recovery On Road Network Based On Traffic Camera Video Data
Fudan Yu, Wenxuan Ao, Huan Yan, Guozhen Zhang, Wei Wu, and Yong Li. Spatio-Temporal Vehicle Trajectory Recovery On Road Network Based On Traffic Camera Video Data. In Proceedings of the ACM SIGKDD International Conference on Knowledge Discovery and Data Mining (KDD), 2022
2022
-
[40]
Traj2Traj: A Road Network Constrained Spatiotemporal Interpolation Model For Traffic Trajectory Restoration
Lyuchao Liao, Yuyuan Lin, Weifeng Li, Fumin Zou, and Linsen Luo. Traj2Traj: A Road Network Constrained Spatiotemporal Interpolation Model For Traffic Trajectory Restoration. Transactions in GIS (Trans. GIS), 2023. 12 A Details of Model Architecture A.1 Overall Architecture Fig...
2023
-
[41]
The adjacency tokens 14 represent the information of each node, which is comprehensive but not efficient
mechanism to capture the complex relationship between different views. The adjacency tokens 14 represent the information of each node, which is comprehensive but not efficient. To address this problem, we adopt the multi-query attention mechanism to reduce the computation. The...
Reviewed August 7, 2026 · model on record in the stance chip above.
Discussion (0). Sign in to comment.