REVIEW 5 major objections 4 minor 17 references
Multidimensional Analysis of Specific Language Impairment Using Unsupervised Learning Through PCA and Clustering
T0 review · 5 major / 4 minor · reviewed 2026-08-07 · deepseek-v4-flash
Pith's one-line read The paper's central claim: Specific Language Impairment shows up primarily as reduced production capacity, not reduced syntactic complexity, in clustering of 1,163 child narratives.
desk verdict A clinically plausible claim that collapses under its own numbers and a label-leaking feature set. read the letter →
The pith
A machine-rendered reading of the paper's core claim, the machinery that carries it, and where it could break.
The reading
What carries the argument
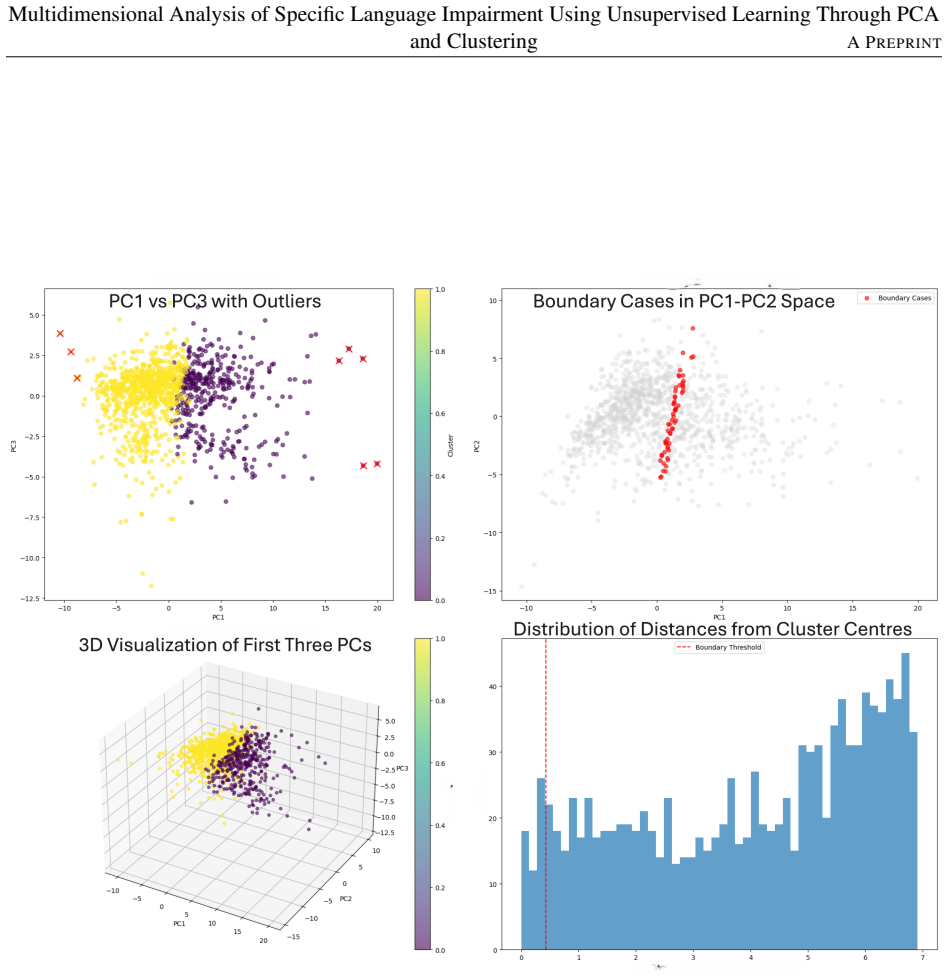
The load-bearing machinery is a two-stage unsupervised pipeline applied to 59 standardized linguistic features: PCA for dimensionality reduction, then k-means clustering on the principal components, with hierarchical clustering and DBSCAN as cross-checks. PC1 (28.35% of variance) is effectively a production-volume axis, loading on morphological words, total word count, syllable count, and utterance count; PC2 (13.23%) indexes syntactic complexity through mean length of utterance and verb usage; PC3 (6.87%) tracks error patterns and perplexity scores. The clusters are validated by silhouette scores between 0.416 and 0.460 and an adjusted Rand index above 0.86, and boundary cases are defined by a 5th-percentile distance-from-center threshold.
What would settle it
Re-run the clustering within each of the three datasets separately, or after statistically controlling for total words produced. If the SLI-prevalence gap between clusters disappears or reverses under either check, the claim that SLI is primarily reduced production capacity would be refuted as an artifact of task length.
Extended reading notes
Core claim
The central discovery, stated on the paper's own terms, is that the main axis of variation in these narrative samples is how much children produce, and this axis is what separates clinical groups. In the resulting two-cluster solution, 373 children form a high-production cluster with low error rates and 17% SLI, while 790 children form a lower-production cluster with higher syntactic complexity, higher error rates, and 26% SLI. The clusters barely differ in mean length of utterance (p = 0.238) but differ strongly in total words produced (p < 0.001, effect size 2.483), which the paper takes as evidence that SLI is less a grammar-complexity deficit than a production-capacity deficit. The 59 boundary cases, with intermediate PC1 values and only 11.9% SLI, are interpreted as support for a continuum rather than a categorical boundary.
Load-bearing premise
The central claim stands on the assumption that pooling three different storytelling tasks into one dataset produces clusters about children's language ability rather than about which task was used or how much speech that task elicited.
Editorial extensions
If this is right
- Clinical assessment should weight production volume and error rates at least as heavily as syntactic complexity measures like mean length of utterance.
- Multidimensional profiles separating production, complexity, and accuracy could replace or refine binary SLI classification.
- Children near cluster boundaries, about 5.1% of the sample, may be poorly served by categorical tests because they show intermediate traits and the lowest SLI prevalence.
- Interventions aimed at increasing output capacity and reducing errors could matter more than grammar-focused training for many children.
- The continuum interpretation implies SLI prevalence is not a fixed property but varies along a production axis, so diagnostic thresholds should be positioned with that gradient in mind.
Reading between the lines
- If the paper is right, then sample length itself becomes a diagnostic variable: a short narrative task could under-classify quiet children as impaired, and a testable extension would be re-administering the same task with a longer or shorter elicitation.
- Because the pooled data mix three different elicitation protocols, a natural internal check the paper does not run is whether the two clusters emerge within each of the three datasets; cluster membership that tracks dataset rather than ability would undermine the production claim.
- The continuum model has a predictive corollary the paper leaves implicit: boundary cases should have intermediate outcomes on later language measures and intermediate responses to intervention, which a longitudinal follow-up could test.
- A direct confound test would be to re-run the pipeline after regressing out total narrative length; if SLI prevalence stops differing across clusters, most of the signal is output volume itself.
Editorial analysis
A structured set of objections, weighed in public.
Referee Report
Summary. The paper reports an unsupervised PCA and clustering analysis of narrative language samples from children with and without Specific Language Impairment (SLI) drawn from three CHILDES corpora. The authors claim to analyze 1,163 children and 64 linguistic features, reduce the data with PCA, and identify two main clusters—one with high production and low SLI prevalence and another with lower production and higher SLI prevalence—plus a group of boundary cases. They conclude that SLI manifests primarily through reduced production capacity rather than syntactic complexity deficits, and they interpret the boundary cases as supporting a continuum model of language ability.
Significance. If the results were reliable, the study would offer a data-driven, multidimensional perspective on SLI that could inform more nuanced diagnostic frameworks and shift clinical emphasis toward production capacity. The use of multiple corpora and a broad feature set is commendable, and the authors make an honest attempt to validate their clusters with silhouette scores and adjusted Rand indices. However, the central claim is undermined by major methodological problems: features derived from SLI and TD group statistics contaminate the supposedly unsupervised analysis; the reported corpus counts do not sum to the stated total; and key quantitative results (eigenvalues, variance percentages, silhouette scores) are internally contradictory. These issues are load-bearing because they directly affect the validity of the clusters and the clinical interpretation, so the significance of the work as presented is not established.
major comments (5)
- [Section 3.1 and Section 3.3] The corpus counts do not add up. The stated subsample sizes are Conti-Ramsden 4 = 118, ENNI = 377, and Gillam = 770; these sum to 1,265, not the reported total of 1,163. Similarly, the per-corpus SLI counts (19 + 77 + 250 = 346) conflict with the stated 267 SLI cases in Section 3.3. This inconsistency in the descriptive statistics casts doubt on the integrity of the dataset and all downstream analyses.
- [Section 6.1 and Table 8] The claim that 'fourteen significant components with eigenvalues exceeding the Kaiser criterion' were retained is contradicted by Table 8, which lists eigenvalues greater than 1 only for PC1 (3.97) and PC2 (1.85); all other components have eigenvalues below 1. Furthermore, the variance percentages in Table 8 are not compatible with the eigenvalues: the sum of the 14 eigenvalues is 11.70, which cannot explain 83.55% of the variance of 59 standardized features. The PCA results as reported are therefore internally inconsistent and cannot be used to support the cluster analysis.
- [Section 3.6, Table 4, and Table 6] The 'unsupervised' analysis is contaminated by label-derived features. Table 4 includes z-score features such as z mlu sli, z mlu td, z word errors sli/td, z r 2 i verbs sli/td, z utts sli/td, and Table 3 includes perplexity features computed against SLI- and TD-trained language models. These features require knowledge of the SLI/TD diagnostic labels for their computation, so the PCA and clustering are not label-free. Since these features have substantial loadings on the principal components that separate the clusters (e.g., z utts td = 0.225 on PC1, z mlu td/sli = 0.315 on PC2, z word errors sli/td = 0.284 on PC3), the observed difference in SLI prevalence between clusters could be an artifact of the normalization rather than evidence about production capacity. The paper must remove these label-conditioned features and re-run the entire pipeline before the clinical claim can be evaluated.
- [Sections 5.1, 6.2, and Figure 1] The silhouette scores are reported inconsistently. Section 5.1 states that silhouette scores range from 0.416 to 0.460, while Section 6.2 and the caption of Figure 1 report a maximum score of 0.36 at k=2 and a secondary peak of about 0.33 at k=5. These are substantially different values, and the manuscript offers no explanation for the discrepancy. Without a consistent validity metric, the choice of the two-cluster solution and the stability claims are not supported.
- [Sections 3.1, 3.4, and 8] Pooling the three corpora is problematic because their elicitation protocols differ substantially: Conti-Ramsden 4 uses a single past-tense story retell with a wordless picture book, ENNI uses examiner-controlled picture stories, and Gillam uses a four-task narrative battery. Section 8 acknowledges that these protocol differences may introduce variability, but the manuscript does not report the cluster composition by corpus. If the clusters correspond to corpus or task differences rather than to language ability, the conclusion that SLI is associated with reduced production capacity is confounded. The paper should provide a breakdown of cluster membership by corpus or otherwise control for task effects.
minor comments (4)
- [Abstract and Section 4.2] The abstract states that 64 linguistic features were evaluated, but Section 4.2 says the feature set was refined to 59 features for the main analysis; please clarify which number applies to the PCA and clustering.
- [Table 8] The column headings and values in Table 8 need clearer explanation; the eigenvalues and variance percentages are presented together but appear to follow different conventions, and this contributes to the inconsistency noted in the major comments.
- [Table 3] Some feature names in Table 3 are incomplete or cryptic (for example, 'n dos' and 'propositions in' versus 'propositions on'); consider adding a glossary or more descriptive names.
- [Reference [10]] Reference [10] is a Kaggle dataset, which may not be persistent or peer-reviewed; citing the original CHILDES corpus sources directly would be more appropriate for the clinical claims.
Circularity Check
The unsupervised clusters are built from SLI/TD-conditioned z-scores and SLI/TD-trained perplexity features, so the SLI-prevalence finding is partly constructed rather than discovered.
-
self definitional
[Section 3.6, Table 4 (Z-Score Comparison Features); used in Table 6 loadings]
"z mlu sli: Z-score of Mean Length of Utterance relative to SLI group; z mlu td: Z-score of MLU relative to TD group; z word errors sli: Z-score of word errors relative to SLI group; z utts sli: Z-score of utterances relative to SLI group; z utts td: Z-score of utterances relative to TD group."
Each z feature is computed from the mean and standard deviation of the SLI or TD subgroup, so the diagnostic labels are required to define the feature. These label-derived variables then enter the PCA: Table 6 shows z utts td/sli loading 0.225 on PC1, z mlu td/sli loading 0.315 on PC2, and z word errors td/sli loading 0.284 on PC3. The clusters are therefore not label-free; comparing SLI prevalence across clusters reports a contrast that was partly built into the feature definitions. The paper's framing that the clusters 'naturally' emerge is compromised.
-
fitted input called prediction
[Section 3.6, Table 3 (Language Model Perplexity); used in Section 6.1 PC3]
"s 1g ppl: 1-gram perplexity compared to SLI language model; s 2g ppl: 2-gram perplexity compared to SLI language model; s 3g ppl: 3-gram perplexity compared to SLI language model; d 1g ppl: 1-gram perplexity compared to TD language model; d 2g ppl: 2-gram perplexity compared to TD language model; d 3g ppl: 3-gram perplexity compared to TD language model."
These features are produced by fitting separate n-gram language models to SLI and TD transcripts, then scoring every child against both models. A low 's' perplexity means the child's language resembles the SLI-trained model, while a low 'd' perplexity means it resembles the TD-trained model. Such features are supervised, label-conditioned constructs, not unsupervised observations. They load on PC3 (d 2g ppl 0.270, d 3g ppl 0.268) and are interpreted as an 'accuracy dimension'; the later claim that SLI-related error/perplexity patterns emerge from the data is therefore partly an artifact of having trained the language models on the same diagnostic groups.
1 more flagged steps
-
other
[Abstract and Section 7.2]
"Findings suggest SLI manifests primarily through reduced production capacity rather than syntactic complexity deficits."
This headline conclusion is drawn from the SLI prevalence difference between clusters (17% vs 26%) after the clusters have been constructed using features that already encode SLI/TD membership through group-relative z-scores and SLI/TD-trained perplexities. The finding is not a pure unsupervised discovery, because the cluster solution is partially determined by the diagnostic labels used to build the features. The raw child-TNW difference between clusters (690.5 vs 296.9, d=2.483) provides independent evidence for a production difference, so the conclusion may survive feature removal; but as presented, the derivation mixes label-derived inputs with the unsupervised claim.
full rationale
The main circularity is label leakage in the supposedly unsupervised pipeline. Table 4 defines z-scores relative to SLI and TD group statistics, and Table 3 defines perplexity features against SLI- and TD-trained language models; both require the diagnostic labels to construct. These features are among the top loadings on the principal components that define the clusters. Consequently, the observed 17%-vs-26% SLI prevalence difference between clusters is at least partly built into the input features rather than emerging from label-free structure. This is a self-definitional/fitted-input problem, not a self-citation problem. The paper does not rely on load-bearing self-citations or an imported uniqueness theorem. I do not score it higher because part of the production-capacity claim rests on raw, label-independent features (child TNW, word errors, MLU) whose cluster differences are reported directly in Table 13, and because removing the label-conditioned features could leave the general production-volume pattern intact. Still, the 'unsupervised' framing and the specific PCA/cluster solution are contaminated by construction, so the central claim is only partially independent of its inputs.
Assumptions & free parameters
free parameters (4)
- Boundary case threshold =
5th percentile of distance differences
- Number of clusters k =
k=2 (with secondary peak k=5)
- Number of principal components used for clustering =
Unclear; text says 14, Table 8 shows only 2 eigenvalues >1, figures suggest first 3 PCs
- Feature selection correlation threshold =
Not specified
assumptions (4)
- domain assumption The three corpora (Conti-Ramsden 4, ENNI, Gillam) can be pooled into a single dataset despite different elicitation protocols, age ranges, and countries.
- domain assumption The SLI/TD labels in the source corpora are accurate and consistently applied.
- ad hoc to paper Z-score features computed relative to the SLI and TD groups are legitimate inputs to an unsupervised clustering.
- standard math PC1, PC2, and PC3 can be interpreted as independent dimensions of production, complexity, and accuracy.
Cite this review
Pith. "Pith review of Multidimensional Analysis of Specific Language Impairment Using Unsupervised Learning Through PCA and Clustering." pith.science (2026). https://pith.science/paper/NMRN7HUJ
@misc{pith2026250605498,
  author       = {Pith},
  title        = {Pith review of: Multidimensional Analysis of Specific Language Impairment Using Unsupervised Learning Through PCA and Clustering},
  year         = {2026},
  howpublished = {\url{https://pith.science/paper/NMRN7HUJ}},
  note         = {Machine review of arXiv:2506.05498}
}
read the original abstract
Specific Language Impairment (SLI) affects approximately 7 percent of children, presenting as isolated language deficits despite normal cognitive abilities, sensory systems, and supportive environments. Traditional diagnostic approaches often rely on standardized assessments, which may overlook subtle developmental patterns. This study aims to identify natural language development trajectories in children with and without SLI using unsupervised machine learning techniques, providing insights for early identification and targeted interventions. Narrative samples from 1,163 children aged 4-16 years across three corpora (Conti-Ramsden 4, ENNI, and Gillam) were analyzed using Principal Component Analysis (PCA) and clustering. A total of 64 linguistic features were evaluated to uncover developmental trajectories and distinguish linguistic profiles. Two primary clusters emerged: (1) high language production with low SLI prevalence, and (2) limited production but higher syntactic complexity with higher SLI prevalence. Additionally, boundary cases exhibited intermediate traits, supporting a continuum model of language abilities. Findings suggest SLI manifests primarily through reduced production capacity rather than syntactic complexity deficits. The results challenge categorical diagnostic frameworks and highlight the potential of unsupervised learning techniques for refining diagnostic criteria and intervention strategies.
Figures


Reference graph
Works this paper leans on
-
[1]
Arena, A., et al. (2024). Specific Language Impairment analysis. Journal of Speech and Language Research
work page 2024
-
[2]
Leonard, L. B. (2014). Children with specific language impairment. MIT Press
work page 2014
-
[3]
Rice, M. L. (2020). Language development and impairment in children. Annual Review of Psychology, 71, 351- 378
work page 2020
-
[4]
Bishop, D. V . M. (2016). What causes specific language impairment in children? Current Directions in Psycho- logical Science, 25(4), 223-229
work page 2016
-
[5]
Huang, G., Cheng, A., & Gao, Y . (2022). Machine Learning improvements to the accuracy of predicting Specific Language Impairment. In 2022 International Conference on Image Processing, Computer Vision and Machine Learning
work page 2022
-
[6]
Gabani, K., et al. (2011). Identifying specific language impairment using linguistic features. Journal of Speech Language and Hearing Research
work page 2011
-
[7]
Roy, S., et al. (2019). Unsupervised learning in developmental language analysis. Computational Linguistics
work page 2019
-
[8]
Duran, P., et al. (2018). Machine learning applications in clinical linguistics. Language and Speech
work page 2018
Show all 17 references
-
[9]
Wetherell, D., et al. (2007). Dimensionality reduction in language assessment. Clinical Linguistics
2007
-
[10]
O’Keeffe, D. (2020). Specific Language Impairment Dataset. Kaggle. Retrieved from https://www.kaggle.com/datasets/dgokeeffe/specific-language-impairment
2020
-
[11]
Conti-Ramsden, G. (2024). CHILDES Clinical English Conti-Ramsden Corpus 2. Retrieved from https://childes.talkbank.org/access/Clinical-Eng/Conti-Ramsden.html. doi:10.21415/T55S3P
2024 doi
-
[12]
Conti-Ramsden, G., & Dykins, J. (1991). Mother–child interactions with language-impaired children and their siblings. British Journal of Disorders of Communication, 26, 337–354
1991
-
[13]
Schneider, P. (2024). CHILDES Clinical English ENNI Corpus. Retrieved from https://childes.talkbank.org/access/Clinical-Eng/ENNI.html. doi:10.21415/T51G7V 13 Multidimensional Analysis of Specific Language Impairment Using Unsupervised Learning Through PCA and Clustering A PREPRINT
2024 doi
-
[14]
Schneider, P., Hayward, D., & Dub ´e, R. V . (2006). Storytelling from pictures using the Edmonton Narrative Norms Instrument. Journal of Speech-Language Pathology and Audiology, 30, 224-238
2006
-
[15]
B., & Pearson, N
Gillam, R. B., & Pearson, N. A. (2004). Test of narrative language. Austin, TX: Pro-Ed Inc
2004
-
[16]
Jaadi, Z. (2022). A Step-by-Step Explanation of Principal Component Analysis (PCA). Built In . Available: https://builtin.com/data-science/step-step-explanation-principal-component-analysis
2022
-
[17]
B., et al
Tomblin, J. B., et al. (1997). Prevalence of specific language impairment in kindergarten children. Journal of Speech Language and Hearing Research, 40(6), 1245-1260. 14
1997
Reviewed August 7, 2026 · model on record in the stance chip above.
Discussion (0). Sign in to comment.