REVIEW 3 major objections 5 minor 14 references
CCLSTM: Coupled Convolutional Long-Short Term Memory Network for Occupancy Flow Forecasting
T0 review · 3 major / 5 minor · reviewed 2026-08-07 · deepseek-v4-flash
Pith's one-line read A compact convolutional LSTM, using only rasterized bird's-eye views, outperforms transformer- and vector-based models on Waymo occupancy-flow forecasting.
desk verdict A clean, efficient fully convolutional LSTM that reports rank-1 Waymo occupancy/flow numbers, but the headline SOTA claim is confounded by a larger input field of view that the baselines are not shown to share. read the letter →
The pith
A machine-rendered reading of the paper's core claim, the machinery that carries it, and where it could break.
The reading
What carries the argument
The central object is the Coupled Convolutional LSTM: an accumulator cell (Eq. 1) that ingests encoded BEV frames one at a time and updates hidden and cell states, followed by a forecasting cell (Eq. 2) whose initial states are the accumulator's final states and which is unrolled autoregressively to emit future latent maps. Each gate's convolution is implemented as a small 3-layer convolutional network, with group normalization on the cell state; the decoder branches produce occupancy logits and reverse-flow vectors at input resolution. A second load-bearing mechanism is the reverse-flow-weighted occupancy loss, which multiplies the per-cell BCE term by $\|F_{t,h,w}\|/\alpha + 1.0$ so that moving cells contribute proportionally more than the abundant stationary cells.
What would settle it
Run the challenge-submission model on the WOMD test set with 256x256 input rasters (the 80m central crop used for evaluation) instead of 512x512; if its observed-AUC and flow-EPE drop to the level of DOPP or STrajNet, the state-of-the-art result is driven by extra context rather than the CCLSTM architecture.
Extended reading notes
Core claim
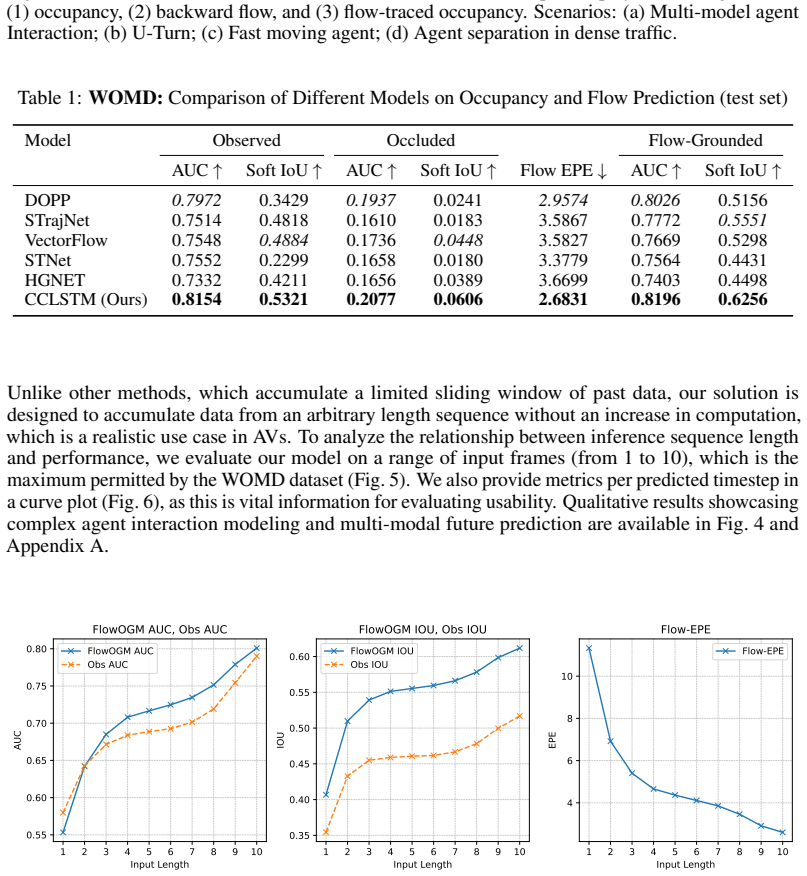
CCLSTM establishes that a sequence-to-sequence pair of convolutional LSTM cells—an accumulator that folds the observed 1-second history into latent state and an autoregressive forecaster that unrolls that state into the future—can reach state-of-the-art occupancy-flow scores while staying purely convolutional and training from scratch on raster data. The author's central claim is that the strong results come from coupling these two recurrent stages in latent space, from an input design that includes backward flow and a wide 160m field of view, and from a reverse-flow-weighted loss that shifts training emphasis toward moving objects in a dataset that is roughly 70 percent stationary. The paper reports test-set superiority over DOPP, STrajNet, VectorFlow, STNet, and HGNET on observed and occluded occupancy AUC and Soft IoU, flow end-point error, and flow-grounded occupancy metrics.
Load-bearing premise
The claim that CCLSTM is state-of-the-art rests on comparing test scores where CCLSTM saw a 160m-by-160m scene while baselines were scored on an 80m-by-80m central crop; if that wider context, not the architecture, produces the gains, the ranking overstates the model.
Editorial extensions
If this is right
- A vehicle's forecasting stack can run from rasterized sensor output without vectorized perception, reducing reliance on object detection and HD maps.
- Because the accumulator digests frames recurrently, the model can ingest arbitrarily long observation histories at constant per-frame cost, and validation curves show longer histories improve accuracy.
- Autoregressive decoding emits a full occupancy and reverse-flow grid for every future timestep, so a planner can query any horizon without re-encoding the past.
- Removing either the accumulation stage or the autoregressive stage degrades all metrics, confirming that the coupled two-stage design is load-bearing.
Reading between the lines
- A controlled version of Table 1 that feeds baselines the same 160m raster would determine how much of the lead comes from wider context rather than the architecture; the paper does not provide that comparison.
- If the wide-field advantage is shown to be the dominant factor, the practical lesson would be that context scale can substitute for attention on this benchmark, a hypothesis testable by adding the same context to any lightweight encoder.
- The recurrent accumulator is encoder-agnostic, so joint training with a camera-based bird's-eye-view backbone is a natural extension that could remove the remaining reliance on externally rendered rasters.
- The reported per-timestep degradation curves suggest the model's useful horizon is concentrated early; a task-aware planner could weight queries by predicted confidence or an implicit-occupancy variant could skip empty cells.
Editorial analysis
A structured set of objections, weighed in public.
Referee Report
Summary. The paper introduces CCLSTM, a fully convolutional recurrent architecture for occupancy-flow forecasting from rasterized bird's-eye-view inputs. The model combines a CNN encoder, an accumulator ConvLSTM that ingests the observation history, an autoregressive forecasting ConvLSTM, and a CNN decoder that outputs future occupancy and reverse-flow fields. Training uses a weighted occupancy loss with flow-magnitude weighting, an occupancy-weighted flow loss, and a flow-traced consistency loss. The authors report rank-1 performance on all metrics of the 2024 Waymo Occupancy and Flow Prediction Challenge, validation ablations on WOMD, and transfer results on an ego-centric Argoverse 2 rasterization.
Significance. If the reported results are taken at face value, the contribution is significant: a compact 31M-parameter convolutional recurrent model, using only rasterized inputs and no transformers or vectorized representations, outperforms several published transformer- and vector-based methods on the standard Waymo occupancy/flow benchmark. The use of the official Waymo test server is a concrete and valuable form of evaluation, and the ablations sensibly decompose the contributions of the accumulator, the autoregressive decoder, and input flow. The main concern is that the central state-of-the-art claim rests on a leaderboard comparison that is confounded by the enlarged input field of view used in the challenge submission, so the architecture's specific contribution is not yet isolated. The Argoverse 2 results are exploratory, but the reported zero occluded-occupancy metrics require clarification before they can be interpreted as evidence of generalization.
major comments (3)
- [Sec. 3.3.1 and Table 1] The headline claim of state-of-the-art performance on the Waymo test set is confounded by input raster size. Section 3.3.1 states that the challenge submission uses H,W=512 (160m x 160m) rasters while evaluation uses a central crop of H,W=256 (80m x 80m), and Section 3.4 confirms that the submission was trained with this enlarged FoV. The baselines in Table 1 (DOPP, STrajNet, VectorFlow, STNet, HGNET) are not shown to have used an equivalent enlarged field of view, so CCLSTM may benefit from additional spatial context containing agents, road topology, and traffic information outside the evaluation RoI. The validation ablation in Table 3 does not isolate this effect: the 'Baseline' vs 'Submission' rows differ not only in architecture components but also in raster size and training configuration, and the observed differences (e.g., Observed AUC +0.0196, Flow EPE -0.362) are of the same order as the test-set margins over DOPP in Table 1 (Observed AUC +0.0182, Flow EPE -0.2743). A test-set or validation ablation that trains CCLSTM with 256/320/512 inputs while cropping to the 256x256 evaluation RoI is needed to determine how much of the reported gain comes from the enlarged FoV. Unless such an ablation is provided, the abstract's attribution of the result to the architecture's simplicity and efficiency is not supported.
- [Table 2 and Sec. 4.2] The Argoverse 2 results report Occluded AUC = 0.0 and Occluded Soft IoU = 0.0 for both CCLSTM and CCLSTM-IMU, with no explanation in the text. A constant zero score on these metrics suggests that the occluded-occupancy evaluation is inapplicable to this dataset or that the evaluation pipeline is producing degenerate values. As presented, these rows undermine the claim that 'the method generalizes to a moving coordinate system,' because two of the six reported metrics are zero without interpretation. Please clarify whether occluded occupancy is defined in the Argoverse 2 rendering, and if it is not, remove or explicitly flag these columns and report only the metrics that are meaningful.
- [Sec. 4.3, Tables 2-3 and Figs. 5-8] All reported numbers appear to come from a single training run with no error bars, repeated trials, or statistical significance testing. The ablation conclusions in Table 3 (e.g., w/o input flow: -0.0125 AUC; w/o accumulation: -0.0255 AUC) and the input-length curves in Figs. 5 and 8 involve differences that may be within run-to-run variation for a 31M-parameter model trained for only 10 epochs. Since several claims in the paper ('longer input sequences lead to improved predictive accuracy,' 'performance improves with IMU input') are based on these small-margin comparisons, the absence of variance estimates is a load-bearing limitation. At minimum, the authors should report results over multiple seeds with mean and standard deviation for the validation ablations, or explicitly acknowledge that these margins are not statistically validated.
minor comments (5)
- [Eq. (9)] The trace loss is described as warping Ok−1 by F^k, but the notation 'F^k t,h,w ◦ Ok−1 t,h,w' is not formally defined. Please specify the warp operation in terms of the flow field coordinates and the interpolation scheme.
- [Eqs. (4), (6), and (8)] The symbol α is reused for three different quantities: the flow-magnitude scaling factor in Eq. (4), the occupancy normalization constant in Eq. (6), and the trace-loss normalization constant in Eq. (8). This makes the loss definitions unnecessarily hard to follow; please use distinct symbols.
- [Fig. 2 caption] The caption states that 'data diversity can be increased by using larger FoV rasters: (W, H) = 256, 320 and 512,' but the figure appears to show only log-frequency occupancies for the two classes and a flow-magnitude histogram. Please clarify how the three raster sizes are represented in the figure.
- [Sec. 3.4, WOMD training] The sentence 'The hidden states of the Accumulation CLSTM at t = Th + 1 are initialized with 0' is ambiguous. Since the accumulator is run over the observed sequence, please clarify the initialization convention (likely t = −Th+1 rather than Th+1).
- [Sec. 1] The contribution list says 'State-of-the-art performance across all metrics on the 2024 Waymo Occupancy Flow Challenge,' but the body of the paper reports only occupancy and flow metrics and does not discuss whether the leaderboard rank has been maintained since submission. Please add the date of the leaderboard snapshot and a note that ranks can change.
Circularity Check
No significant circularity: CCLSTM's reported results are evaluated on held-out Waymo test and Argoverse 2 validation data, and no prediction reduces to a fitted constant or self-referential definition.
full rationale
The paper's central claims are empirical comparisons against external benchmarks and ablations. The model is trained with standard occupancy, flow, and trace losses using ground-truth labels, and the reported metrics are computed on held-out Waymo test leaderboard data and Argoverse validation data. Loss hyperparameters are set empirically but are not used to define the evaluation metrics, so no fitted value is renamed as a prediction. The ablation study removes architectural components and input modalities, and the resulting performance differences are reported rather than assumed. The use of a larger 512x512 input raster for the challenge submission is a legitimate experimental choice, and while it may confound comparisons with baselines, that is a correctness or comparability concern, not circularity. There are no load-bearing self-citations, uniqueness theorems, or imported ansatze; references to prior ConvLSTM and occupancy-flow works are standard background. The derivation chain is therefore self-contained with respect to circularity, and the appropriate score is 0.
Assumptions & free parameters
free parameters (4)
- Loss balancing weights (lambda_occupancy, lambda_flow, lambda_trace) =
1000, 25, 10
- Flow weighting scaling factor alpha =
10
- Encoder embedding dimension C =
256
- Input raster size for challenge submission =
512x512 (WOMD), evaluation crop 256x256
assumptions (4)
- domain assumption Waymo and Argoverse 2 ground-truth rasters and evaluation metrics are accepted as ground truth
- domain assumption The rendered input rasters contain sufficient information to predict future occupancy and flow
- standard math Standard ConvLSTM cell equations remain valid for spatiotemporal aggregation in this setting
- ad hoc to paper Hyperparameters (loss weights, alpha, embedding dimension) are fixed without overfitting to the test set
Cite this review
Pith. "Pith review of CCLSTM: Coupled Convolutional Long-Short Term Memory Network for Occupancy Flow Forecasting." pith.science (2026). https://pith.science/paper/KNR5XWCR
@misc{pith2026250606128,
  author       = {Pith},
  title        = {Pith review of: CCLSTM: Coupled Convolutional Long-Short Term Memory Network for Occupancy Flow Forecasting},
  year         = {2026},
  howpublished = {\url{https://pith.science/paper/KNR5XWCR}},
  note         = {Machine review of arXiv:2506.06128}
}
abstract
Predicting future states of dynamic agents is a fundamental task in autonomous driving. An expressive representation for this purpose is Occupancy Flow Fields, which provide a scalable and unified format for modeling motion, spatial extent, and multi-modal future distributions. While recent methods have achieved strong results using this representation, they often depend on high-quality vectorized inputs, which are unavailable or difficult to generate in practice, and the use of transformer-based architectures, which are computationally intensive and costly to deploy. To address these issues, we propose \textbf{Coupled Convolutional LSTM (CCLSTM)}, a lightweight, end-to-end trainable architecture based solely on convolutional operations. Without relying on vectorized inputs or self-attention mechanisms, CCLSTM effectively captures temporal dynamics and spatial occupancy-flow correlations using a compact recurrent convolutional structure. Despite its simplicity, CCLSTM achieves state-of-the-art performance on occupancy flow metrics and, as of this submission, ranks \(1^{\text{st}}\) in all metrics on the 2024 Waymo Occupancy and Flow Prediction Challenge leaderboard.
Figures


Figures from the paper (7 more)



Reference graph
Works this paper leans on
-
[1]
HGNET: A Hierarchical Feature Guided Network for Occupancy Flow Field Prediction
Zhan Chen, Chen Tang, and Lu Xiong. Hgnet: A hierarchical feature guided network for occupancy flow field prediction. arXiv preprint arXiv:2407.01097, 2024
work page Pith review arXiv 2024
-
[2]
Large scale interactive motion forecasting for autonomous driving: The waymo open motion dataset
Scott Ettinger, Shuyang Cheng, Benjamin Caine, Chenxi Liu, Hang Zhao, Sabeek Pradhan, Yuning Chai, Ben Sapp, Charles R Qi, Yin Zhou, et al. Large scale interactive motion forecasting for autonomous driving: The waymo open motion dataset. In Proceedings of the IEEE/CVF International Conference on Computer Vision, pages 9710–9719, 2021
2021
-
[3]
Adam W Harley, Zhaoyuan Fang, Jie Li, Rares Ambrus, and Katerina Fragkiadaki. Simple-bev: What really matters for multi-sensor bev perception? In 2023 IEEE International Conference on Robotics and Automation (ICRA), pages 2759–2765. IEEE, 2023
work page 2023
-
[4]
Long short-term memory
Sepp Hochreiter and Jürgen Schmidhuber. Long short-term memory. Neural computation, 9(8):1735–1780, 1997
1997
-
[5]
HOPE: Hierarchical Spatial-temporal Network for Occupancy Flow Prediction
Yihan Hu, Wenxin Shao, Bo Jiang, Jiajie Chen, Siqi Chai, Zhening Yang, Jingyu Qian, Helong Zhou, and Qiang Liu. Hope: Hierarchical spatial-temporal network for occupancy flow prediction. arXiv preprint arXiv:2206.10118, 2022
work page Pith review arXiv 2022
-
[6]
VectorFlow: Combining Images and Vectors for Traffic Occupancy and Flow Prediction
Xin Huang, Xiaoyu Tian, Junru Gu, Qiao Sun, and Hang Zhao. Vectorflow: Combining images and vectors for traffic occupancy and flow prediction. arXiv preprint arXiv:2208.04530, 2022
work page Pith review arXiv 2022
-
[7]
Hybrid-prediction integrated planning for autonomous driving
Haochen Liu, Zhiyu Huang, Wenhui Huang, Haohan Yang, Xiaoyu Mo, and Chen Lv. Hybrid-prediction integrated planning for autonomous driving. IEEE Transactions on Pattern Analysis and Machine Intelli- gence, 2025
work page 2025
-
[8]
Multi-modal hierarchical transformer for occupancy flow field prediction in autonomous driving
Haochen Liu, Zhiyu Huang, and Chen Lv. Multi-modal hierarchical transformer for occupancy flow field prediction in autonomous driving. In 2023 IEEE International Conference on Robotics and Automation (ICRA), pages 1449–1455. IEEE, 2023
work page 2023
Show all 14 references
-
[9]
Occupancy flow fields for motion forecasting in autonomous driving.IEEE Robotics and Automation Letters, 7(2):5639– 5646, 2022
Reza Mahjourian, Jinkyu Kim, Yuning Chai, Mingxing Tan, Ben Sapp, and Dragomir Anguelov. Occupancy flow fields for motion forecasting in autonomous driving.IEEE Robotics and Automation Letters, 7(2):5639– 5646, 2022
2022
-
[10]
Ofmpnet: Deep end-to-end model for occupancy and flow prediction in urban environment
Youshaa Murhij and Dmitry Yudin. Ofmpnet: Deep end-to-end model for occupancy and flow prediction in urban environment. Neurocomputing, 586:127649, 2024
2024
-
[11]
Con- volutional lstm network: A machine learning approach for precipitation nowcasting
Xingjian Shi, Zhourong Chen, Hao Wang, Dit-Yan Yeung, Wai-Kin Wong, and Wang-chun Woo. Con- volutional lstm network: A machine learning approach for precipitation nowcasting. Advances in neural information processing systems, 28, 2015
2015
-
[12]
Unsupervised learning of video representa- tions using lstms
Nitish Srivastava, Elman Mansimov, and Ruslan Salakhudinov. Unsupervised learning of video representa- tions using lstms. In International conference on machine learning , pages 843–852. PMLR, 2015
2015
-
[13]
Sequence to sequence learning with neural networks
Ilya Sutskever, Oriol Vinyals, and Quoc V Le. Sequence to sequence learning with neural networks. Advances in neural information processing systems , 27, 2014
2014
-
[14]
Argoverse 2: Next generation datasets for self-driving perception and forecasting
Benjamin Wilson, William Qi, Tanmay Agarwal, John Lambert, Jagjeet Singh, Siddhesh Khandelwal, Bowen Pan, Ratnesh Kumar, Andrew Hartnett, Jhony Kaesemodel Pontes, et al. Argoverse 2: Next generation datasets for self-driving perception and forecasting. arXiv preprint arXiv:230...
2023 arXiv
Reviewed August 7, 2026 · model on record in the stance chip above.
Discussion (0). Sign in to comment.