REVIEW 4 major objections 5 minor 26 references
A Neuronal Model at the Edge of Criticality: An Ising-Inspired Approach to Brain Dynamics
T0 review · 4 major / 5 minor · reviewed 2026-08-07 · deepseek-v4-flash
Pith's one-line read This paper claims that adding fixed on/off refractory periods to an Ising spin model of neurons is enough to reproduce the hallmark signatures of cortical criticality—peak fluctuations, long-range correlations, and scale-free…
desk verdict A small, honest modeling study that adds refractory periods to an Ising lattice, but the criticality claim rests on a circular peak-reading and missing finite-size scaling. read the letter →
The pith
A machine-rendered reading of the paper's core claim, the machinery that carries it, and where it could break.
The reading
What carries the argument
The central object is the refractory-period-modified Ising model: a 2D lattice where each neuron is a spin $s_i=\pm1$, interactions are ferromagnetic ($J_{ij}=J=1$) over 28 neighbors, and updates follow asynchronous Metropolis dynamics with the activation probability $P=\min(1, e^{-\Delta H/T})$. Superimposed on this is a deterministic clock: once a neuron activates it must stay on for a fixed 'on time' and then off for a fixed 'off time' before it can be proposed for another change. That clock is what carries the argument: it is the only physiological ingredient beyond the Ising Hamiltonian, and the paper attributes the emergence of synchronized oscillations, the location of $T_c$, and the power-law cluster statistics to the interplay between this timing constraint and thermal noise.
What would settle it
A finite-size scaling study of the $C$ and $\chi$ peaks, or a direct check of whether the stationary distribution matches the Boltzmann weight $e^{-H/T}$, would settle the claim. If the peak heights grow only logarithmically or saturate, or if detailed balance fails while the peaks remain, then the phenomenon is a nonequilibrium pseudo-criticality rather than a genuine Ising-type critical point.
Extended reading notes
Core claim
The paper's central claim is that the modified Ising model—with $s_i=\pm1$ neurons on a 2D lattice of 28 neighbors and asynchronous Metropolis updates constrained by fixed on/off counters—undergoes a continuous, second-order-like phase transition as a function of $T$. Mean activity $\bar{M}$ changes smoothly from disorder to order; the dynamic capacity $C$ (energy variance) and neuron sensitivity $\chi$ (activity variance) both peak at $T_c\approx18$ and sharpen with system size; the autocorrelation function decays slowly at $T_c$; and the cluster-size distribution is a power law with slope $-2.13$ at the critical point. The authors conclude that 'minimal biological constraints in an Ising-like model can reproduce critical neural dynamics,' making the refractory period the key ingredient that turns an abstract spin lattice into a model of cortex-like criticality.
Load-bearing premise
The argument assumes that the network with fixed on/off timers still settles into a thermal equilibrium described by the Ising Hamiltonian, so that heat capacity, susceptibility, and 'second-order phase transition' are meaningful; if the periodic on/off cycling keeps the system out of equilibrium, the observed peaks and power laws could be artifacts of the clock rather than signs of a true critical point.
Editorial extensions
If this is right
- If the claim holds, reproducing cortical-like criticality does not require careful tuning of synaptic strengths—only a global noise level and fixed refractory durations.
- The model provides a statistical-physics handle on neuromodulation: changing effective $T$ should push a network away from or back toward the critical regime, which could be compared with pharmacological or state-dependent brain data.
- Because the supercritical regime $T=40$ also produces a power-law cluster distribution (slope $-2.26$), power-law fitting alone cannot certify criticality; the sharper evidence is the scale-dependent peak in $C$ and $\chi$.
- Finite-size scaling predicts that larger lattices will show sharper, higher peaks in $C$ and $\chi$ near $T_c$, giving a direct quantitative target for simulation or experiment.
Reading between the lines
- The authors do not say so explicitly, but this mechanism implies that power-law avalanche statistics in real neural cultures might not require precisely tuned synaptic couplings; a global noise level plus refractory timing could be sufficient.
- A direct check of whether the stationary distribution of the timed dynamics equals the Boltzmann weight $e^{-H/T}$ would distinguish genuine equilibrium criticality from a nonequilibrium clock-driven pseudo-transition—this goes beyond what the paper proves.
- The model's logic suggests that using a distribution of refractory durations, as in real neuronal populations, would broaden the sharp $T_c$ into a critical-like region; testing this would connect the model to pharmacological or state-dependent shifts in brain criticality.
Editorial analysis
A structured set of objections, weighed in public.
Referee Report
Summary. The paper introduces a modified Ising model in which each neuron is a binary spin on a 2D lattice with 28-neighbor coupling, asynchronous Metropolis updates, and fixed ON/OFF refractory durations. The authors report a continuous transition in mean activity as a temperature-like parameter T varies, with peaks in the variance-based quantities C and chi at T approximately 18, slow temporal and spatial correlation decay near that temperature, and power-law cluster-size distributions. They conclude that minimal biological constraints can reproduce critical neural dynamics and thereby support the critical brain hypothesis.
Significance. If the central claim were established, the paper would provide a simple, computationally tractable demonstration that adding a refractory-period constraint to an Ising-type model suffices to produce critical-like neural dynamics. The model is clearly described and the paper includes several positive features: results for three lattice sizes, explicit acknowledgment of model limitations, and a candid statement of the simplification. However, the evidence as presented does not currently establish a second-order phase transition or true criticality. The critical temperature is identified from the same fluctuation peaks that are then used as evidence, no finite-size scaling or Binder analysis is provided, and the non-Markovian dynamics are not shown to be compatible with the equilibrium statistical-mechanics quantities used in the analysis.
major comments (4)
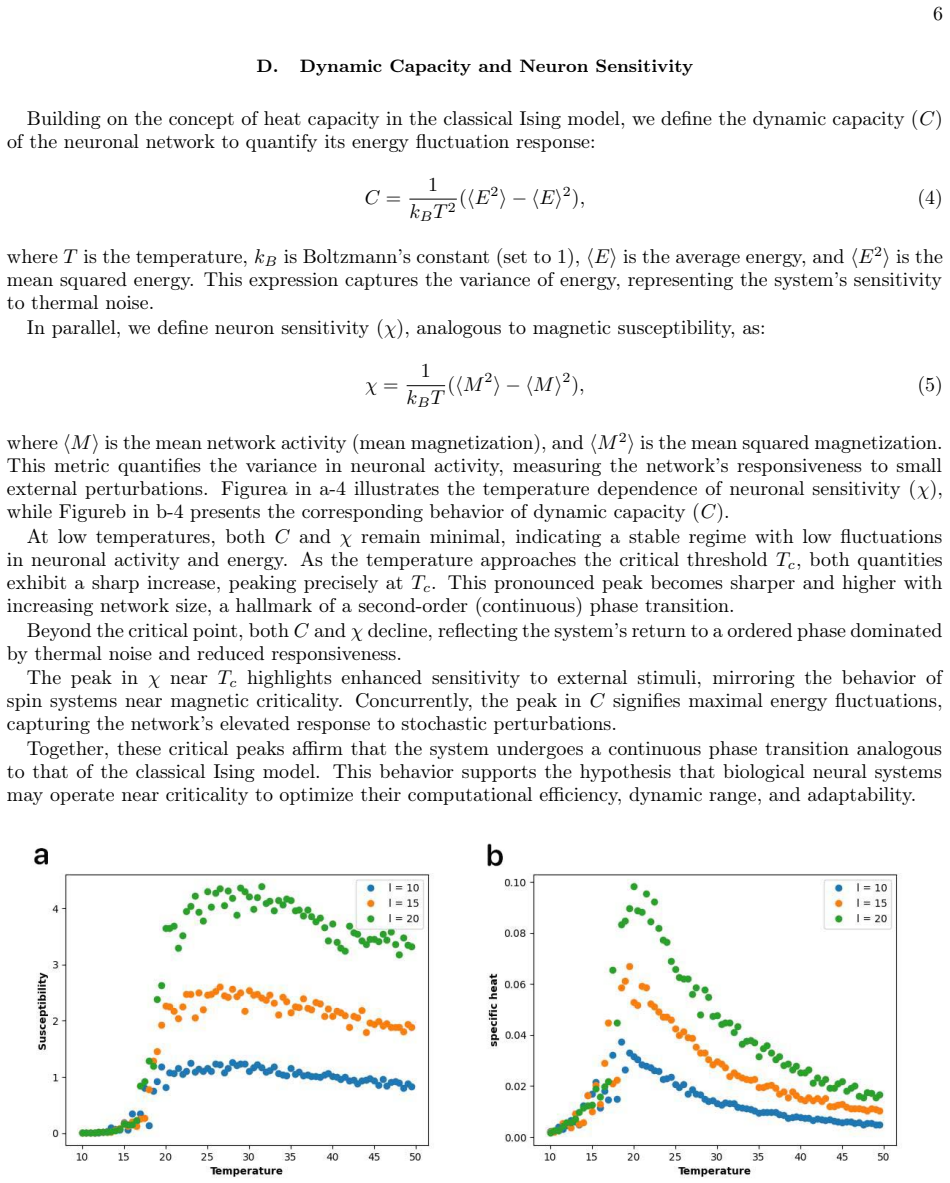
- [Section III.D, Fig. 4] The critical temperature Tc approximately 18 is identified from the peak locations of chi and C, and those same peaks are then presented as the signature of a second-order phase transition. This circularity would be resolved by an independent estimate of Tc, for example from Binder cumulant crossings, and by a finite-size scaling analysis of the peak heights and positions showing divergence in the thermodynamic limit. The three system sizes L=10, 15, and 20 shown in Fig. 4 do not by themselves establish a divergent correlation length.
- [Section II, Eqs. (4)-(5)] The update rule applies the Metropolis probability only to off-to-on transitions, while neurons remain deterministically on or off for fixed durations. The paper gives no argument that this non-Markovian dynamics obeys detailed balance or converges to the Boltzmann distribution of the Hamiltonian in Eq. (1). Without such an argument, Eqs. (4)-(5) cannot be interpreted as heat capacity and magnetic susceptibility of an equilibrated system. Please either prove stationarity and Boltzmann sampling, or reframe C and chi as empirical variance measures and temper the phase-transition language.
- [Section III.F, Fig. 7] The cluster-size distribution at supercritical T=40 is also fitted by a power law with slope -2.26 and R^2=0.96, attributed to oscillatory activation patterns. This means that power-law clusters do not uniquely distinguish the critical regime in this model, yet the text presents the T=18 power law as evidence of criticality. The authors should provide a baseline or control, such as a random percolation null model, shuffled time series, or a subcritical distribution, and explain how the critical-regime power law differs from the supercritical one.
- [Section III (all subsections)] All quantitative results are point estimates without error bars, numbers of independent runs, or equilibration criteria. For instance, the claim that the T=18 autocorrelation decays slowly relative to T=5 and T=40 in Fig. 5 cannot be assessed without uncertainty estimates. Reporting standard errors or confidence intervals and specifying the number of Monte Carlo sweeps used for averaging is necessary to support the qualitative claims.
minor comments (5)
- [Section IV] The conclusion uses 'Avalanche dynamics' as a thematic heading, but the paper analyzes cluster-size distributions rather than the temporal cascades usually called neuronal avalanches; please align the terminology with what is actually measured.
- [References] References [20] and [21] are identical (Hu and Davletov 2003); if one is intended to be a different source, please correct or remove the duplication.
- [Figure references throughout] References such as 'Figure a-4' and 'Figure b-4' are inconsistent with the numbered figures and should be changed to 'Fig. 4(a)' and 'Fig. 4(b)'.
- [Section III.A] The text says that increasing T moves the system from disordered asynchronous to ordered synchronized behavior, but the high-temperature regime is described in the same paragraph as oscillatory and noise-dominated; please clarify the meaning of 'ordered' at high T.
- [Eq. (4)] Equation (4) includes k_B T^2 while k_B is later set to 1; please state explicitly that units are chosen so that k_B=1, or remove k_B to avoid confusion with the temperature scaling.
Circularity Check
The critical temperature is read off the same C and chi peaks that are then cited as evidence of the second-order transition, making the central criticality claim partly definitional.
-
self definitional
[Section III.D (Eqs. 4–5, Fig. 4); Conclusion 'Macroscopic behavior']
"As the temperature approaches the critical threshold Tc, both quantities exhibit a sharp increase, peaking precisely at Tc. This pronounced peak becomes sharper and higher with increasing network size, a hallmark of a second-order (continuous) phase transition. ... Together, these critical peaks affirm that the system undergoes a continuous phase transition analogous to that of the classical Ising model."
The paper's only operational identification of Tc is the location of the C (Eq. 4) and chi (Eq. 5) maxima in Fig. 4; no independent criterion such as a Binder cumulant, finite-size scaling collapse, or divergent correlation-length analysis is provided. Therefore 'C and chi peak precisely at Tc' is true by construction once Tc is set to the peak temperature. Using those same peaks as evidence that the transition is second-order makes the phase-transition claim depend on the very observable used to define Tc.
full rationale
The paper contains no load-bearing self-citations: the reference list includes no works by Sarmastani, Ghodrat, or Jamali, so patterns 3–5 are absent. The core circularity is the definition and use of Tc. The authors locate Tc as the temperature where the fluctuation measures C and chi peak, then cite those same peaks as the affirmative evidence for a continuous phase transition. This is a self-definitional step: the 'critical temperature' is operationally the peak of C/chi, and the claim that C/chi peak at Tc is then tautological. The additional criticality hallmarks (long-range temporal and spatial correlations, power-law cluster sizes) are measured at the T = 18 that was selected because of those peaks, so they are conditional on the circularly identified Tc rather than independent predictions. This is not a fully fabricated circularity — the correlation functions and cluster-size distributions are genuine measurements that could in principle have failed to show the reported behavior — but the absence of any independent critical-point criterion (no finite-size scaling, no detailed-balance check for the non-Markovian dynamics) leaves the central claim resting on a parameter read off from the very observables used to validate it. The supercritical T = 40 power-law cluster distribution further weakens the uniqueness of the critical-regime signature. Overall, the central claim is partially circular, meriting a score of 6 rather than a higher score, because some evidence (e.g., the L-dependence of the peaks) has independent content and the model is tested against its own simulations rather than against external benchmarks.
Assumptions & free parameters
free parameters (3)
- Critical temperature T_c =
18
- ON time duration =
not stated
- OFF time duration =
not stated
assumptions (4)
- domain assumption Metropolis acceptance probability with Boltzmann factor e^{-ΔH/T} describes the transition dynamics after refractory counters finish.
- domain assumption A 2D lattice with 28 neighbors and periodic boundary conditions is a sufficient representation of cortical connectivity.
- ad hoc to paper Peaks in variance-based quantities C and chi locate a second-order phase transition without finite-size scaling analysis.
- ad hoc to paper Power-law fitting of cluster size distributions with R^2 values indicates criticality.
Cite this review
Pith. "Pith review of A Neuronal Model at the Edge of Criticality: An Ising-Inspired Approach to Brain Dynamics." pith.science (2026). https://pith.science/paper/C7J6TGED
@misc{pith2026250607027,
  author       = {Pith},
  title        = {Pith review of: A Neuronal Model at the Edge of Criticality: An Ising-Inspired Approach to Brain Dynamics},
  year         = {2026},
  howpublished = {\url{https://pith.science/paper/C7J6TGED}},
  note         = {Machine review of arXiv:2506.07027}
}
abstract
We present a neuronal network model inspired by the Ising model, where each neuron is a binary spin ($s_i = \pm1$) interacting with its neighbors on a 2D lattice. Updates are asynchronous and follow Metropolis dynamics, with a temperature-like parameter $T$ introducing stochasticity. To incorporate physiological realism, each neuron includes fixed on/off durations, mimicking the refractory period found in real neurons. These counters prevent immediate reactivation, adding biologically grounded timing constraints to the model. As $T$ varies, the network transitions from asynchronous to synchronised activity. Near a critical point $T_c$, we observe hallmarks of criticality: heightened fluctuations, long-range correlations, and increased sensitivity. These features resemble patterns found in cortical recordings, supporting the hypothesis that the brain operates near criticality for optimal information processing. This simplified model demonstrates how basic spin interactions and physiological constraints can yield complex, emergent behavior, offering a useful tool for studying criticality in neural systems through statistical physics.
Figures


Figures from the paper (3 more)


Reference graph
Works this paper leans on
-
[1]
Time Correlation The time correlation or autocorrelation function (ACF) of the neural network activity is calculated using the following expression [25], analogous to time correlation analysis in the Ising model: ACF(τ ) = ⟨(M − ⟨M ⟩) (M (τ ) − ⟨M ⟩)⟩ ⟨M 2⟩ − ⟨M ⟩2 (6) where M (t) is the network activity at timet, τ is the time delay and⟨M ⟩ is the averag...
-
[2]
Spatial Correlation Spatial correlation quantifies how the state of one neuron is statistically dependent on the state of another neuron located at a distancer away. This is measured using the normalized two-point correlation function: C(r) = ⟨SSr⟩ − ⟨S⟩⟨Sr⟩ ⟨S2⟩ − ⟨S⟩2 (7) where S is the state of neuron , andSr denotes the state of the neuron located a d...
-
[3]
J. M. Beggs,The cortex and the critical point: understanding the power of emergence (MIT Press, 2022)
work page 2022
-
[4]
W. L. Shew and D. Plenz, The Neuroscientist19, 88 (2013)
work page 2013
-
[5]
J. M. Beggs and D. Plenz, Journal of neuroscience23, 11167 (2003)
work page 2003
-
[6]
D. R. Chialvo, Nature physics6, 744 (2010). 10
work page 2010
- [7]
-
[8]
G. Hahn, T. Petermann, M. N. Havenith, S. Yu, W. Singer, D. Plenz, and D. Nikolić, Journal of neurophysiology 104, 3312 (2010)
work page 2010
Show all 26 references
-
[9]
Petermann, T
T. Petermann, T. C. Thiagarajan, M. A. Lebedev, M. A. Nicolelis, D. R. Chialvo, and D. Plenz, Proceedings of the National Academy of Sciences106, 15921 (2009)
2009
-
[10]
J. M. Beggs and N. Timme, Frontiers in Physiology3, 10.3389/fphys.2012.00163 (2012)
2012 arXiv
-
[11]
San Miguel, Frontiers in Complex Systems1, 10.3389/fcpxs.2022.1080801 (2023)
M. San Miguel, Frontiers in Complex Systems1, 10.3389/fcpxs.2022.1080801 (2023)
2023
-
[12]
Shriki, J
O. Shriki, J. Alstott, F. Carver, T. Holroyd, R. N. Henson, M. L. Smith, R. Coppola, E. Bullmore, and D. Plenz, Journal of Neuroscience33, 7079 (2013)
2013
-
[13]
Plenz and W
D. Plenz and W. Shew, Neuronal avalanches, inEncyclopedia of Computational Neuroscience (Springer, 2022) pp. 2361–2368
2022
-
[14]
Tkacik, E
G. Tkacik, E. Schneidman, M. J. Berry II, and W. Bialek, arXiv preprint q-bio/0611072 (2006)
2006 arXiv
-
[15]
Kuelske, arXiv preprint arXiv:2501.05394 (2025)
C. Kuelske, arXiv preprint arXiv:2501.05394 (2025)
2025 arXiv
-
[16]
Gallistel, E
C. Gallistel, E. Rolls, and D. Greene, Science166, 1028 (1969)
1969
-
[17]
Gao and X
Z. Gao and X. Wang, in2024 2nd International Conference on Mechatronics, IoT and Industrial Informatics (ICMIII) (IEEE) pp. 836–846
-
[18]
Weistuch, L
C. Weistuch, L. R. Mujica-Parodi, and K. Dill, Neural Computation33, 1145 (2021)
2021
-
[19]
G. A. Worrell, S. D. Cranstoun, J. Echauz, and B. Litt, Neuroreport13, 2017 (2002)
2002
-
[20]
Barrat, M
A. Barrat, M. Barthelemy, and A. Vespignani,Dynamical processes on complex networks (Cambridge university press, 2008)
2008
-
[21]
Anwar, I
H. Anwar, I. Hepburn, and E. De Schutter, BMC Neuroscience13, P152 (2012)
2012
-
[23]
Hu and B
K. Hu and B. Davletov, The FASEB journal17, 130 (2003)
2003
-
[24]
Arieli, A
A. Arieli, A. Sterkin, A. Grinvald, and A. Aertsen, Science273, 1868 (1996)
1996
-
[25]
J. M. Shine, Interface focus13, 20220079 (2023)
2023
-
[26]
M. R. Picciotto, M. J. Higley, and Y. S. Mineur, Neuron76, 116 (2012)
2012
-
[27]
Pathria and P
R. Pathria and P. Beale,Statistical Mechanics (Butterworth-Heinemann, 2011)
2011
Reviewed August 7, 2026 · model on record in the stance chip above.
Discussion (0). Sign in to comment.