REVIEW 3 major objections 5 minor 1 cited by
Interpreting Agent Behaviors in Reinforcement-Learning-Based Cyber-Battle Simulation Platforms
T0 review · 3 major / 5 minor · reviewed 2026-08-07 · deepseek-v4-flash
Pith's one-line read Tracking each host's ground-truth state in a cyber-defense simulator reveals that many of the top agents' defensive actions are ineffective, with decoys blocking up to 94% of direct privileged exploits.
desk verdict A useful interpretability study of CAGE Challenge 2 agents whose headline action-effectiveness numbers are weakened by an unresolved same-host attribution problem. read the letter →
The pith
A machine-rendered reading of the paper's core claim, the machinery that carries it, and where it could break.
The reading
What carries the argument
The central object is a per-host ground-truth state tracker built on the simulator's 'true table', which records each host's state (undefined, unknown, known, none, user, privileged) before every blue action and after every state change. Because the network state factorizes into independent per-host states, the authors can associate each red and blue action with the pre- and post-state of the host it targets; when the two agents act on different hosts in the same time step, the action's effect is unambiguous. This per-host transition data is the machinery behind all three quantitative results: action-effectiveness percentages, infiltration-duration distributions, and decoy blocking rates.
What would settle it
Restrict the state-transition analysis to time steps in which the blue and red agents acted on different hosts, recompute the effectiveness percentages for remove, restore, escalate, and exploit, and compare with the reported values; if the restricted percentages differ materially, the reported 40-99% ineffectiveness range is not solely attributable to the scored actions.
Extended reading notes
Core claim
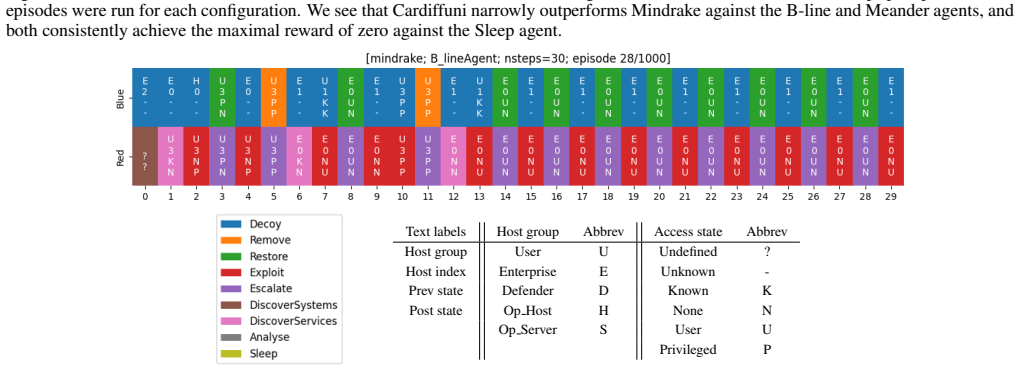
The central discovery is that an agent's action effectiveness can be quantified by slicing the simulation into per-host state transitions: the full network state is the product of the states of its exposed hosts, and reading the simulator's ground-truth table before each blue action lets the authors record every host-state change and associate it with the action immediately preceding it. Using this, they find that successful exploits grant user access roughly three to four times as often as privileged access; that remove actions almost never act on a user-level foothold (0.12% and 0.26% for the two agents) even though one agent uses removes as about half of its actions; that roughly 65-70% of restores act on user-level access where a remove would have sufficed; that 40-45% of escalates are applied to already-privileged hosts; and that roughly 40% of service-discovery actions rescan known hosts. They also observe that infiltration events are cleared within one or two time steps in most cases, and that decoy services cut direct privileged-exploit success sharply when present, at the cost of some additional user-level compromises. Overall, these measurements show that certain important actions are between 40% and 99% ineffective.
Load-bearing premise
The effectiveness percentages assume that when a host's state changes during a time step, the change was caused by the action being scored, even if the opposing agent also acted on that same host during that same time step.
Editorial extensions
If this is right
- Defenders in CAGE Challenge 2 are substantively competent at incident response: they clear infiltrations within one or two time steps in most episodes, so the bottleneck is not speed of cleanup.
- A large fraction of remove, restore, and escalate actions are wasted, so similar defensive scores could likely be reached with far fewer actions and less negative reward if agents avoided redundant actions.
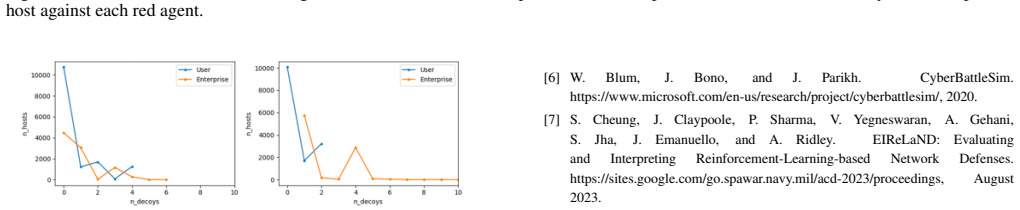
- Decoys are highly effective at preventing privileged access, so deceptive services are a worthwhile defensive investment in this environment, even though they shift some attacks toward user-level compromises.
- The measurement approach transfers to other cyber-battle simulators: any environment where per-host true state can be logged before and after each action can produce the same kind of effectiveness audit.
- CAGE Challenge 4's design changes, including multi-zone networks, multi-step actions, blocking actions, and decoy detection, will change these quantitative results, so they should be re-measured rather than assumed to carry over directly.
Reading between the lines
- We infer that the reported ineffectiveness percentages should be treated as an upper-bound estimate until the attribution caveat is resolved, because the paper does not state whether the transition statistics were restricted to time steps where the two agents acted on different hosts.
- A natural extension not proposed in the paper is to use the same per-host transition audit as a reward-shaping signal during training, explicitly penalizing redundant escalates, wasted removes, and service rescans.
- An additional testable inference is that a random or rule-based blue agent might show similar waste rates; if it does, the ineffectiveness may be a property of the environment's action definitions rather than of the learned policies.
- We infer that making decoy services fingerprintable, as CAGE Challenge 4 begins to do, would likely reduce the observed 94% blocking rate for privileged exploits.
Editorial analysis
A structured set of objections, weighed in public.
Referee Report
Summary. This paper analyzes two open-source agents from the CAGE Challenge 2 cyber-defense RL competition (Cardiffuni and Mindrake) on the CybORG platform. The authors instrument the simulator to record per-host ground-truth state at each time step, then aggregate state transitions to measure the effectiveness of individual red and blue actions, study infiltration and clearing events, and examine the association between decoy services and exploit success. They report that many important actions are 40–99% ineffective, that defenders clear infiltrations within one or two time steps, and that decoys block up to 94% of privileged exploits. They also discuss realism gaps and how CAGE Challenge 4 addresses some of them.
Significance. If the quantitative findings hold, the paper provides a useful methodology for interpretability of RL agents in cyber-defense simulators: per-host state tracking plus event-based visualization is a sensible approach that could transfer to similar gyms. The infiltration-duration and clearing-time analyses (Figures 8–11) are straightforward and likely robust, and the discussion of CC2 vs. CC4 realism is a useful contribution. However, the headline claims about action effectiveness and decoy causality rest on attribution and causal assumptions that are not fully supported by the data as presented. The paper is transparent about its inability to reproduce official quantitative results, and it identifies several realistic limitations of CC2.
major comments (3)
- [Examining state transitions / Figure 7] The central measurement of action effectiveness is compromised by an unresolved attribution ambiguity. The paper correctly notes that when both agents act on the same host within a time step, the observed end-of-step state cannot be attributed to either action, and that independence holds only when they act on different hosts. However, the text and Figure 7's caption refer to 'the percentage of all actions of the type indicated,' with no statement that the analysis was restricted to time steps where red and blue acted on different hosts. If same-host steps were included, the transition counts for remove, restore, exploit, and escalate (Figures 7a–7d) conflate both agents' effects and can produce cancellation or double-attribution, directly undermining the claim that important actions are 40–99% ineffective. The authors must either filter to unambiguously attributable time steps and report the resulting sample sizes, or provide a sensitivity analysis demonstrating that the percentages are unchanged when same-host steps are excluded.
- [Decoy analysis results / Figures 12–15] The causal claim that decoys 'block up to 94% of exploits that would directly grant privileged access to a host' is an overreach on the correlational evidence presented. The data show a relationship between the number of decoys on a host and the number of successful privileged exploits, but this is an observational association. Confounders such as host subnet, time since episode start, the red agent type, and whether the host was already infiltrated are not controlled for. The non-monotonic patterns are explained post hoc via subnet splits and decoy deployment counts, but no causal identification strategy (e.g., comparing the same agent/policy with and without decoys, or a counterfactual analysis) is provided. The authors should either weaken the language to 'associated with' and explicitly discuss alternative explanations, or perform a controlled comparison to justify the word 'block.'
- [Analysis using the official evaluation script] The statement that 'Our analysis agrees qualitatively with the official CAGE evaluations, but we were not able to reproduce their quantitative results' is a significant unresolved discrepancy. Because all subsequent quantitative analyses (Figures 3, 5–15) are derived from these evaluation runs, the non-reproduction raises the possibility of a systematic error in the evaluation setup, the modified script, or the data-recording process. The paper neither investigates the source of the discrepancy nor demonstrates that its specific quantitative findings (e.g., '0.12% of Mindrake's actions are removes') are robust to it. Without such a discussion, the numerical precision of the reported percentages lacks a clear validity anchor and the reader cannot assess whether the results are an artifact of the modified pipeline.
minor comments (5)
- [Figure 7 caption] The matrix layout in Figure 7 is difficult to interpret; the 'count' rows/columns and the cell percentages are not clearly distinguished, and the note about excluding sleep-agent episodes is easy to miss. A worked example of how to read one cell (e.g., 'Exploit from User to Privileged') would improve readability.
- [Figure 4 legend] The legend defines abbreviations (U, E, D, H, Op S, etc.) that are not all immediately mapped to the visualization's text labels; please ensure every abbreviation appears and is explained in the figure or caption.
- [Typo in Decoy analysis results] The phrase 'both nontrival red agents' should be 'both nontrivial red agents.'
- [Reproducibility] The modified evaluation script and state-tracking code are not released; given that the analysis relies on a custom instrumentation of CybORG, providing a code repository or a detailed pseudocode appendix would greatly aid reproducibility.
- [Reference [7]] Reference [7] (EIReLaND) points to a conference proceedings page; please verify that this is the intended, publicly accessible location and consider adding an arXiv identifier if available.
Circularity Check
No significant circularity: the results are direct empirical measurements from simulator ground-truth state logs, with no fitted parameters, no predictions defined in terms of outputs, and no load-bearing self-citations.
full rationale
The paper's load-bearing claims—the action-effectiveness percentages in Figure 7, infiltration clearing times in Figures 8–9, and decoy blocking rates in Figures 12–14—are computed by instrumenting the CybORG evaluation script to record the ground-truth 'true table' state of each host before every blue action and by logging the agents' actions. There is no fitted parameter estimated from a subset of data and then presented as a prediction of a closely related quantity; no equation defines the output in terms of an input; and no prior result by the authors is invoked to force a modeling choice. The only self-citation, EIReLaND [7], appears in a background list of RL cyber-defense platforms and in related work, and it does not support any derivation in the paper. The authors explicitly acknowledge the attribution limitation in the 'Examining state transitions' section: because only the state at the start and end of each time step is observed, they state that attribution is unambiguous only when the two agents act on different hosts in the same time step. Whether Figure 7 was restricted to such non-interfering steps is a measurement-validity caveat, not a circularity. The decoy and infiltration findings are likewise direct event counts from ground-truth state logs. Because the central claims are observational summaries rather than derived predictions or fitted outputs, the analysis is self-contained and non-circular.
Assumptions & free parameters
assumptions (5)
- domain assumption The CybORG 'true table' provides accurate ground-truth state of every host before every blue action.
- domain assumption Immediate state transitions are a valid measure of action effectiveness, ignoring delayed benefits such as Analyze enabling later decisions.
- domain assumption When blue and red act on different hosts, their effects are independent and each action's effect can be attributed to that action alone.
- domain assumption The official evaluation script, as modified by each team, correctly loads the agents and faithfully executes the environment.
- domain assumption The red agents' exploit success probabilities are stationary and unaffected by unobserved confounders when correlating decoys with exploit outcomes.
Cite this review
Pith. "Pith review of Interpreting Agent Behaviors in Reinforcement-Learning-Based Cyber-Battle Simulation Platforms." pith.science (2026). https://pith.science/paper/GLMKJYAY
@misc{pith2026250608192,
  author       = {Pith},
  title        = {Pith review of: Interpreting Agent Behaviors in Reinforcement-Learning-Based Cyber-Battle Simulation Platforms},
  year         = {2026},
  howpublished = {\url{https://pith.science/paper/GLMKJYAY}},
  note         = {Machine review of arXiv:2506.08192}
}
read the original abstract
We analyze two open source deep reinforcement learning agents submitted to the CAGE Challenge 2 cyber defense challenge, where each competitor submitted an agent to defend a simulated network against each of several provided rules-based attack agents. We demonstrate that one can gain interpretability of agent successes and failures by simplifying the complex state and action spaces and by tracking important events, shedding light on the fine-grained behavior of both the defense and attack agents in each experimental scenario. By analyzing important events within an evaluation episode, we identify patterns in infiltration and clearing events that tell us how well the attacker and defender played their respective roles; for example, defenders were generally able to clear infiltrations within one or two timesteps of a host being exploited. By examining transitions in the environment's state caused by the various possible actions, we determine which actions tended to be effective and which did not, showing that certain important actions are between 40% and 99% ineffective. We examine how decoy services affect exploit success, concluding for instance that decoys block up to 94% of exploits that would directly grant privileged access to a host. Finally, we discuss the realism of the challenge and ways that the CAGE Challenge 4 has addressed some of our concerns.
Figures


Figures from the paper (10 more)




Forward citations
Cited by 1 Pith paper
-
Strategic Cyber Defense via Reinforcement Learning-Guided Combinatorial Auctions
RL Q-values are used as bids in a learned combinatorial auction that allocates defensive actions in the DARPA CAGE 2 simulation, giving revenue near an oracle and allocations loosely aligned with defender activity.
Reference graph
Works this paper leans on
-
[1]
https://github.com/cage-challenge/cage-challenge-2, 2022
Cyber Autonomy Gym for Experimentation (CAGE) Challenge 2. https://github.com/cage-challenge/cage-challenge-2, 2022. Created by Maxwell Standen, David Bowman, Son Hoang, Toby Richer, Martin Lucas, Richard Van Tassel, Phillip Vu, Mitchell Kiely
work page 2022
-
[2]
https://github.com/john- cardiff/-cyborg-cage-2, 2022
Team Cardiffuni’s CAGE-2 Challenge Submission. https://github.com/john- cardiff/-cyborg-cage-2, 2022
work page 2022
-
[3]
https://github.com/alan- turing-institute/cage-challenge-2-public, 2022
Team Mindrake’s CAGE-2 Challenge Submission. https://github.com/alan- turing-institute/cage-challenge-2-public, 2022
work page 2022
-
[4]
https://github.com/cage-challenge, 2024
TTCP CAGE Challenges. https://github.com/cage-challenge, 2024
work page 2024
-
[5]
C. Baillie, M. Standen, J. Schwartz, M. Docking, D. Bowman, and J. Kim. CybORG: An Autonomous Cyber Operations Research Gym. https://arxiv.org/abs/2002.10667, 2020
arXiv 2002
-
[6]
W. Blum, J. Bono, and J. Parikh. CyberBattleSim. https://www.microsoft.com/en-us/research/project/cyberbattlesim/, 2020
work page 2020
- [7]
- [8]
Show all 15 references
-
[9]
Kiely, D
M. Kiely, D. Bowman, M. Standen, and C. Moir. On Autonomous Agents in a Cyber Defence Environment. https://arxiv.org/abs/2309.07388, 2023
2023 arXiv
-
[10]
Lippmann, D
R. Lippmann, D. J. Fried, I. Graf, J. W. Haines, K. R. Kendall, D. McClung, D. J. Weber, S. E. Webster, D. Wyschogrod, R. K. Cunningham, and M. A. Zissman. Evaluating Intrusion Detection Systems: The 1998 DARPA Off-line Intrusion Detection Evaluation. Proceedings DARPA Informa...
1998
-
[11]
J. McHugh. Testing Intrusion Detection Systems: A Critique of the 1998 and 1999 DARPA Intrusion Dtection System Evaluations as Performed by Lincoln Laboratory. ACM Trans. Inf. Syst. Secur ., 3(4):262–294, nov 2000
1998
-
[12]
Molina-Markham, C
A. Molina-Markham, C. Miniter, B. Powell, and A. Ridley. Network Environ- ment Design for Autonomous Cyberdefense. https://arxiv.org/abs/2103.07583, 2021
2021 arXiv
-
[13]
TTCP CAGE Challenge 4
TTCP CAGE Working Group. TTCP CAGE Challenge 4. https://github.com/cage-challenge/cage-challenge-4, 2024
2024
-
[14]
S. Vyas, J. Hannay, A. Bolton, and P. P. Burnap. Automated Cyber Defence: A Review. https://arxiv.org/abs/2303.04926, 2023
2023 arXiv
-
[15]
M. Wolk, A. Applebaum, C. Dennler, P. Dwyer, M. Moskowitz, H. Nguyen, N. Nichols, N. Park, P. Rachwalski, F. Rau, and A. Webster. Beyond CAGE: In- vestigating Generalization of Learned Autonomous Network Defense Policies. https://arxiv.org/abs/2211.15557, 2022. 8
2022 arXiv
Reviewed August 7, 2026 · model on record in the stance chip above.
Discussion (0). Sign in to comment.