REVIEW 3 major objections 5 minor 1 cited by
Stop Misusing t-SNE and UMAP for Visual Analytics
T0 review · 3 major / 5 minor · reviewed 2026-08-07 · deepseek-v4-flash
Pith's one-line read This paper argues that the persistent misuse of t-SNE and UMAP in visual analytics is caused primarily by limited practitioner literacy in dimensionality reduction, and that educational papers have failed to fix it, motivating a proposal…
desk verdict Useful empirical portrait of DR misuse, but the causal diagnosis of 'limited literacy' outruns the evidence; the prevalence data is the real contribution. read the letter →
The pith
A machine-rendered reading of the paper's core claim, the machinery that carries it, and where it could break.
The reading
What carries the argument
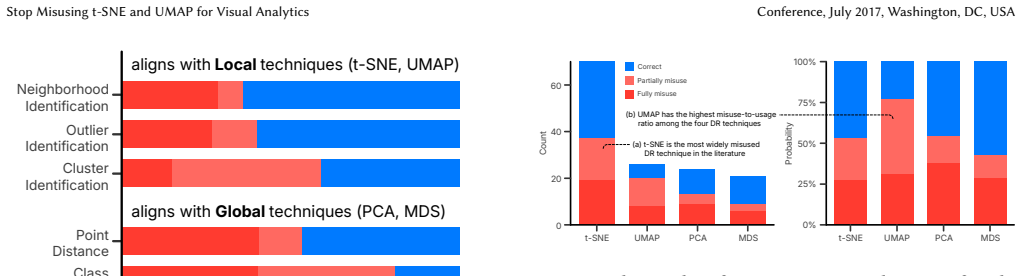
The load-bearing distinction is between local and global dimensionality-reduction techniques. t-SNE and UMAP are classified as local techniques that preserve neighborhoods, making them suitable for neighborhood, outlier, and cluster identification; PCA and MDS are classified as global techniques that preserve pairwise distances, making them suitable for point-distance, class-separability, cluster-distance, and cluster-density investigation. This task–technique alignment, validated against prior benchmark studies, is the yardstick that labels a paper as correct, partially misused, or fully misused, and the interview findings explain why that yardstick is not being applied by practitioners.
What would settle it
A direct refutation would be a controlled study in which practitioners who demonstrably understand t-SNE and UMAP's local/global distinction still choose them for cluster-distance or density tasks at the same rate as less literate users, or a longitudinal corpus analysis showing that misuse persists undiminished after auto-recommendation tools are widely adopted; either result would undercut the claim that limited literacy is the primary cause and that automation is the remedy.
Extended reading notes
Core claim
The central claim is that t-SNE and UMAP are systematically misused because most practitioners do not understand what these methods preserve. t-SNE and UMAP are local techniques: they faithfully show neighborhoods, outliers, and clusters, but distances between clusters, cluster density, class separability, and point distances are not faithful in their projections. The literature review codes each of 136 papers by technique, analytic task, and justification, and finds that local tasks are mostly handled correctly while global tasks are often attempted with t-SNE and UMAP, making UMAP the technique with the highest misuse-to-usage ratio. The practitioner interviews add mechanism: participants report difficulty choosing hyperparameters, unawareness of alternatives, trust in recommendations from advisors, papers, and ChatGPT, and deliberate tuning for aesthetically pleasing, well-separated clusters. The expert interviews add why warnings fail: reading and synthesizing the cautionary literature is demanding, well-maintained libraries make t-SNE and UMAP the path of least resistance, and a perceptual bias toward separated clusters makes these exaggerating methods feel right. The paper concludes that educational campaigns alone will not stop the misuse and cautiously proposes automated selection of DR projections as the practical remedy.
Load-bearing premise
The load-bearing premise is that the 12 practitioners' self-reported reasons for using t-SNE and UMAP reflect their actual decision processes, rather than after-the-fact justifications; if institutional incentives, reviewer norms, or library defaults are the true drivers, the proposed automated remedy addresses symptoms rather than causes.
Editorial extensions
If this is right
- If the diagnosis is right, more tutorial papers and guidelines will not reduce misuse; effort should shift to tooling and automated recommendation.
- A practical VoyagerDR-style library that takes a dataset and an analytic task and outputs a recommended DR technique and hyperparameters would make correct usage the default for non-experts.
- Reviewers and venues treating DR choice as a critical decision would be a necessary complement, since the literature review shows misuse passes peer review in major venues.
- Making such automation explainable could let practitioners build literacy while offloading configuration, preserving agency.
- The same literacy problem likely applies to other machine-learning components in visual analytics, so the paper's argument generalizes beyond t-SNE and UMAP.
Reading between the lines
- If language models are already a common source of DR recommendations, an automated recommender that is itself transparent about task–technique fit could counterbalance the popularity bias in LLM outputs; a direct test would be whether users following VoyagerDR-style advice choose more appropriate techniques than users following ChatGPT advice.
- The perceptual-bias finding suggests that even a perfect DR oracle may face adoption resistance when its recommended projection looks less clean than a t-SNE plot; user studies comparing trust in automated versus familiar projections would settle this.
- The paper's evidence is concentrated in visual analytics venues; extending the same coding scheme to bioinformatics, chemistry, and machine-learning application papers would test whether the misuse-to-usage pattern generalizes.
- A concrete measurable prediction of the paper is that misuse rates in published papers decline after auto-recommendation tools become widely available; this could be checked with a longitudinal version of the authors' corpus review.
Editorial analysis
A structured set of objections, weighed in public.
Referee Report
Summary. This paper investigates the widespread misuse of t-SNE and UMAP in visual analytics. It combines a literature review of 136 papers, semi-structured interviews with 12 practitioner researchers, and interviews with 8 DR experts to establish (i) that t-SNE and UMAP are the most frequently used and misused DR techniques, (ii) that practitioners often lack DR literacy and rely on misleading suggestions, and (iii) that existing paper-based guidance has been ineffective. Based on these findings, the paper proposes delegating DR configuration to an automated 'VoyagerDR' library, while discussing how to preserve user agency. The central claim is that misuse 'stems primarily from limited DR literacy among practitioners' (Abstract, Sect. 9).
Significance. If the empirical findings hold, this paper provides a valuable, quantified account of a problem that is often discussed anecdotally. The literature review offers a concrete corpus and a reusable task taxonomy, and the two interview studies give a rare practitioner-side perspective. The authors are explicit about the limitations of paper-based education and articulate a controversial but concrete alternative (VoyagerDR), with an honest discussion of its agency costs. The paper's main strength is its triangulation of prevalence evidence with qualitative self-reports. Its main weakness is that the causal claim about the primacy of DR literacy is inferred from a small, partially snowball-sampled interview pool and from expert opinion, without a comparative test against alternative mechanisms such as library defaults, reviewer norms, or perceptual biases. The significance is conditional on this causal claim: if the true primary driver is institutional or infrastructural rather than cognitive, the proposed direction would address only part of the problem. The paper ships no code or data, but the review protocol is described in sufficient detail to be replicable.
major comments (3)
- [Abstract; Sect. 5.2; Sect. 9] The central claim that misuse 'stems primarily from limited DR literacy' is not supported by the interview evidence in the form presented. Sect. 5.2 draws on self-reports from 12 participants, recruited partly through snowball sampling at a local university, and the questions ask participants about their own difficulties and choices. Such reports can reflect post hoc rationalization, and they do not compare literacy against other mechanisms. Sect. 6.2 itself identifies at least three coexisting causes: difficulty of learning DR (Finding 1), library availability and defaults (Finding 2), and intrinsic perceptual bias toward well-separated clusters (Finding 3). With multiple plausible drivers named in the same paper, the word 'primarily' requires either a comparative design (e.g., a literacy-contrast test or a regression on corpus-level variables) or a more cautious claim. Without this, the conclusion that paper-based guidance is ineffective and that VoyagerDR is the right remedy does not strictly follow.
- [Sect. 4.3; Fig. 4; Fig. 5] The misuse labels in the quantitative analysis are derived from a task-suitability classification that leans on prior benchmarks, including the authors' own quality metrics (Jeon et al. [31,33]) and their UMATO paper. This creates a potential circularity: the same criteria that motivate UMATO are used to define which uses of t-SNE and UMAP count as misuse. The paper does not report a sensitivity analysis, such as re-labeling with an alternative benchmark (e.g., Xia et al. [74] alone) to see whether the prevalence findings in Fig. 5 remain stable. Since H2 and the 'highest misuse-to-usage ratio' statement depend on these labels, this should be addressed, either by strengthening the external validity of the benchmarks or by acknowledging the dependence and showing that the conclusions survive across candidate criteria.
- [Sect. 4.1; Sect. 4.2] The literature review protocol reports that two coders categorized papers and resolved disagreements through discussion, but it does not report inter-coder reliability statistics or the number of disagreements. Given that the categorization feeds directly into quantitative claims (e.g., 'more than half of identified papers use t-SNE', '44% give no reasoning'), the absence of reliability evidence makes it difficult to assess how robust the prevalence estimates are. A short paragraph reporting counts or a kappa statistic would substantially strengthen the empirical foundation of O1.
minor comments (5)
- [Affiliations] The affiliation for Sungbok Shin lists 'Scalay, France'; this should be 'Saclay, France'.
- [Fig. 6] The x-axis of Fig. 6 is said to be sorted by the reference count for t-SNE, but the order of 'Adaptability' and 'Intuitiveness' at the right end is not visible in the figure as printed; consider ordering all panels by the same criterion or adding an explicit legend.
- [Sect. 4.4, Finding 2] The sentence 'However, tasks requiring global techniques have a substantially lower rate of proper usage' appears twice, once immediately after the first mention; remove the duplicate.
- [Sect. 2.2; Sect. 5.1] The paper would benefit from a brief note on whether the interview questionnaires were piloted, and whether the practitioner interviews were coded by more than one researcher; as written, the qualitative coding process for the interviews is less transparent than the literature review coding.
- [Appendix A] The list of 136 papers is said to be in Appendix A, but the version provided does not include the appendix contents; please ensure the appendix is present in the final submission.
Circularity Check
No significant circularity: prevalence, misuse, and literacy findings rest on the paper's own 136-paper corpus and interviews; only minor, externally corroborated self-citations appear in the task-suitability ground truth and the VoyagerDR feasibility argument.
-
self citation load bearing
[Sect. 4.1 (Task suitability review), applied in Sect. 4.4 Finding 2 and Figs. 4-5]
"We identify the suitability of DR techniques for analytic tasks by examining research that verifies the weaknesses and strengths of different DR techniques [31, 33, 54, 74] (Sect. 2.2)."
Finding 2's misuse-to-usage ratio is computed by applying this task-suitability matrix to the usage data, but the matrix is justified partly by the authors' own prior metrics papers, [31] (UMATO) and [33] (Classes are Not Clusters), which already concluded that t-SNE and UMAP poorly preserve global structure. The headline that UMAP has the highest misuse-to-usage ratio therefore partially inherits the authors' earlier conclusions as its ground truth rather than deriving them anew from the 136-paper corpus. The reduction is only partial: every suitability assignment is also supported by external studies (Xia et al. [74], Narayan et al. [54], Espadoto et al. [19], Wattenberg et al.
full rationale
The paper's central claims are empirical measurements plus a proposal, not a derivation that reduces to its inputs. Finding 1 (usage dominance), Finding 3 (no explicit justification in more than 40% of papers), and the persistence check (Appendix C, excluding papers published before the 2016 and 2019 guideline papers) come from the authors' own protocoled corpus review; the literacy finding comes from 12 practitioner interviews and 8 expert interviews, i.e., independent primary data rather than citations. The causal priority of 'limited DR literacy' over library defaults, reviewer norms, and perceptual bias (the expert interviews in Sect. 6.2 name all three mechanisms) is a validity concern about a comparative test that was not run, not a circularity: the claim does not reduce to its inputs by construction. The one minor entanglement is that the ground-truth suitability labels used to call papers 'misused' cite the authors' own quality-metric papers ([31], [33]); because each label is also corroborated by external benchmarks and the usage counts are independently coded from the reviewed corpus, removing those self-citations would not change the findings. Similarly, the VoyagerDR feasibility argument in Sect. 8.1 cites the authors' separate Dataset-Adaptive DR study [35], but that is an independently evaluated empirical result used alongside external AutoML and Draco work, and it supports a discussion item rather than a derived prediction. No equation-level reduction, fitted-parameter-renamed-as-prediction, or imported-uniqueness pattern appears anywhere in the manuscript. Score 2 reflects the minor, non-load-bearing self-citation element only.
Assumptions & free parameters
assumptions (4)
- domain assumption Task-suitability mapping from prior benchmarks is accepted as ground truth
- domain assumption Interviewee self-reports accurately reveal why practitioners misuse DR
- domain assumption The 136-paper corpus is representative of visual analytics research using DR
- ad hoc to paper VoyagerDR can be made accurate enough to recommend optimal DR projections
invented entities (1)
-
VoyagerDR (hypothetical DR oracle library)
Cite this review
Pith. "Pith review of Stop Misusing t-SNE and UMAP for Visual Analytics." pith.science (2026). https://pith.science/paper/FXOP6UOY
@misc{pith2026250608725,
  author       = {Pith},
  title        = {Pith review of: Stop Misusing t-SNE and UMAP for Visual Analytics},
  year         = {2026},
  howpublished = {\url{https://pith.science/paper/FXOP6UOY}},
  note         = {Machine review of arXiv:2506.08725}
}
read the original abstract
Misuses of t-SNE and UMAP in visual analytics have become increasingly common. For example, although t-SNE and UMAP projections often do not faithfully reflect the original distances between clusters, practitioners frequently use them to investigate inter-cluster relationships. We investigate why this misuse occurs, and discuss methods to prevent it. To that end, we first review 136 papers to verify the prevalence of the misuse. We then interview researchers who have used dimensionality reduction (DR) to understand why such misuse occurs. Finally, we interview DR experts to examine why previous efforts failed to address the misuse. We find that the misuse of t-SNE and UMAP stems primarily from limited DR literacy among practitioners, and that existing attempts to address this issue -- mostly based on academic papers -- have been ineffective. Based on these insights, we discuss potential future research directions to mitigate the misuse.
Figures


Figures from the paper (3 more)


Forward citations
Cited by 1 Pith paper
-
Measuring Distortion in the Empty Regions of Dimensionality Reduction Scatterplots with the Gap Index
The Gap Index quantifies visual distortion in empty regions of DR scatterplots via Delaunay triangle area deformation and is more sensitive to salient gap artifacts than stress or trustworthiness.
Reference graph
Works this paper leans on
-
[74]
Jiazhi Xia, Yuchen Zhang, Jie Song, Yang Chen, Yunhai Wang, and Shixia Liu. 2021. Revisiting Dimensionality Reduction Techniques for Visual Cluster Analysis: An Empirical Study.IEEE Transactions on Visualization and Computer Graphics (2021), 1–1. doi:10.1109/TVCG.2021.3114694
arXiv 2021
-
[1]
Ehsan Amid and Manfred K. Warmuth. 2022. TriMap: Large-scale Dimensionality Reduction Using Triplets. arXiv:1910.00204 [cs.LG] https://arxiv.org/abs/1910. 00204
arXiv 2022
-
[2]
Sanjeev Arora, Wei Hu, and Pravesh K. Kothari. 2018. An Analysis of the t- SNE Algorithm for Data Visualization. In31st Conference On Learning Theory, Sébastien Bubeck, Vianney Perchet, and Philippe Rigollet (Eds.), Vol. 75. 1455–
2018
-
[4]
Daniel Atzberger, Tim Cech, Matthias Trapp, Rico Richter, Willy Scheibel, Jürgen Döllner, and Tobias Schreck. 2024. Large-Scale Evaluation of Topic Models and Dimensionality Reduction Methods for 2D Text Spatialization.IEEE Transactions on Visualization and Computer Graphics30, 1 (2024), 902–912. doi:10.1109/TVCG. 2023.3326569
arXiv 2024
-
[5]
Bárbara C. Benato, Alexandre X. Falcão, and Alexandru C. Telea. 2024. Linking Data Separation, Visual Separation, Classifier Performance Using Multidimen- sional Projections. InComputer Vision, Imaging and Computer Graphics Theory and Applications. Springer Nature Switzerland, Cham, 229–255
work page 2024
-
[6]
Jürgen Bernard, Marco Hutter, Matthias Zeppelzauer, Michael Sedlmair, and Tamara Munzner. 2021. ProSeCo: Visual analysis of class separation measures and dataset characteristics.Computers & Graphics96 (2021), 48–60. doi:10.1016/ j.cag.2021.03.004
work page 2021
-
[7]
Matthew Brehmer, Michael Sedlmair, Stephen Ingram, and Tamara Munzner
-
[8]
Dylan Cashman, Mark Keller, Hyeon Jeon, Bum Chul Kwon, and Qianwen Wang
Show all 81 references
-
[9]
Tara Chari and Lior Pachter. 2023. The specious art of single-cell genomics.PLOS Computational Biology19, 8 (08 2023), 1–20. doi:10.1371/journal.pcbi.1011288
2023 doi
-
[10]
Martins, and Andreas Kerren
Angelos Chatzimparmpas, Rafael M. Martins, and Andreas Kerren. 2020. t- viSNE: Interactive Assessment and Interpretation of t-SNE Projections.IEEE Transactions on Visualization and Computer Graphics26, 8 (2020), 2696–2714. doi:10.1109/TVCG.2020.2986996
2020
-
[11]
Chatzimparmpas, F
A. Chatzimparmpas, F. V. Paulovich, and A. Kerren. 2023. HardVis: Vi- sual Analytics to Handle Instance Hardness Using Undersampling and Over- sampling Techniques.Computer Graphics Forum42, 1 (2023), 135–154. arXiv:https://onlinelibrary.wiley.com/doi/pdf/10.1111/cgf.14726 doi:...
2023 doi
-
[12]
Longfei Chen, Chen Cheng, He Wang, Xiyuan Wang, Yun Tian, Xuanwu Yue, Wong Kam-Kwai, Haipeng Zhang, Suting Hong, and Quan Li. 2024. FMLens: Towards Better Scaffolding the Process of Fund Manager Selection in Fund Investments.IEEE Transactions on Visualization and Computer Grap...
2024
-
[13]
Nan Chen, Yuge Zhang, Jiahang Xu, Kan Ren, and Yuqing Yang. 2025. VisEval: A Benchmark for Data Visualization in the Era of Large Language Models.IEEE Transactions on Visualization and Computer Graphics31, 1 (2025), 1301–1311. doi:10.1109/TVCG.2024.3456320
2025
-
[14]
Furui Cheng, Mark S Keller, Huamin Qu, Nils Gehlenborg, and Qianwen Wang
-
[15]
Jaegul Choo, Hanseung Lee, Jaeyeon Kihm, and Haesun Park. 2010. iVisClassifier: An interactive visual analytics system for classification based on supervised dimension reduction. In2010 IEEE Symposium on Visual Analytics Science and Technology. 27–34. doi:10.1109/VAST.2010.5652443
2010
-
[16]
Andy Coenen and Adam Pearce. 2019. Understanding umap.Google PAIR(2019)
2019
-
[17]
Seoyoung Doh, Hyeon Jeon, Sungbok Shin, Ghulam Jilani Quadri, Nam Wook Kim, and Jinwook Seo. 2025. Understanding Bias in Perceiving Dimensionality Reduction Projections. arXiv:2507.20805 [cs.HC] https://arxiv.org/abs/2507.20805
2025 arXiv
-
[18]
Alex Endert, Patrick Fiaux, and Chris North. 2012. Semantic interaction for visual text analytics. InProceedings of the SIGCHI Conference on Human Factors in Computing Systems(Austin, Texas, USA)(CHI ’12). 473–482. doi:10.1145/2207676. 2207741
2012 doi
-
[19]
Martins, Andreas Kerren, Nina S
Mateus Espadoto, Rafael M. Martins, Andreas Kerren, Nina S. T. Hirata, and Alexandru C. Telea. 2021. Toward a Quantitative Survey of Dimension Reduction Techniques.IEEE Transactions on Visualization and Computer Graphics27, 3 (2021), 2153–2173. doi:10.1109/TVCG.2019.2944182
2021
-
[20]
Ronak Etemadpour, Robson Motta, Jose Gustavo de Souza Paiva, Rosane Minghim, Maria Cristina Ferreira de Oliveira, and Lars Linsen. 2015. Perception-Based Evaluation of Projection Methods for Multidimensional Data Visualization.IEEE Transactions on Visualization and Computer Gr...
2015
-
[21]
Matthias Feurer, Aaron Klein, Katharina Eggensperger, Jost Springenberg, Manuel Blum, and Frank Hutter. 2015. Efficient and robust automated machine learning. Advances in neural information processing systems28 (2015)
2015
-
[24]
Leo A. Goodman. 1961. Snowball Sampling.The Annals of Mathematical Statistics 32, 1 (1961), 148–170. http://www.jstor.org/stable/2237615
1961
-
[25]
Yi He, Ke Xu, Shixiong Cao, Yang Shi, Qing Chen, and Nan Cao. 2025. Lever- aging Foundation Models for Crafting Narrative Visualization: A Survey.IEEE Stop Misusing t-SNE and UMAP for Visual Analytics Conference, July 2017, Washington, DC, USA Transactions on Visualization and...
2025
-
[26]
Geoffrey Hinton and Sam Roweis. 2002. Stochastic Neighbor Embedding. InProc. of the 15th International Conference on Neural Information Processing Systems. MIT Press, Cambridge, MA, USA, 857–864
2002
-
[27]
Fred Hohman, Kanit Wongsuphasawat, Mary Beth Kery, and Kayur Patel. 2020. Understanding and Visualizing Data Iteration in Machine Learning. InProceedings of the 2020 CHI Conference on Human Factors in Computing Systems(Honolulu, HI, USA)(CHI ’20). 1–13. doi:10.1145/3313831.3376177
2020
-
[28]
Hyein Hong, Sangbong Yoo, Yejin Jin, and Yun Jang. 2023. How Can We Improve Data Quality for Machine Learning? A Visual Analytics System using Data and Process-driven Strategies. In2023 IEEE 16th Pacific Visualization Symposium (PacificVis). 112–121. doi:10.1109/PacificVis5693...
2023
-
[29]
Hyeon Jeon, Michaël Aupetit, Soohyun Lee, Hyung-Kwon Ko, Youngtaek Kim, and Jinwook Seo. 2022. Distortion-Aware Brushing for Interactive Cluster Analysis in Multidimensional Projections. doi:10.48550/ARXIV.2201.06379 (arXiv preprint)
2022 doi
-
[30]
Hyeon Jeon, Hyung-Kwon Ko, Jaemin Jo, Youngtaek Kim, and Jinwook Seo
-
[31]
Hyeon Jeon, Hyung-Kwon Ko, Soohyun Lee, Jaemin Jo, and Jinwook Seo. 2022. Uniform Manifold Approximation with Two-phase Optimization. In2022 IEEE Visualization and Visual Analytics (VIS). 80–84. doi:10.1109/VIS54862.2022.00025
2022
-
[32]
Hyeon Jeon, Kwon Ko, Soohyun Lee, Jake Hyun, Taehyun Yang, Gyehun Go, Jaemin Jo, and Jinwook Seo. 2025. UMATO: Bridging Local and Global Structures for Reliable Visual Analytics with Dimensionality Reduction.IEEE Transactions on Visualization and Computer Graphics(2025), 1–18....
2025 doi
-
[33]
Hyeon Jeon, Yun-Hsin Kuo, Michaël Aupetit, Kwan-Liu Ma, and Jinwook Seo
-
[34]
Hyeon Jeon, Hyunwook Lee, Yun-Hsin Kuo, Taehyun Yang, Daniel Archambault, Sungahn Ko, Takanori Fujiwara, Kwan-Liu Ma, and Jinwook Seo. 2025. Unveil- ing High-dimensional Backstage: A Survey for Reliable Visual Analytics with Dimensionality Reduction. InProceedings of the 2025 ...
2025
-
[35]
Hyeon Jeon, Jeongin Park, Soohyun Lee, Dae Hyun Kim, Sungbok Shin, and Jinwook Seo. 2025. Dataset-Adaptive Dimensionality Reduction. arXiv:2507.11984 [cs.HC] https://arxiv.org/abs/2507.11984
2025
-
[36]
Hyeon Jeon, Ghulam Jilani Quadri, Hyunwook Lee, Paul Rosen, Danielle Albers Szafir, and Jinwook Seo. 2024. CLAMS: A Cluster Ambiguity Measure for Estimat- ing Perceptual Variability in Visual Clustering.IEEE Transactions on Visualization and Computer Graphics30, 1 (2024), 770–...
2024
-
[37]
Jaemin Jo, Jinwook Seo, and Jean-Daniel Fekete. 2020. PANENE: A Progressive Algorithm for Indexing and Querying Approximate k-Nearest Neighbors.IEEE Transactions on Visualization and Computer Graphics26, 2 (2020), 1347–1360. doi:10.1109/TVCG.2018.2869149
2020
-
[38]
Andrews, Aditya Kalro, and Duen Horng Chau
Minsuk Kahng, Pierre Y. Andrews, Aditya Kalro, and Duen Horng Chau. 2018. ActiVis: Visual Exploration of Industry-Scale Deep Neural Network Models. IEEE Transactions on Visualization and Computer Graphics24, 1 (2018), 88–97. doi:10.1109/TVCG.2017.2744718
2018
-
[39]
Viégas, and Martin Wattenberg
Minsuk Kahng, Nikhil Thorat, Duen Horng Chau, Fernanda B. Viégas, and Martin Wattenberg. 2019. GAN Lab: Understanding Complex Deep Generative Models using Interactive Visual Experimentation.IEEE Transactions on Visualization and Computer Graphics25, 1 (2019), 310–320. doi:10.1...
2019
-
[40]
Hyung-Kwon Ko, Jaemin Jo, and Jinwook Seo. 2020. Progressive Uniform Mani- fold Approximation and Projection. InEuroVis 2020 - Short Papers, Andreas Kerren, Christoph Garth, and G. Elisabeta Marai (Eds.). The Eurographics Association. doi:10.2312/evs.20201061
2020 doi
-
[41]
Linderman
Dmitry Kobak and George C. Linderman. 2021. Initialization is critical for pre- serving global data structure in both t-SNE and UMAP.Nature Biotechnology39, 2 (01 Feb 2021), 156–157. doi:10.1038/s41587-020-00809-z
2021 doi
-
[42]
Chou, Chun-houh Chen, and Kwan-Liu Ma
Yun-Hsin Kuo, Takanori Fujiwara, Charles C.-K. Chou, Chun-houh Chen, and Kwan-Liu Ma. 2022. A Machine-learning-Aided Visual Analysis Workflow for In- vestigating Air Pollution Data. In2022 IEEE 15th Pacific Visualization Symposium (PacificVis). 91–100. doi:10.1109/PacificVis53...
2022
-
[43]
Bum Chul Kwon, Hannah Kim, Emily Wall, Jaegul Choo, Haesun Park, and Alex Endert. 2017. AxiSketcher: Interactive Nonlinear Axis Mapping of Visualiza- tions through User Drawings.IEEE Transactions on Visualization and Computer Graphics23, 1 (2017), 221–230. doi:10.1109/TVCG.201...
2017
-
[44]
Jan Lause, Philipp Berens, and Dmitry Kobak. 2024. The art of seeing the elephant in the room: 2D embeddings of single-cell data do make sense.bioRxiv(2024). arXiv:https://www.biorxiv.org/content/early/2024/07/31/2024.03.26.586728.full.pdf doi:10.1101/2024.03.26.586728
2024 doi
-
[45]
Lee and Michel Verleysen
John A. Lee and Michel Verleysen. 2011. Shift-invariant similarities circumvent distance concentration in stochastic neighbor embedding and variants.Procedia Computer Science4 (2011), 538–547. doi:10.1016/j.procs.2011.04.056
2011 doi
-
[46]
Wang, ShengYun Peng, Austin Wright, Kevin Li, Haekyu Park, Haoyang Yang, and Duen Horng Polo Chau
Seongmin Lee, Benjamin Hoover, Hendrik Strobelt, Zijie J. Wang, ShengYun Peng, Austin Wright, Kevin Li, Haekyu Park, Haoyang Yang, and Duen Horng Polo Chau. 2024. Diffusion Explainer: Visual Explanation for Text-to-image Stable Diffusion. In2024 IEEE Visualization and Visual A...
2024
-
[47]
Yiran Li, Junpeng Wang, Xin Dai, Liang Wang, Chin-Chia Michael Yeh, Yan Zheng, Wei Zhang, and Kwan-Liu Ma. 2023. How Does Attention Work in Vision Transformers? A Visual Analytics Attempt.IEEE Transactions on Visualization and Computer Graphics29, 6 (2023), 2888–2900. doi:10.1...
2023
- [48]
-
[49]
Linhao Meng, Stef van den Elzen, Nicola Pezzotti, and Anna Vilanova. 2024. Class-Constrained t-SNE: Combining Data Features and Class Probabilities.IEEE Transactions on Visualization and Computer Graphics30, 1 (2024), 164–174. doi:10. 1109/TVCG.2023.3326600
2024
-
[50]
Jacob Miller, Vahan Huroyan, Raymundo Navarrete, Md Iqbal Hossain, and Stephen Kobourov. 2024. ENS-t-SNE: Embedding Neighborhoods Simultaneously t-SNE. In2024 IEEE 17th Pacific Visualization Conference (PacificVis). 222–231. doi:10.1109/PacificVis60374.2024.00032
2024
-
[51]
Michael Moor, Max Horn, Bastian Rieck, and Karsten Borgwardt. 2020. Topologi- cal Autoencoders. InProceedings of the 37th International Conference on Machine Learning, Vol. 119. 7045–7054. https://proceedings.mlr.press/v119/moor20a.html
2020
-
[52]
Cristina Morariu, Adrien Bibal, Rene Cutura, Benoît Frénay, and Michael Sedlmair
-
[53]
Nelson, Halden Lin, Adam M
Dominik Moritz, Chenglong Wang, Greg L. Nelson, Halden Lin, Adam M. Smith, Bill Howe, and Jeffrey Heer. 2019. Formalizing Visualization Design Knowledge as Constraints: Actionable and Extensible Models in Draco.IEEE Transactions on Visualization and Computer Graphics25, 1 (201...
2019
-
[54]
Ashwin Narayan, Bonnie Berger, and Hyunghoon Cho. 2021. Assessing single- cell transcriptomic variability through density-preserving data visualization. Nature biotechnology39, 6 (2021), 765–774. doi:10.1038/s41587-020-00801-7
2021 doi
-
[55]
Corey Nolet, Avantika Lal, Rajesh Ilango, Taurean Dyer, Ra- jiv Movva, John Zedlewski, and Johnny Israeli. 2022. Acceler- ating single-cell genomic analysis with GPUs.bioRxiv(2022). arXiv:https://www.biorxiv.org/content/early/2022/05/28/2022.05.26.493607.full.pdf doi:10.1101/2...
2022 doi
-
[56]
Luis Gustavo Nonato and Michaël Aupetit. 2019. Multidimensional Projection for Visual Analytics: Linking Techniques with Distortions, Tasks, and Layout Enrichment.IEEE Transactions on Visualization and Computer Graphics25, 8 (2019), 2650–2673. doi:10.1109/TVCG.2018.2846735
2019
-
[57]
Karl F.R.S. Pearson. 1901. LIII. On lines and planes of closest fit to systems of points in space.The London, Edinburgh, and Dublin Philosophical Magazine and Journal of Science2, 11 (1901), 559–572. doi:10.1080/14786440109462720
1901 doi
-
[58]
Lelieveldt, Elmar Eisemann, and Anna Vilanova
Nicola Pezzotti, Julian Thijssen, Alexander Mordvintsev, Thomas Höllt, Baldur Van Lew, Boudewijn P.F. Lelieveldt, Elmar Eisemann, and Anna Vilanova. 2020. GPGPU Linear Complexity t-SNE Optimization.IEEE Transactions on Visual- ization and Computer Graphics26, 1 (2020), 1172–11...
2020 doi
-
[60]
Tim Sainburg, Leland McInnes, and Timothy Q. Gentner. 2021. Parametric UMAP Embeddings for Representation and Semisupervised Learning.Neural Com- putation33, 11 (10 2021), 2881–2907. arXiv:https://direct.mit.edu/neco/article- pdf/33/11/2881/1966656/neco_a_01434.pdf doi:10.1162...
2021 doi
-
[61]
Michael Sedlmair, Matt Brehmer, Stephen Ingram, and Tamara Munzner. 2012. Dimensionality reduction in the wild: Gaps and guidance.Dept. Comput. Sci., Univ. British Columbia(2012), 1–10
2012
-
[62]
Parikshit Solunke, Vitoria Guardieiro, João Rulff, Peter Xenopoulos, Gromit Yeuk- Yin Chan, Brian Barr, Luis Gustavo Nonato, and Claudio Silva. 2024. Mountaineer: Topology-Driven Visual Analytics for Comparing Local Explanations.IEEE Transactions on Visualization and Computer ...
2024
-
[63]
C. O. S. Sorzano, J. Vargas, and A. Pascual Montano. 2014. A survey of dimen- sionality reduction techniques. arXiv:1403.2877 [stat.ML]
2014 arXiv
-
[64]
Julian Stahnke, Marian Dörk, Boris Müller, and Andreas Thom. 2016. Probing Projections: Interaction Techniques for Interpreting Arrangements and Errors of Dimensionality Reductions.IEEE Transactions on Visualization and Computer Graphics22, 1 (2016), 629–638. doi:10.1109/TVCG....
2016
-
[65]
Mark van de Ruit, Markus Billeter, and Elmar Eisemann. 2022. An Efficient Dual-Hierarchy t-SNE Minimization.IEEE Transactions on Visualization and Computer Graphics28, 1 (2022), 614–622. doi:10.1109/TVCG.2021.3114817 Conference, July 2017, Washington, DC, USA Jeon et al
2022
-
[66]
Ilya Ploshchik, Angelos Chatzimparmpas, and Andreas Kerren. 2023. MetaStack- Vis: Visually-Assisted Performance Evaluation of Metamodels. In2023 IEEE 16th Pacific Visualization Symposium (PacificVis). 207–211. doi:10.1109/PacificVis56936. 2023.00030
2023
-
[67]
Laurens Van Der Maaten, Eric O Postma, H Jaap van den Herik, et al . 2009. Dimensionality reduction: A comparative review.Journal of Machine Learning Research10, 66-71 (2009), 13
2009
-
[68]
Jarkko Venna, Jaakko Peltonen, Kristian Nybo, Helena Aidos, and Samuel Kaski
-
[69]
Elio Ventocilla and Maria Riveiro. [n. d.]. A comparative user study of visualiza- tion techniques for cluster analysis of multidimensional data sets.Information Visualization19, 4 ([n. d.]), 318–338. doi:10.1177/1473871620922166
-
[70]
Qianwen Wang, Sehi L’Yi, and Nils Gehlenborg. 2023. DRAVA: Aligning Human Concepts with Machine Learning Latent Dimensions for the Visual Exploration of Small Multiples. InProceedings of the 2023 CHI Conference on Human Factors in Computing Systems(Hamburg, Germany)(CHI ’23). ...
2023
-
[71]
Yingfan Wang, Haiyang Huang, Cynthia Rudin, and Yaron Shaposhnik. 2021. Understanding How Dimension Reduction Tools Work: An Empirical Approach to Deciphering t-SNE, UMAP, TriMap, and PaCMAP for Data Visualization.Journal of Machine Learning Research22, 201 (2021), 1–73. http:...
2021
-
[72]
Martin Wattenberg, Fernanda Viégas, and Ian Johnson. 2016. How to Use t-SNE Effectively.Distill(2016). doi:10.23915/distill.00002
2016 doi
-
[73]
Laurens van der Maaten and Geoffrey Hinton. 2008. Visualizing Data using t-SNE.Journal of Machine Learning Research9, 86 (2008), 2579–2605
2008
-
[75]
Xiwei Xuan, Xiaoyu Zhang, Oh-Hyun Kwon, and Kwan-Liu Ma. 2022. VAC-CNN: A Visual Analytics System for Comparative Studies of Deep Convolutional Neural Networks.IEEE Transactions on Visualization and Computer Graphics28, 6 (2022), 2326–2337. doi:10.1109/TVCG.2022.3165347
2022
-
[76]
Yue Zhang et al. 2023. Siren’s Song in the AI Ocean: A Survey on Hallucination in Large Language Models. arXiv:2309.01219 [cs.CL] https://arxiv.org/abs/2309. 01219
2023 arXiv
-
[77]
Yang Zhang, Jisheng Liu, Chufan Lai, Yuan Zhou, and Siming Chen. 2024. In- terpreting High-Dimensional Projections With Capacity.IEEE Transactions on Visualization and Computer Graphics30, 9 (2024), 6038–6055. doi:10.1109/TVCG. 2023.3324851
2024
-
[78]
Yuansheng Zhou and Tatyana O. Sharpee. 2022. Using Global t- SNE to Preserve Intercluster Data Structure.Neural Computation 34, 8 (07 2022), 1637–1651. arXiv:https://direct.mit.edu/neco/article- pdf/34/8/1637/2034896/neco_a_01504.pdf doi:10.1162/neco_a_01504
2022 doi
-
[82]
Jiazhi Xia, Linquan Huang, Weixing Lin, Xin Zhao, Jing Wu, Yang Chen, Ying Zhao, and Wei Chen. 2022. Interactive Visual Cluster Analysis by Contrastive Dimensionality Reduction.IEEE Transactions on Visualization and Computer Graphics(2022), 1–11. doi:10.1109/TVCG.2022.3209423
2022
-
[490]
doi:10.5555/1756006.1756019
-
[1462]
https://proceedings.mlr.press/v75/arora18a.html
-
[2010]
Information Retrieval Perspective to Nonlinear Dimensionality Reduction for Data Visualization.Journal of Machine Learning Research11, 13 (2010), 451–
2010
-
[2014]
Visualizing Dimensionally-Reduced Data: Interviews with Analysts and a Characterization of Task Sequences. InProc. of the Fifth Workshop on Beyond Time and Errors: Novel Evaluation Methods for Visualization(Paris, France)(BELIV ’14). 1–8. doi:10.1145/2669557.2669559
-
[2024]
doi:10.1109/TVCG.2023.3327187
Classes are Not Clusters: Improving Label-Based Evaluation of Dimension- ality Reduction.IEEE Transactions on Visualization and Computer Graphics30, 1 (2024), 781–791. doi:10.1109/TVCG.2023.3327187
2024
-
[2025]
doi:10.1109/TVCG.2025.3567989
A Critical Analysis of the Usage of Dimensionality Reduction in Four Domains.IEEE Transactions on Visualization and Computer Graphics(2025), 1–20. doi:10.1109/TVCG.2025.3567989
2025
Reviewed August 7, 2026 · model on record in the stance chip above.
Discussion (0). Sign in to comment.