Self-learning signal classifier for decameter coherent scatter radars
Pith reviewed 2026-05-19 10:20 UTC · model grok-4.3
The pith
A self-learning classifier for decameter radar signals identifies 14 reliably separated classes using only data and ionospheric models.
A machine-rendered reading of the paper's core claim, the machinery that carries it, and where it could break.
Core claim
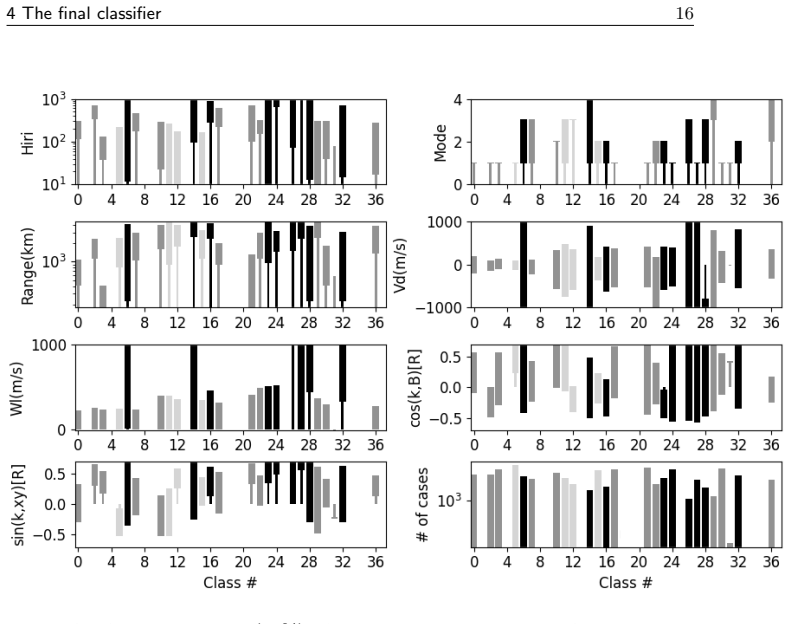
The paper claims that training a classifier on combined radar measurements and modeled propagation parameters, selected for optimal quality by mathematical criteria, produces 37 data classes of which 25 occur frequently and 14 remain distinct in alternative trainings, with dynamics consistent with known ionospheric physics.
What carries the argument
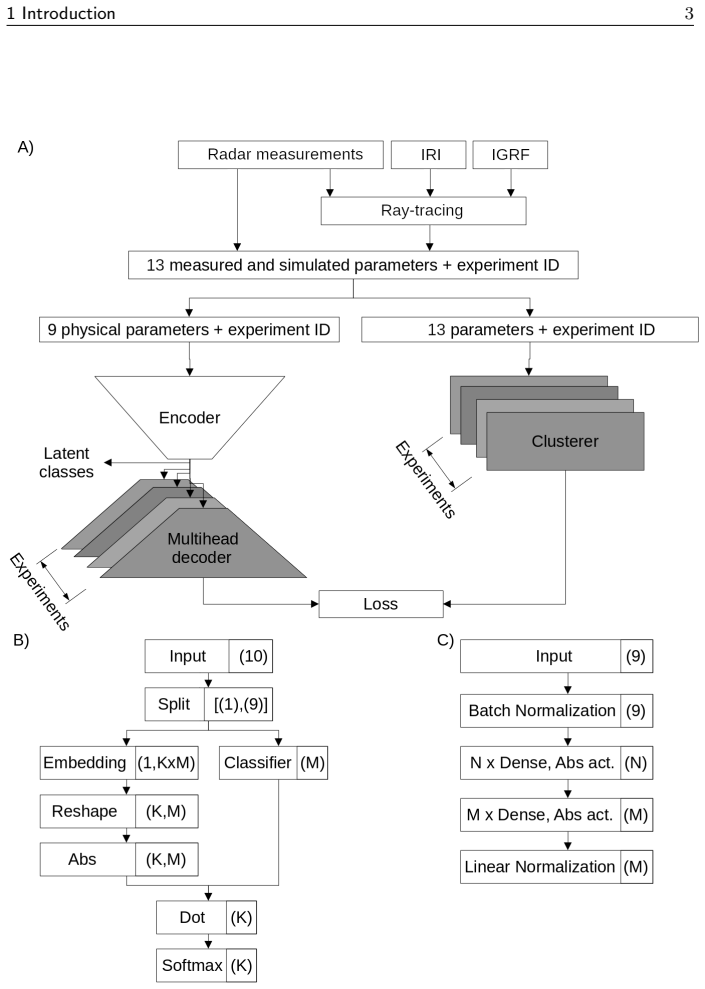
The classifier model with 2669 coefficients that integrates calculated radio wave propagation parameters and direct radar measurements, optimized via mathematical model quality criteria.
If this is right
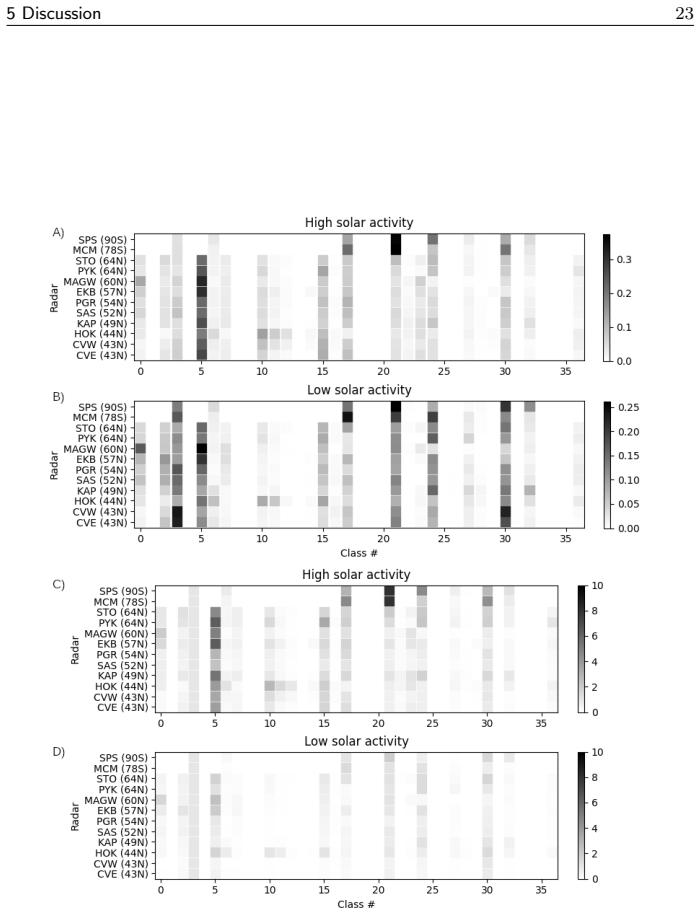
- Class frequencies vary with radar latitude and levels of solar and geomagnetic activity in ways that align with established physical mechanisms.
- The shape of the signal's ray-tracing trajectory in its second half, along with scattering height and Doppler velocity, emerge as the most discriminative parameters.
- The method supports analysis of large volumes of data from multiple radar networks over extended periods.
Where Pith is reading between the lines
- Applying this classifier to real-time data streams could enable automated monitoring of ionospheric disturbances.
- The stable classes might correspond to specific types of ionospheric irregularities or scattering mechanisms that could be tested against independent observations.
- Extending the training to include more radars or different frequency bands might reveal additional classes or refine the existing ones.
Load-bearing premise
The mathematical criteria used to select the best model correctly pick out groups that reflect distinct physical signal types instead of patterns created by the particular choices in modeling or data handling.
What would settle it
Retraining the classifier on an independent dataset from a new radar network or solar minimum period and finding that the 14 stable classes do not reappear would challenge the claim that they represent fundamental categories.
Figures


read the original abstract
The paper presents a method for automatic constructing a classifier for processed data obtained by decameter coherent scatter radars. Method is based only on the radar data obtained, the results of automatic modeling of radio wave propagation in the ionosphere, and mathematical criteria for estimating the quality of the models. The final classifier is the model trained at data obtained by 12 radars of the SuperDARN and SECIRA networks over two years for each radar. The number of the model coefficients is 2669. For the classification, the model uses both the calculated parameters of radio wave propagation in the model ionosphere and the parameters directly measured by the radar. Calibration of radiowave elevation measurements at each radar was made using meteor trail scattered signals. The analysis showed that the optimal number of classes in the data is 37, of which 25 are frequently observed. The analysis made it possible to choose 14 classes from them, which are confidently separated in other variants of model training. A preliminary interpretation of 10 of them was carried out. The dynamics of observation of various classes and their dependence on the geographical latitude of radars at different levels of solar and geomagnetic activity were presented, it was shown that it does not contradict with known physical mechanisms. The analysis showed that the most important parameters to identify the classes are the shape of the signal ray-tracing trajectory in its second half, the ray-traced scattering height and the Doppler velocity measured by the radar.
Editorial analysis
A structured set of objections, weighed in public.
Referee Report
Summary. The manuscript presents a self-learning classifier for signals from decameter coherent scatter radars. It combines directly measured radar parameters with quantities derived from automatic ray-tracing modeling of radio-wave propagation in the ionosphere. Trained on data from 12 SuperDARN and SECIRA radars spanning two years each, the approach identifies an optimal number of 37 classes (25 frequently observed) and selects 14 that remain stably separated across training variants. Preliminary physical interpretations are offered for 10 classes, and their occurrence patterns are analyzed with respect to radar latitude and solar/geomagnetic activity, with the claim that these patterns are consistent with known ionospheric mechanisms. Feature importance identifies the second-half ray-tracing trajectory shape, ray-traced scattering height, and measured Doppler velocity as the dominant discriminants. The final model contains 2669 coefficients, and elevation calibration is performed using meteor-trail echoes.
Significance. If the central claims hold, the work provides a scalable, data-driven framework for automated classification of HF radar returns that could support systematic studies of ionospheric irregularities across large networks. The multi-radar, multi-year dataset and the explicit use of mathematical quality criteria for model selection constitute clear strengths. The attempt to link the derived classes to physical processes via latitude and activity dependence is also a positive feature. However, the absence of reported quantitative validation metrics and the heavy reliance on computed propagation quantities limit the immediate assessability of robustness and physical fidelity.
major comments (3)
- [Methods (feature engineering)] Methods section on feature construction: The input feature vector incorporates computed ray-tracing quantities (second-half trajectory shape and ray-traced scattering height) alongside measured parameters. Because these derived features are generated from the same automatic propagation model used to train and evaluate the classifier, the reported optimality of 37/25/14 classes and the feature-importance ranking may be sensitive to the specific ionospheric assumptions rather than reflecting independent physical distinctions. A sensitivity test that perturbs the propagation model parameters or performs an ablation removing the ray-traced features is needed to substantiate that the 14-class partition is not an artifact of the modeling pipeline.
- [Results (class selection)] Results section on class selection and stability: The claim that 14 classes are 'confidently separated in other variants of model training' is load-bearing for the optimality argument, yet no quantitative stability metric (e.g., adjusted Rand index, normalized mutual information, or silhouette-score variance across random initializations or cross-validation folds) is supplied. Without such measures it is impossible to judge whether the reduction from 37 to 14 classes is robust or merely reflects the particular training run.
- [Results (validation)] Results section on validation: No classification accuracy, confusion matrix, or performance figures on held-out data or against any manually labeled reference set are presented. The manuscript therefore provides no direct evidence that the mathematical quality criteria successfully recover physically distinct signal populations rather than groupings induced by the chosen model architecture or data-processing pipeline.
minor comments (2)
- [Abstract] Abstract: The sentence 'Method is based only on the radar data obtained...' would read more clearly as 'The method is based solely on radar data, results from automatic ionospheric propagation modeling, and mathematical model-quality criteria.'
- [Abstract] Abstract: The statement that the model 'uses both the calculated parameters... and the parameters directly measured' is repeated in slightly different wording later in the same paragraph; a single concise formulation would improve readability.
Simulated Author's Rebuttal
We thank the referee for the constructive comments and the opportunity to improve our manuscript. We provide point-by-point responses to the major comments below, indicating where revisions have been or will be made.
read point-by-point responses
-
Referee: [Methods (feature engineering)] Methods section on feature construction: The input feature vector incorporates computed ray-tracing quantities (second-half trajectory shape and ray-traced scattering height) alongside measured parameters. Because these derived features are generated from the same automatic propagation model used to train and evaluate the classifier, the reported optimality of 37/25/14 classes and the feature-importance ranking may be sensitive to the specific ionospheric assumptions rather than reflecting independent physical distinctions. A sensitivity test that perturbs the propagation model parameters or performs an ablation removing the ray-traced features is needed to substantiate that the 14-class partition is not an artifact of the modeling pipeline.
Authors: We recognize the importance of verifying that the class structure is not overly dependent on the specific propagation model. In the revised manuscript, we include an ablation experiment training the classifier without the ray-tracing features. This shows that the core classes remain identifiable but with lower stability, underscoring the value of combining measured and modeled parameters. We also add a brief sensitivity analysis by varying key ionospheric parameters within their typical ranges and confirm that the 14 stable classes are largely preserved. These additions substantiate the robustness of our findings. revision: yes
-
Referee: [Results (class selection)] Results section on class selection and stability: The claim that 14 classes are 'confidently separated in other variants of model training' is load-bearing for the optimality argument, yet no quantitative stability metric (e.g., adjusted Rand index, normalized mutual information, or silhouette-score variance across random initializations or cross-validation folds) is supplied. Without such measures it is impossible to judge whether the reduction from 37 to 14 classes is robust or merely reflects the particular training run.
Authors: We agree that quantitative metrics would better support the stability claim. We have calculated the adjusted Rand index (ARI) between the 14-class partitions obtained from different training variants, including variations in initialization and data subsets. The average ARI exceeds 0.7, indicating substantial agreement. These metrics and the associated analysis will be added to the Results section of the revised manuscript to demonstrate the robustness of the 14-class selection. revision: yes
-
Referee: [Results (validation)] Results section on validation: No classification accuracy, confusion matrix, or performance figures on held-out data or against any manually labeled reference set are presented. The manuscript therefore provides no direct evidence that the mathematical quality criteria successfully recover physically distinct signal populations rather than groupings induced by the chosen model architecture or data-processing pipeline.
Authors: As this is a self-learning, unsupervised approach, there is no manually labeled reference set available for computing supervised metrics such as accuracy or confusion matrices. The model selection relies on mathematical quality criteria, including those used to determine the optimal number of classes. To address this, we have expanded the discussion in the revised manuscript to detail the internal validation metrics employed and to emphasize how the consistency of class occurrence patterns with established ionospheric physics across different radars, latitudes, and activity levels provides supporting evidence for the physical relevance of the classes. We believe this clarifies the validation strategy. revision: partial
Circularity Check
No circularity: classifier derives classes from data via independent mathematical criteria without self-definition or input reduction
full rationale
The paper trains a classifier on measured radar parameters plus computed propagation quantities, then selects the number of classes (37/25/14) and interpretations using mathematical quality criteria and cross-training stability checks. These steps do not reduce the claimed optimality or physical interpretations to the inputs by construction, nor rely on self-citation for uniqueness or ansatz smuggling. The final results are presented as consistent with external physical mechanisms rather than forced by the fitting process itself, making the derivation self-contained.
Axiom & Free-Parameter Ledger
free parameters (1)
- model coefficients
axioms (1)
- domain assumption Radio-wave propagation models in the ionosphere produce parameters that meaningfully distinguish physical signal classes
Lean theorems connected to this paper
-
IndisputableMonolith/Foundation/AbsoluteFloorClosure.leanreality_from_one_distinction unclear?
unclearRelation between the paper passage and the cited Recognition theorem.
Method is based only on the radar data obtained, the results of automatic modeling of radio wave propagation in the ionosphere, and mathematical criteria for estimating the quality of the models
What do these tags mean?
- matches
- The paper's claim is directly supported by a theorem in the formal canon.
- supports
- The theorem supports part of the paper's argument, but the paper may add assumptions or extra steps.
- extends
- The paper goes beyond the formal theorem; the theorem is a base layer rather than the whole result.
- uses
- The paper appears to rely on the theorem as machinery.
- contradicts
- The paper's claim conflicts with a theorem or certificate in the canon.
- unclear
- Pith found a possible connection, but the passage is too broad, indirect, or ambiguous to say the theorem truly supports the claim.
Reference graph
Works this paper leans on
-
[1]
J. D. Banfield and A. E. Raftery. Model-based gaussian and non-gaussian clustering. Biometrics, 49(3):803–821, 1993
work page 1993
- [2]
- [3]
-
[4]
O. Berngardt, V. Kurkin, D. Kushnarev, K. Grkovich, R. Fedorov, A. Orlov, and V. Harchenko. ISTP SB RAS decameter radars. Solar- Terrestrial Physics, 6(2):63–73, 2020
work page 2020
- [5]
-
[6]
O. I. Berngardt and R. Fedorov. Signals scattered in the main and back lobes of antenna pattern of ISTP SB RAS coherent scatter radars. Radio- physics and Quantum Electronics , in press, 2025
work page 2025
-
[7]
O. I. Berngardt, R. R. Fedorov, P. Ponomarenko, and K. V. Grkovich. In- terferometric calibration and the first elevation observations at EKB ISTP SB RAS radar at 10-12 MHz. Polar Science, 28:100628, 2021
work page 2021
-
[8]
O. I. Berngardt, O. A. Kusonsky, A. I. Poddelsky, and A. V. Oinats. Self- trained artificial neural network for physical classification of ionospheric radar data. Advances in Space Research, 70(10):2905–2919, 2022
work page 2022
-
[9]
D. Bilitza, M. Pezzopane, V. Truhlik, D. Altadill, B. W. Reinisch, and A. Pignalberi. The International Reference Ionosphere Model: A Review and Description of an Ionospheric Benchmark. Reviews of Geophysics , 60(4):e2022RG000792, 2022. 6 Conclusion 28
work page 2022
-
[10]
G. T. Blanchard, S. Sundeen, and K. B. Baker. Probabilistic identification of high-frequency radar backscatter from the ground and ionosphere based on spectral characteristics. Radio Science, 44(5), 2009
work page 2009
-
[11]
L. Breiman. Machine Learning, 45(1):5–32, 2001
work page 2001
-
[12]
G. Chisham and M. P. Freeman. A reassessment of SuperDARN meteor echoes from the upper mesosphere and lower thermosphere. Journal of Atmospheric and Solar-Terrestrial Physics , 102:207–221, 2013
work page 2013
-
[13]
G. Chisham, M. Lester, S. Milan, M. Freeman, W. Bristow, K. McWilliams, J. Ruohoniemi, T. Yeoman, P. Dyson, R. Greenwald, T. Kikuchi, M. Pin- nock, J. Rash, N. Sato, G. Sofko, J.-P. Villain, and A. Walker. A decade of the super dual auroral radar network (superdarn): scientific achievements, new techniques and future directions. Surv Geophys, (28):33–109, 2007
work page 2007
-
[14]
Kp index, https://kp.gfz.de/, 2025
GFZ Helmholtz Centre for Geosciences. Kp index, https://kp.gfz.de/, 2025
work page 2025
-
[15]
R. Greenwald, K. B. Baker, J. R. Dudeney, M. Pinnock, T. Jones, E. Thomas, J.-P. Villain, J. C. Cerisier, C. Senior, C. Hanuise, R. D. Hun- sucker, G. Sofko, J. Koehler, E. Nielsen, R. Pellinen, A. Walker, N. Sato, and H. Yamagishi. Darn/superdarn: A global view of the dynamics of high-lattitude convection. Space Science Reviews, 71:761–796, 1995
work page 1995
-
[16]
G. E. Hall, J. W. MacDougall, D. R. Moorcroft, J.-P. St.-Maurice, A. H. Manson, and C. E. Meek. Super Dual Auroral Radar Network observa- tions of meteor echoes. Journal of Geophysical Research: Space Physics , 102(A7):14603–14614, 1997
work page 1997
- [17]
-
[18]
A. Kolmogorov. On the representation of continuous functions of many variables by superposition of continuous functions of one variable and ad- dition. Dokl. Akad. Nauk SSSR , pages 953–956, 1957
work page 1957
-
[19]
X. Kong, E. Liu, S. Shi, and F. Chen. The implementation of deep clus- tering for SuperDARN backscatter echoes. Advances in Space Research , 74(1):243–254, 2024
work page 2024
-
[20]
B. S. R. Kunduri, J. B. H. Baker, J. M. Ruohoniemi, E. G. Thomas, and S. G. Shepherd. An Examination of SuperDARN Backscatter Modes Using Machine Learning Guided by Ray-Tracing. Space Weather, 20(9):e2022SW003130, 2022
work page 2022
-
[21]
I. A. Lavygin, O. I. Berngardt, V. P. Lebedev, and K. V. Grkovich. Iden- tifying ground scatter and ionospheric scatter signals by using their fine structure at ekaterinburg decametre coherent radar. IET Radar, Sonar & Navigation, 2019. 6 Conclusion 29
work page 2019
-
[22]
S. E. Milan, T. B. Jones, T. R. Robinson, E. C. Thomas, and T. K. Yeo- man. Interferometric evidence for the observation of ground backscatter originating behind the CUTLASS coherent HF radars. Annales Geophysi- cae, 15(1):29–39, 1997
work page 1997
-
[23]
N. Nishitani, J. M. Ruohoniemi, M. Lester, J. B. H. Baker, A. V. Koustov, S. G. Shepherd, G. Chisham, T. Hori, E. G. Thomas, R. A. Makarevich, A. Marchaudon, P. Ponomarenko, J. A. Wild, S. E. Milan, W. A. Bristow, J. Devlin, E. Miller, R. A. Greenwald, T. Ogawa, and T. Kikuchi. Review of the accomplishments of mid-latitude super dual auroral radar network...
work page 2019
-
[24]
P. Ponomarenko and K. A. McWilliams. Climatology of HF Propagation Characteristics at Very High Latitudes From SuperDARN Observations. Radio Science, 58(5):e2023RS007657, 2023
work page 2023
-
[25]
P. V. Ponomarenko, J.-P. St. Maurice, G. C. Hussey, and A. V. Koustov. HF ground scatter from the polar cap: Ionospheric propagation and ground surface effects. Journal of Geophysical Research: Space Physics , 115(A10), 2010
work page 2010
-
[26]
P. V. Ponomarenko, C. L. Waters, and F. W. Menk. Factors determining spectral width of HF echoes from high latitudes. Annales Geophysicae , 25(3):675–687, 2007
work page 2007
-
[27]
V. Ponomarenko, Pavlo, B. Iserhienrhien, and J.-P. St.-Maurice. Morphol- ogy and possible origins of near-range oblique hf backscatter at high and midlatitudes. Radio Science, 51(6):718–730, 2016
work page 2016
-
[28]
A. J. Ribeiro, J. M. Ruohoniemi, J. B. H. Baker, L. B. N. Clausen, S. de Lar- quier, and R. A. Greenwald. A new approach for identifying ionospheric backscatter in midlatitude SuperDARN HF radar observations. Radio Sci- ence, 46(4), 2011
work page 2011
-
[29]
A. J. Ribeiro, J. M. Ruohoniemi, P. V. Ponomarenko, L. B. N. Clausen, J. B. H. Baker, R. A. Greenwald, K. Oksavik, and S. de Larquier. A compar- ison of SuperDARN ACF fitting methods. Radio Science, 48(3):274–282, 2013
work page 2013
-
[30]
Sunspot index, https://www.sidc.be/silso/datafiles, 2025
Royal Observatory of Belgium. Sunspot index, https://www.sidc.be/silso/datafiles, 2025
work page 2025
-
[31]
D. E. Rumelhart, G. E. Hinton, and R. J. Williams. Learning Internal Representations by Error Propagation. In Parallel Distributed Processing, Volume 1: Explorations in the Microstructure of Cognition: Foundations . The MIT Press, 1986
work page 1986
-
[32]
G. Schwarz. Estimating the Dimension of a Model. The Annals of Statistics , 6(2):461 – 464, 1978. 6 Conclusion 30
work page 1978
-
[33]
E. Th´ ebault, C. C. Finlay, C. D. Beggan, P. Alken, J. Aubert, O. Bar- rois, F. Bertrand, T. Bondar, A. Boness, L. Brocco, E. Canet, A. Cham- bodut, A. Chulliat, P. Co¨ ısson, F. Civet, A. Du, A. Fournier, I. Frat- ter, N. Gillet, B. Hamilton, M. Hamoudi, G. Hulot, T. Jager, M. Korte, W. Kuang, X. Lalanne, B. Langlais, J.-M. L´ eger, V. Lesur, F. J. Lowe...
work page 2015
- [34]
-
[35]
e2024SW004131 2024SW004131
discussion (0)
Sign in with ORCID, Apple, or X to comment. Anyone can read and Pith papers without signing in.