REVIEW 4 major objections 6 minor 57 references
Resolving Discrepancies in Wood Micromechanics: Strain-Mapped Compression of Tracheid Wall Micropillars
T0 review · 4 major / 6 minor · reviewed 2026-08-07 · deepseek-v4-flash
Pith's one-line read Wood cell-wall stiffness reaches 42 GPa when strain is mapped directly on micropillars, pointing to electron-beam damage as the cause of earlier scatter.
desk verdict Careful, useful experimental study that makes a plausible case that beam damage explains past scatter in wood micropillar compression; the 42 GPa DIC number is a survivor average, but FEM-corrected values independently support the main conclusion. read the letter →
The pith
A machine-rendered reading of the paper's core claim, the machinery that carries it, and where it could break.
The reading
What carries the argument
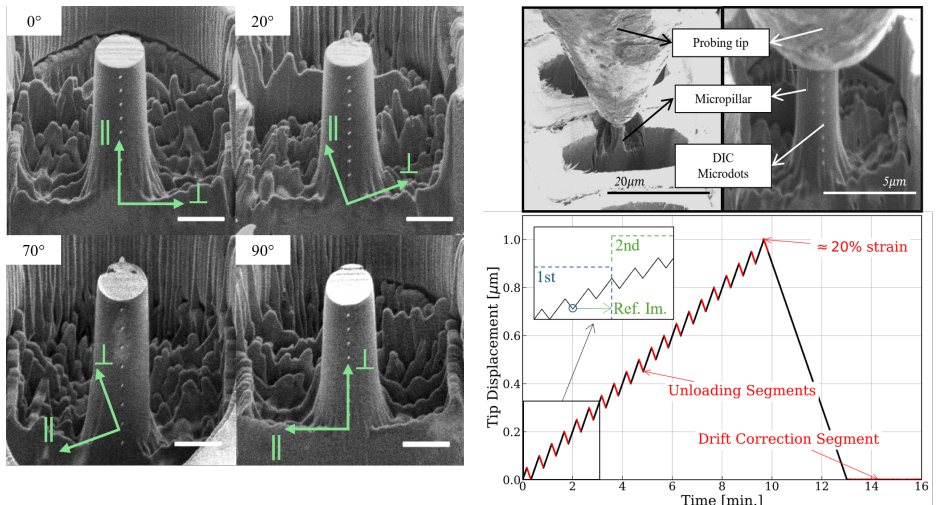
The load-bearing mechanism is the measurement chain: FIB-milled micropillars from the S2 layer, a row of platinum microdots deposited on each pillar surface, and digital image correlation (DIC) that tracks the dots in consecutive SEM images to build incremental strain fields. This bypasses the usual need to convert indentor displacement into pillar strain, which requires a sink-in correction. The authors compare the DIC strain against displacement-based strains corrected by the modified Sneddon formula and by FEM models of increasing realism, an orthotropic half-space and a full tracheid assembly, to judge which global correction is trustworthy. A parameter study of SEM acceleration voltage, with no continuous scanning, 2 kV, and 5 kV, identifies electron-beam damage as the factor that moves measured stiffness and strength across the range seen in earlier publications.
What would settle it
Run the same MFA=0° compression with DIC strains computed over the entire pillar height including kink bands as well as over the adaptive ROI that excludes them; if the full-field modulus falls substantially below 42 GPa, the headline value is an intact-material survivor average rather than a whole-pillar modulus. A second check is to test pillars with no continuous SEM scanning and derive the modulus from indentor displacement with the orthotropic tracheid sink-in correction; agreement with 42 GPa would confirm that the DIC value is not an artifact of excluding damaged zones.
Extended reading notes
Core claim
The paper's central claim is that DIC-based strain mapping, not indentor displacement, is the right yardstick for wood micropillar compression. With this method and controlled imaging at 2 kV, the S2 layer of Norway spruce shows a Young's modulus of $E = (42 \pm 3)$ GPa at a microfibril angle of 0°, compared with model predictions of 55 and 69 GPa; at 90° the measured $E = (7 \pm 1)$ GPa matches the model value of 8 GPa. The authors attribute the historical scatter in wood micropillar data to electron-beam damage: pillars continuously scanned at 5 kV lost at least 50% of their strength, and their measured modulus fell to values similar to older literature. They further show that standard isotropic sink-in corrections underestimate penetration into the anisotropic cell-wall substrate, while orthotropic FEM corrections with realistic tracheid geometry bring indentor-displacement strains close to the DIC values. The paper concludes that previous micropillar results spanned the full range from minimally degraded to severely degraded material, and that uncontrolled beam exposure is the primary source of the reported variability.
Load-bearing premise
The DIC strain average excludes zones with localized damage through an adaptive region of interest, so the headline 42 GPa modulus describes only the intact material that survived long enough to be tracked, not the whole pillar including its damaged regions.
Editorial extensions
If this is right
- Reported S2 stiffness at a microfibril angle of 0° rises to $(42 \pm 3)$ GPa under 2 kV imaging, the closest experimental match so far to micromechanical model predictions of 55–69 GPa.
- As the microfibril angle increases, stiffness and yield stress fall, with the 90° value of $(7 \pm 1)$ GPa matching the model prediction of 8 GPa.
- Pillars continuously scanned at 5 kV show at least 50% strength reduction, so uncontrolled beam exposure, not sample variation, can explain much of the scatter in earlier wood micropillar studies.
- Sink-in corrections built on isotropic half-space assumptions underestimate penetration in anisotropic cell-wall material, while orthotropic tracheid-level FEM corrections reproduce DIC-based strains more closely.
- Failure mode switches from fibril-aligned kink bands at low microfibril angles to compressive collapse of fibrillar layers at high angles, consistent with ultrastructural alignment.
- The protocol combining low-current FIB milling, microdot deposition, DIC strain mapping, and controlled imaging offers a template for probing soft, anisotropic biological composites at the cell-wall scale.
Reading between the lines
- Beyond the paper: because the adaptive ROI excludes localized damage zones, the 42 GPa value is best read as the stiffness of the intact S2 material, while the whole-pillar engineering stiffness under large deformation could be lower.
- Beyond the paper: if electron-beam damage is the dominant source of scatter, then protocol standardization, especially limiting continuous SEM scanning and using low acceleration voltages, should make future wood micropillar results reproducible across laboratories.
- Beyond the paper: the same DIC-on-microdots approach could be extended to other soft anisotropic biological tissues and to moisture- or temperature-controlled in situ testing, provided the imaging dose per test can be kept low enough to preserve the material.
Signed reviews
Editorial analysis
A structured set of objections, weighed in public.
Referee Report
Summary. The manuscript presents micropillar compression (MPC) tests on Norway spruce S2 cell walls with digital image correlation (DIC) strain measurement using platinum microdots, across four microfibril angles (0°, 20°, 70°, 90°) and three SEM imaging protocols (no beam, 2 kV, 5 kV). The central claim is that DIC-based strain mapping yields E = (42±3) GPa for MFA = 0° at 2 kV, which the authors describe as the highest direct stiffness measurement for wood cell walls to date and as the closest experimental match to micromechanical model predictions. A second central claim is that uncontrolled electron-beam exposure in earlier MPC studies is the primary source of their scatter and mechanical underestimation. The paper also compares DIC strains with indentor-displacement strains corrected by the modified Sneddon approach and by orthotropic FEM sink-in models, and reports consistent MFA-dependent trends in modulus, yield stress, and failure modes.
Significance. If the headline result holds, the paper is significant: it would provide a direct, image-based measurement of S2 stiffness far closer to micromechanical model predictions than previous MPC or nanoindentation data, and it identifies electron-beam dose as a controllable source of variability in a protocol that otherwise suffers from large scatter. Strengths include the detailed experimental protocol, the systematic comparison of three imaging conditions, the independence of the DIC strain measurement from the FEM sink-in corrections, and the internally consistent orientation dependence of stiffness, yield stress, and failure mode. The FEM sink-in corrections come from prior published modeling rather than being fitted to the DIC data, so the central comparison is not circular. The main risk is that the DIC strains are averaged over an adaptive region of interest that excludes localized damage, which could bias the headline 42 GPa modulus upward; the paper itself states this exclusion in Sec. 3.2. The absence of DIC data for the no-beam control further weakens the cleanest beam-damage comparison.
major comments (4)
- [Sec. 3.2] Sec. 3.2 states that 'due to the adaptive ROI, zones with localized damage are excluded from the DIC strain calculation.' This creates a mismatch between the stress and strain definitions: the engineering stress is computed from the total measured force over the full pillar cross-section, while the DIC strain is averaged only over intact regions. In fibril-aligned compression, kink bands (Fig. 8) accommodate a disproportionate share of the imposed displacement, so excluding them makes the strain denominator smaller than the whole-pillar average and biases the modulus upward. This is the direction of the gap between E_DIC = 42 GPa and E_FEM = 37 GPa for the same 2 kV pillars in Table 2. Please re-analyze the image sequences with a full-pillar ROI that includes the damaged zones and report both values, or, if the intended quantity is explicitly an intact-material modulus, state that interpretation and restrict the comparison with the 55–69 GPa model predictions accordingly.
- [Table 2 / Sec. 2.2] The no-beam control rows in Table 2 have no E_DIC values, so the cleanest comparison for the beam-damage claim is not available: the no-beam value of 38 GPa is obtained only through the FEM sink-in correction, not through direct strain measurement. In addition, the imaging-protocol comparison is inter-pillar rather than same-pillar: different pillars are assigned to the no-beam, 2 kV, and 5 kV arms, so pre-existing pillar-to-pillar variation is not controlled. The conclusion that beam exposure is the primary source of scatter would be stronger if the authors either provide same-pillar evidence, report the individual pillar-level values and exact n for every cell in Table 2, or otherwise explicitly acknowledge that the comparison is between different pillars.
- [Sec. 3.2 / Conclusions] The 'closest match' language should be calibrated against the actual numbers: E_DIC = 42 GPa is still 24% below the lower cited model prediction of 55 GPa and 39% below the upper prediction of 69 GPa [12,30], while the 90° value of 7±1 GPa matches the 8 GPa model prediction. The claim that the result is closer than previous experiments is supported by the cited literature values, but the adaptive-ROI bias discussed above could act to inflate the measured modulus, which would worsen the agreement with the models if corrected. Please state the residual gap explicitly and avoid presenting 'closest experimental estimate' as equivalent to model validation.
- [Conclusions] The abstract and conclusion identify uncontrolled electron-beam exposure as the primary source of scatter and underestimation in earlier MPC studies, but this is an inference from comparing the present three imaging protocols with literature values. The manuscript does not quantify the beam dose, scan rate, or imaging history of the cited studies, so 'primary source' is stronger than the evidence supports. Please either soften this to 'a major contributor' or provide a quantitative comparison of imaging conditions in the cited works.
minor comments (6)
- [Table 2] The header contains the typo 'Nanoidentation'; it should read 'Nanoindentation'.
- [Sec. 2.1] The text says the most probable MFA was 10° and then refers to pillars with MFA 0°, 20°, 70°, and 90°; clarify whether these are local S2 fibril angles relative to the pillar axis or nominal cutting angles, and how the 10° value maps to the '0°' label.
- [Sec. 2.3 / Eq. (1)] The modified Sneddon correction in Eq. (1) uses Poisson's ratio ν, but the value of ν used in the analysis is not stated; please specify it.
- [Sec. 2.3] The abstract calls the DIC strain measurement 'model-free', but the stress calculation assumes a circular cross-section and does not explicitly correct for barrelling; consider wording such as 'strain measured directly from image correlation' to avoid overstatement.
- [Sec. 2.3] The moving regression window of approximately 0.5% used for yield-stress extraction is introduced without a sensitivity study; please report how σyield changes with the window size.
- [Fig. 10 / Table 2] The figure caption says each curve averages 'at least 4' micropillars; please give the exact number of pillars for each MFA and protocol cell, and indicate which values are standard deviations of the mean.
Circularity Check
No significant circularity: the DIC-based stiffness measurement is derived from image correlation and load data, not from the micromechanical model predictions it is compared against.
full rationale
The central result, E = (42 ± 3) GPa for MFA = 0°, is obtained from DIC strain fields measured by tracking deposited microdots (Sec. 2.3) and from load-cell force divided by the measured cross-section; it does not use any micromechanical model prediction as an input. The comparison with model predictions (E = 55 and 69 GPa from Refs. [12, 30, 56]) is a comparison against previously published, parameter-carrying models, not a fit of the present data to those models. The FEM sink-in corrections use orthotropic compliance tensors from Ref. [30], but these corrections are applied only to the supplementary EFEM values, not to the headline EDIC values; the DIC measurement remains independent of that shared input. Some of the cited model papers share authors (Refs. [30], [56], and [38]), but this self-citation is not load-bearing because the cited predictions are prior published results with stated assumptions and are externally checkable; they are not derived from, nor fitted to, the 42 GPa measurement. The paper explicitly notes a limitation that could affect accuracy rather than circularity: 'due to the adaptive ROI, zones with localized damage are excluded from the DIC strain calculation' (Sec. 3.2). Excluding kink-band damage zones from the strain denominator could bias the modulus upward, and the lack of a DIC value for the No-Beam protocol weakens the cleanest control, but this is a measurement-validity concern, not a circular derivation. No equation or parameter in the paper reduces the claimed prediction to its own input, and no uniqueness argument is imported from the authors' prior work. Therefore the derivation chain is self-contained against external benchmarks, and no circular step is present.
Assumptions & free parameters
free parameters (3)
- Sneddon modification factor eta =
1.42
- Orthotropic sink-in correction factors xi_ortho(MFA) =
0.494, 0.595, 0.734, 0.716 (substrate); 0.450, 0.558, 0.687, 0.662 (tracheid)
- Moving regression window for yield stress extraction =
approximately 0.5% strain
assumptions (5)
- domain assumption Orthotropic elasticity tensors at 0% RH from Ref. [30] represent the S2 cell wall under vacuum.
- domain assumption Top surface of the pillar is frictionally coupled to the indenter without sliding.
- domain assumption Surface DIC strain equals the volume-average strain of the pillar.
- ad hoc to paper Platinum microdots do not mechanically alter the S2 cell wall.
- domain assumption Historical MPC studies used beam exposures comparable to the 5 kV continuous scanning condition.
Cite this review
Pith. "Pith review of Resolving Discrepancies in Wood Micromechanics: Strain-Mapped Compression of Tracheid Wall Micropillars." pith.science (2026). https://pith.science/paper/FQM6EMAQ
@misc{pith2026250611177,
  author       = {Pith},
  title        = {Pith review of: Resolving Discrepancies in Wood Micromechanics: Strain-Mapped Compression of Tracheid Wall Micropillars},
  year         = {2026},
  howpublished = {\url{https://pith.science/paper/FQM6EMAQ}},
  note         = {Machine review of arXiv:2506.11177}
}
read the original abstract
Wood's increasing role as a structural resource in sustainable materials selection demands accurate characterization of its mechanical behavior. Its performance arises from a hierarchical structure, where the dominant load-bearing component is the S2 layer of tracheid cell walls-a thick, fiber-reinforced composite of cellulose microfibrils embedded in hemicelluloses and lignin. Due to the small dimensions and anisotropic nature of the S2 layer, mechanical testing presents significant challenges, particularly in producing homogeneous stress and strain fields. In this study, we apply micropillar compression (MPC) combined with digital image correlation (DIC) to Norway spruce tracheids, enabling direct and model-free strain measurements at the cell wall scale. Micropillars were oriented at different microfibril angles (MFAs), confirming the expected dependence of stiffness and yield stress on ultrastructural alignment, with higher stiffness and yield stress at low MFAs. For these under compression fibril-aligned kink bands occurred, while shear related failure was observed at higher angles. A parameter study on the acceleration voltage of the Scanning Electron Microscope revealed that electron beam exposure significantly degrades pillar integrity, which could explain data scatter and mechanical underestimation in earlier MPC studies. By controlling imaging protocols and using DIC-based strain measurements, we report the highest direct measurements of wood cell wall stiffness to date-up to 42 GPa for MFA=0{\deg}-closer matching micromechanical model predictions compared to previous results. Findings are compared with Finite Element Method-based displacement corrections to establish a robust protocol for probing soft, anisotropic biological composites' mechanical behavior while clarifying longstanding inconsistencies in reported results of wood MPC measurements.
Figures


Figures from the paper (10 more)


Reference graph
Works this paper leans on
-
[1]
F. Jiang, T. Li, Y. Li, Y. Zhang, A. Gong, J. Dai, E. Hitz, W. Luo, L. Hu, Wood- based nanotechnologies toward sustainabil- ity, Adv. Mater. 30 (1) (2018) 1703453. doi:https://doi.org/10.1002/adma.201703453
-
[2]
T. Farid, M. I. Rafiq, A. Ali, W. Tang, Transforming wood as next-generation struc- tural and functional materials for a sustain- able future, EcoMat 4 (1) (2022) e12154. doi:https://doi.org/10.1002/eom2.12154
-
[3]
L. J. Gibson, The hierarchical structure and mechanics of plant materials, J. R. Soc. Interface 9 (76) (2012) 2749–2766. doi:https://doi.org/10.1098/rsif.2012.0341
arXiv 2012
-
[4]
J. O. Amando de Barros, F. K. Wit- tel, Unifying model for the rheological behavior of hygroresponsive materials, Phys. Rev. E 109 (4) (2024) 044139. doi:https://doi.org/10.1103/PhysRevE.109.044139
-
[5]
F. Bertaud, B. Holmbom, Chemical compo- sition of earlywood and latewood in norway spruce heartwood, sapwood and transition zone wood, Wood Sci. Technol. 38 (2004) 245–256. doi:https://doi.org/10.1007/s00226-004-0241-9
-
[6]
A. Ferrara, F. K. Wittel, Tensile creep of nor- way spruce on the tissue scale, MTDM 29 (2) (2025) 36. doi:https://doi.org/10.1007/s11043- 025-09772-1
-
[7]
J. R. Barnett, V. A. Bonham, Cellulose microfibril angle in the cell wall of wood fibres, Biol. Rev. 79 (2) (2004) 461–472. doi:https://doi.org/10.1017/S1464793103006377
-
[8]
J. Boyd, An anatomical explanation for visco- elastic and mechano-sorptive creep in wood, and effects of loading rate on strength, in: New Per- spectives in Wood Anatomy: Published on the occasion of the 50th Anniversary of the Interna- tional Association of Wood Anatomists, Springer, 1982, pp. 171–222
work page 1982
Show all 57 references
-
[9]
Sj¨ ostr¨ om, U
E. Sj¨ ostr¨ om, U. Westermark, Chemical compo- sition of wood and pulps: basic constituents and their distribution, in: Analytical methods in wood chemistry, pulping, and papermaking, Springer, 1999, pp. 1–19
1999
-
[10]
Bergander, L
A. Bergander, L. Salm´ en, Cell wall properties and their effects on the mechanical properties of fibers, J. Mater. Sci. 37 (1) (2002) 151–156. doi:https://doi.org/10.1023/A:1013115925679
2002 doi
-
[11]
Fengel, G
D. Fengel, G. Wegener, Wood: chemistry, ultra- structure, reactions, Walter de Gruyter, 2011
2011
-
[12]
Salm´ en, Micromechanical under- standing of the cell-wall structure, C
L. Salm´ en, Micromechanical under- standing of the cell-wall structure, C. R. Biol. 327 (9-10) (2004) 873–880. doi:https://doi.org/10.1016/j.crvi.2004.03.010
2004 doi
-
[13]
Salm´ en, I
L. Salm´ en, I. Burgert, Cell wall features with regard to mechanical performance. a review cost action e35 2004–2008: Wood machining–micromechanics and fracture, Holzforschung 63 (2) (2009) 121–129. doi:doi.org/10.1515/HF.2009.011
2009 doi
-
[14]
E. T. Engelund, L. G. Thygesen, S. Svens- son, C. A. Hill, A critical discussion of 16 the physics of wood–water interactions, Wood Sci. Technol. 47 (2013) 141–161. doi:https://doi.org/10.1007/s00226-012-0514-7
2013 doi
-
[15]
J. S. Stevanic, L. Salm´ en, Molecular origin of mechano-sorptive creep in cellulosic fi- bres, Carbohyd. Polym. 230 (2020) 115615. doi:https://doi.org/10.1016/j.carbpol.2019.115615
2020
-
[16]
Fahl´ en, L
J. Fahl´ en, L. Salm´ en, On the lamellar struc- ture of the tracheid cell wall, Plant Biol. 4 (03) (2002) 339–345. doi:https://doi.org/10.1055/s- 2002-32341
2002 doi
-
[18]
Boerjan, J
W. Boerjan, J. Ralph, M. Baucher, Lignin biosynthesis, Annu. Rev. Plant Biol. 54 (1) (2003) 519–546. doi:https:doi.org/10.1146/annurev.arplant.54.031902.134938
2003
-
[19]
H. V. Scheller, P. Ulvskov, Hemicelluloses, Annu. Rev. Plant Biol. 61 (1) (2010) 263–289. doi:https://doi.org/10.1146/annurev-arplant- 042809-112315
2010 doi
-
[20]
Jakob, M
S. Jakob, M. J. Pfeifenberger, A. Hohenwarter, R. Pippan, Femtosecond laser machining for characterization of local mechanical properties of biomaterials: a case study on wood, STAM 18 (1) (2017) 574–583. doi:https://doi.org/10.1080/14686996.2017.1360751
2017
-
[21]
Fahl´ en, The cell wall ultrastructure of wood fibres: effects of the chemical pulp fibre line, Ph.D
J. Fahl´ en, The cell wall ultrastructure of wood fibres: effects of the chemical pulp fibre line, Ph.D. thesis, KTH (2005)
2005
-
[22]
Wimmer, B
R. Wimmer, B. Lucas, W. Oliver, T. Tsui, Longi- tudinal hardness and young’s modulus of spruce tracheid secondary walls using nanoindentation technique, Wood Sci. Technol. 31 (2) (1997) 131–
1997
-
[23]
Konnerth, N
J. Konnerth, N. Gierlinger, J. Keckes, W. Gindl, Actual versus apparent within cell wall vari- ability of nanoindentation results from wood cell walls related to cellulose microfibril an- gle, J. Mater. Sci. 44 (2009) 4399–4406. doi:https://doi.org/10.1007/s10853-009-3665-7
2009 doi
-
[24]
J¨ ager, T
A. J¨ ager, T. Bader, K. Hofstetter, J. Eber- hardsteiner, The relation between indenta- tion modulus, microfibril angle, and elastic properties of wood cell walls, Compos. A: App. Sci. Manuf. 42 (6) (2011) 677–685. doi:https://doi.org/10.1016/j.compositesa.2011.02.007
2011 doi
-
[25]
Bertinetti, U
L. Bertinetti, U. D. Hangen, M. Eder, P. Leib- ner, P. Fratzl, I. Zlotnikov, Characterizing moisture-dependent mechanical properties of organic materials: humidity-controlled static and dynamic nanoindentation of wood cell walls, Phil. Mag. 95 (16-18) (2015) 1992–1998. doi:htt...
2015
-
[27]
Zimmermann, V
T. Zimmermann, V. Thommen, P. Reimann, H. Hug, Ultrastructural appearance of embedded and polished wood cell walls as revealed by atomic force microscopy, J. Struct. Biol. 156 (2) (2006) 363–369. doi:https://doi.org/10.1016/j.jsb.2006.06.007
2006 doi
-
[28]
Casdorff, T
K. Casdorff, T. Keplinger, I. Burgert, Nano- mechanical characterization of the wood cell wall by afm studies: comparison between ac- and qi ™ mode, Plant Methods 13 (2017) 1–9. doi:https://doi.org/10.1186/s13007-017-0211-5
2017 doi
-
[29]
Gindl, T
W. Gindl, T. Sch¨ oberl, The significance of the elastic modulus of wood cell walls obtained from nanoindentation measurements, Compos. A: App. Sci. Manuf. 35 (11) (2004) 1345–1349. doi:https://doi.org/10.1016/j.compositesa.2004.04.002
2004 doi
-
[30]
D. F. Mora Mendez, S. O. Olaniran, M. R¨ uggeberg, I. Burgert, H. J. Herrmann, F. K. Wittel, Mechanical behavior of chem- ically modified norway spruce: a generic 17 hierarchical model for wood modifications, Wood Sci. Technol. 53 (2) (2019) 447–467. doi:https://doi.org/10.100...
2019 doi
-
[31]
Reyntjens, R
S. Reyntjens, R. Puers, A review of focused ion beam applications in mi- crosystemtechnology, JMM 11 (4) (2001)
2001
-
[32]
K. J. Hemker, W. N. Sharpe Jr, Microscale characterization of mechanical properties, Annu. Rev. Mater. Res. 37 (1) (2007) 93–126. doi:https://doi.org/10.1146/annurev.matsci.36.062705.134551
2007
-
[33]
Jayaram, Small-scale mechanical testing, Annu
V. Jayaram, Small-scale mechanical testing, Annu. Rev. Mater. Res. 52 (1) (2022) 473–
2022
-
[34]
Zhang, B
H. Zhang, B. E. Schuster, Q. Wei, K. T. Ramesh, The design of accurate micro-compression experiments, Scr. Mater. 54 (2) (2006) 181–186. doi:https://doi.org/10.1016/j.scriptamat.2005.06.043
2006 doi
-
[35]
A. A. Konstantinidis, K. Michos, E. C. Aifantis, On the correct interpretation of compression ex- periments of micropillars produced by a focused ion beam, J. Mech. Behav. Mater. 25 (3-4) (2016) 83–87. doi:https://doi.org/10.1515/JMBM-2016- 0009
2016 doi
-
[36]
Cornec, E
A. Cornec, E. Lilleodden, Numerical analysis of micropillar compression behaviour and stress- strain curve estimation verified on glass fused silica, Mater. Today Commun. 33 (2022) 104971. doi:https://doi.org/10.1016/j.mtcomm.2022.104971
2022
-
[37]
Zhang, Q
X. Zhang, Q. Zhao, S. Wang, R. Trejo, E. Lara-Curzio, G. Du, Characterizing strength and fracture of wood cell wall through uniaxial micro-compression test, Compos. A: App. Sci. Manuf. 41 (5) (2010) 632–638. doi:https://doi.org/10.1016/j.compositesa.2010.01.010
2010 doi
-
[38]
Schwiedrzik, R
J. Schwiedrzik, R. Raghavan, M. R¨ uggeberg, S. Hansen, J. Wehrs, R. B. Adusumalli, T. Zimmermann, J. Michler, Identifica- tion of polymer matrix yield stress in the wood cell wall based on micropillar com- pression and micromechanical modelling, Phil. Mag. 96 (32-34) (2016) 3...
2016
-
[39]
Kl ´ ımek, V
P. Kl ´ ımek, V. Sebera, D. Tytko, M. Brabec, J. Lukeˇ s, Micromechanical properties of beech cell wall measured by micropillar compression test and nanoindentation map- ping, Holzforschung 74 (9) (2020) 899–904. doi:https://doi.org/10.1515/hf-2019-0128
2020 doi
-
[40]
Adusumalli, R
R.-B. Adusumalli, R. Raghavan, R. Ghisleni, T. Zimmermann, J. Michler, Deformation and failure mechanism of secondary cell wall in spruce late wood, Appl. Phys. A 100 (2) (2010) 447–452. doi:https://doi.org/10.1007/s00339-010-5847-1
2010 doi
-
[41]
Raghavan, R.-B
R. Raghavan, R.-B. Adusumalli, G. Buerki, S. Hansen, T. Zimmermann, J. Michler, Defor- mation of the compound middle lamella in spruce latewood by micro-pillar compression of double cell walls, J. Mater. Sci. 47 (2012) 6125–6130. doi:https://doi.org/10.1007/s10853-012-6531-y
2012 doi
-
[42]
R¨ uggeberg, F
M. R¨ uggeberg, F. Saxe, T. H. Metzger, B. Sund- berg, P. Fratzl, I. Burgert, Enhanced cellulose orientation analysis in complex model plant tis- sues, J. Struct. Biol. 183 (3) (2013) 419–428. doi:https://doi.org/10.1016/j.jsb.2013.07.001
2013 doi
-
[43]
Br¨ andstr¨ om, Micro-and ultrastructural aspects of norway spruce tracheids: a re- view, IA W A J
J. Br¨ andstr¨ om, Micro-and ultrastructural aspects of norway spruce tracheids: a re- view, IA W A J. 22 (4) (2001) 333–353. doi:https://doi.org/10.1163/22941932- 90000381
2001 doi
-
[44]
G. Farneb¨ ack, Two-frame motion estimation based on polynomial expansion, in: Image Anal- ysis: 13th Scandinavian Conference, SCIA 2003 Halmstad, Sweden, June 29–July 2, 2003 Pro- ceedings 13, Springer, 2003, pp. 363–370
2003
-
[45]
Bradski, The opencv library, Dr
G. Bradski, The opencv library, Dr. Dobb’s J. 25 (11) (2000) 120–123. 18
2000
-
[46]
Otsu, et al., A threshold selection method from gray-level histograms, Au- tomatica 11 (285-296) (1975) 23–27
N. Otsu, et al., A threshold selection method from gray-level histograms, Au- tomatica 11 (285-296) (1975) 23–27. doi:https://doi.org/10.1109/TSMC.1979.4310076
1975
-
[47]
I. N. Sneddon, The relation between load and penetration in the axisymmetric boussinesq problem for a punch of arbi- trary profile, Int. J. Eng. Sci. 3 (1) (1965) 47–57. doi:https://doi.org/10.1016/0020- 7225(65)90019-4
1965 doi
-
[48]
T. W. Clyne, J. E. Campbell, Nanoindentation and Micropillar Compression, Cambridge Univer- sity Press, 2021, Ch. 9, p. 192–218
2021
-
[49]
M. W. Phaneuf, Fib for materials science appli- cations—a review, in: Introduction to Focused Ion Beams: Instrumentation, Theory, Techniques and Practice, Springer Science & Business Media, 2004, p. 143
2004
-
[50]
Sezen, H
M. Sezen, H. Plank, E. Fisslthaler, B. Chernev, A. Zankel, E. Tchernychova, A. Bl¨ umel, E. J. List, W. Grogger, P. P¨ olt, An investigation on focused electron/ion beam induced degrada- tion mechanisms of conjugated polymers, Phys. Chem. Chem. Phys. 13 (45) (2011) 20235–20240...
2011 doi
-
[51]
Grubb, Radiation damage and elec- tron microscopy of organic polymers, J
D. Grubb, Radiation damage and elec- tron microscopy of organic polymers, J. Mater. Sci. 9 (1974) 1715–1736. doi:https://doi.org/10.1007/BF00540772
1974 doi
-
[52]
G. Wang, M. Kudo, K. Daicho, S. Harish, B. Xu, C. Shao, Y. Lee, Y. Liao, N. Matsushima, T. Kodama, et al., Enhanced high thermal con- ductivity cellulose filaments via hydrodynamic focusing, Nano Letters 22 (21) (2022) 8406–8412. doi:https://doi.org/10.1021/acs.nanolett.2c02057
2022 doi
-
[53]
X. Pan, M. G. Debije, A. P. Schenning, High thermal conductivity in anisotropic aligned polymeric materials, ACS Appl. Polym. Mater. 3 (2) (2021) 578–587. doi:https://doi.org/10.1021/acsapm.0c01340
2021 doi
-
[54]
J. A. El-Awady, C. Woodward, D. M. Dimiduk, N. M. Ghoniem, Effects of focused ion beam induced damage on the plasticity of mi- cropillars, Phys. Rev. B 80 (10) (2009) 104104. doi:https://doi.org/10.1103/PhysRevB.80.104104
2009 doi
-
[55]
J¨ ager, K
A. J¨ ager, K. Hofstetter, C. Buksnowitz, W. Gindl- Altmutter, J. Konnerth, Identification of stiffness tensor components of wood cell walls by means of nanoindentation, Compos. - A: Appl. Sci. Manuf. 42 (12) (2011) 2101–2109
2011
-
[56]
M. M. Hassani, F. K. Wittel, S. Hering, H. J. Herrmann, Rheological model for wood, Comput. Methods Appl. Mech. Eng. 283 (2015) 1032–1060. doi:https://doi.org/10.1016/j.cma.2014.10.031. 19
2015 doi
-
[141]
doi:https://doi.org/10.1007/BF00705928
-
[287]
doi:https:/doi.org/10.1088/0960- 1317/11/4/301
-
[523]
doi:https://doi.org/10.1146/annurev-matsci- 080819-123640
Reviewed August 7, 2026 · model on record in the stance chip above.
Discussion (0). Continue with ORCID to comment.