REVIEW 3 major objections 6 minor 70 references
Studying and Improving Graph Neural Network-based Motif Estimation
T0 review · 3 major / 6 minor · reviewed 2026-08-07 · deepseek-v4-flash
Pith's one-line read The paper argues that motif significance can be predicted directly as a multi-target regression of normalized Z-scores, decoupling motif analysis from subgraph counting and thereby escaping the expressivity limits that bound count-based…
desk verdict A genuinely new task formulation (direct SP regression) with an honest negative result, but the central quantitative comparison is built on an unvalidated approximation and needs repair. read the letter →
The pith
A machine-rendered reading of the paper's core claim, the machinery that carries it, and where it could break.
The reading
What carries the argument
The machinery is the significance-profile vector s = (s_1,...,s_8) with s_i = z_i / (sum_{j in $\Omega$(i)} $z_j^{2}$)^(1/2), where z_i is the Z-score of induced occurrences of pattern H_i under a degree-preserving rewiring null model and $\Omega$(i) is the size group (three or four nodes). Normalization confines each profile to [-1,1], makes scores comparable across graph sizes, and imposes sum_i $s_i^{2}$ = 1 inside each group, which couples the targets and makes multi-task regression natural. The second load-bearing relation is the conservation law for size-three patterns: the induced 3-path count is the degree-sequence-determined count minus three times the triangle count, so the 3-path and triangle Z-scores are symmetric and size-four profiles are partly encoded in size-three profiles. The architecture is a standard MPNN with global addition pooling and an MLP head; among the backbones tried, GIN and SAGE performed best.
What would settle it
Take a held-out real network, predict its SP directly, and also predict subgraph frequencies with a count-trained GNN; then generate actual degree-preserving rewired control graphs, count the eight patterns in them, and compute the true Z-scores. If the true count-based Z-scores agree with the direct SP predictions as well as or better than the training-error approximation in Table 4, the central claim of direct-estimation superiority is not supported.
Extended reading notes
Core claim
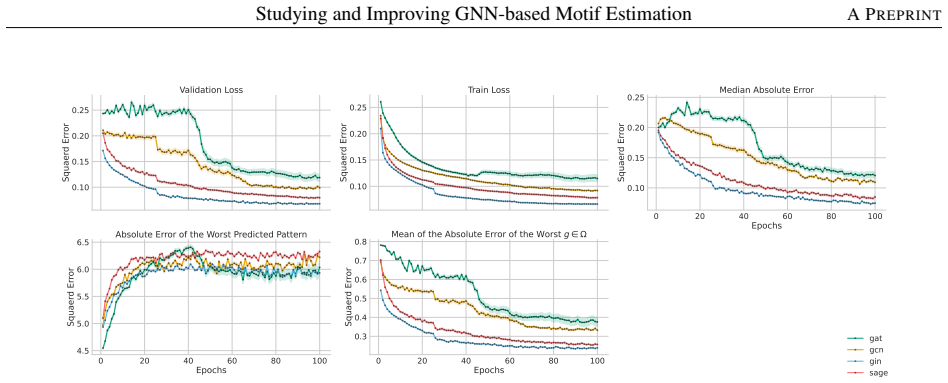
The paper's central claim is that significance-profile estimation is a task in its own right and can be decoupled from frequency counting. Concretely, instead of predicting C(H,G) and then deriving significance, the model outputs the normalized profile s_i = z_i / (sum_{j in $\Omega$(i)} $z_j^{2}$)^(1/2) for the eight connected graphs with three or four nodes, treating the whole vector as a single regression target. The experiments report three main results: multi-target regression generally beats training one model per subgraph; direct SP prediction beats a count-then-score pipeline on real-world graphs; and models with expressivity bounded by 1-WL, despite failing at precise intra-generator SP estimation, can match a real network to its closest synthetic generator through its predicted profile, with error growing by at most about 20% at 1000x out-of-distribution scale. The interpretive consequence the authors draw is that choosing a null model changes the difficulty of motif estimation, so expressivity lower bounds proved for subgraph counting need not transfer to significance-profile estimation.
Load-bearing premise
The load-bearing premise is that the comparison against the count-based approach is fair even though the paper approximates what that approach's standardized significance scores would be from its training error, rather than actually generating rewired control graphs and counting motifs in them; the comparison also assumes the synthetic training graphs are varied enough to represent real networks, and if either assumption fails the reported advantage of direct scoring over count-then-score weakens or disappears.
Editorial extensions
If this is right
- Direct SP estimation removes the need to generate control graphs at inference time; the paper reports speedups over the exact counting data structure of roughly 1.6 million on medium-large real networks and large core-efficiency gains.
- Because profiles are normalized, predicted motif scores can be compared across networks of different sizes, enabling downstream uses such as grouping or screening networks.
- The same model can serve as a network categorizer: even when precise profile values are off, the predicted profile points to the synthetic generator whose graphs most resemble the input network.
- The conceptual decoupling means future motif estimators do not have to beat subgraph-counting expressivity bounds; they only need to approximate the significance-profile under a chosen null model.
- The size-three conservation law implies that predicting one of the 3-path/triangle pair largely determines the other, so the regression target has hidden redundancy that could be exploited for efficiency.
Reading between the lines
- A natural next experiment the paper does not run is to sweep null models, from the trivial null that always returns zero to a fully random one, and map where 1-WL models start to fail; that map would test the paper's claim that expressivity bounds depend on the null model.
- The reported stability at 1000x size suggests a practical screening pipeline: train once on synthetic graphs, run direct SP prediction on very large real networks, and reserve exact counting for networks whose predicted profiles fall near motif boundaries.
- Because the 3-path and triangle scores are algebraically tied under the configuration model, a two-scalar or even one-scalar target could replace the size-three block of the regression, potentially improving precision while reducing model size.
- The real-world generator-matching results imply a lightweight network-similarity heuristic: compare predicted profiles to generator-typical profiles rather than to exact ground truth, which can label unfamiliar networks with a candidate generative process.
Editorial analysis
A structured set of objections, weighed in public.
Referee Report
Summary. The paper proposes a reformulation of network motif estimation as direct multi-target regression of normalized significance profiles (SPs), rather than first counting subgraph frequencies and then computing Z-scores against a null model. Using a large synthetic dataset from 23 graph generators and a collection of 115 real-world networks, with ground-truth SPs computed by G-Tries, the authors train MPNNs (GIN, GAT, GraphSage, GCN) and report: multi-target regression generally beats single-target training; direct SP estimation yields lower error than a count-based baseline (Table 4); models can distinguish synthetic generators and match some real-world networks to synthetic generators; and inference is orders of magnitude faster than G-Tries. The paper also argues that direct SP estimation may circumvent expressivity limits of subgraph-counting GNNs.
Significance. If the main empirical claims hold, the work provides a scalable surrogate for motif analysis and a new benchmark task for GNNs, supported by a substantial synthetic dataset with SP ground truths and reproducible code. The multi-target formulation and the explicit link to null-model-based significance are conceptually clean. However, the central advantage over count-then-score is not yet established because the comparison baseline is an unvalidated approximation, and the stability claim lacks supporting measurements; these issues need to be addressed before the contribution is fully supported.
major comments (3)
- [Section 6.2, Table 4] The Table 4 comparison is load-bearing for the paper's central claim that direct SP estimation outperforms count-then-score, but the count baseline is an analytic approximation, not an actual pipeline. The authors approximate the Z-score that would be obtained from subgraph estimation by decomposing the frequency variable into actual frequency y and model error z and using (y − E[y]) ± σz / sqrt(Var(y)^2 + Var(z)^2). This assumes that the count model's training-error distribution can stand in for the distribution of counts over degree-preserving control graphs, which is the distribution a true Z-score requires. No derivation or validation of this approximation is given, and for real-world test graphs—which are out-of-distribution—there is no reason the training error variance should match null-model count variance. The minimum over signal combinations only fixes sign ambiguities, not the magnitude of the error. Consequently, the reported 50–90% error reductions in Table 4 do not establish that direct SP estimation is more accurate than a genuine count-then-score method. The authors should either implement the real baseline (generate control graphs and compute Z-scores from counts) or, if an approximation is retained, validate it against exact Z-scores on a hold-out subset and report that validation.
- [Section 6.3] The stability claim—'the model remains stable, with errors increasing by at most ≈ 20% as networks scales up to 1000 times the train size'—is stated without any supporting measurements. No figure or table reports prediction error as a function of the ratio between test and training network size, and the source of the 20% figure is not identified. Since stability under out-of-distribution network sizes is one of the paper's key contributions (Introduction point 5), this claim needs direct evidence, such as error percentiles for real-world networks binned by node/edge count relative to the training distribution, or a plot of error versus size multiplier.
- [Section 6.3] The claim that the models can 'help identify the closest synthetic model for real networks based on significance-profiles' is supported only by three hand-selected examples (ia-escorts-dynamic, coauthor-CS, ia-primary-school-proximity) plus an unspecified reference to 'other correct matches.' No systematic evaluation is provided: the paper does not report the predicted nearest synthetic generator for all real-world networks, nor does it compare against a trivial baseline (e.g., matching by size or degree distribution). As it stands, this generalisation claim is anecdotal and should either be quantified or explicitly presented as a qualitative observation.
minor comments (6)
- [Section 6.4, Appendix A] The tool is referred to as 'Gtrie', 'G-Trie', and 'G-tries' inconsistently; please unify the terminology.
- [Abstract] 'This first study on GNN-based motif estimation' is overstated given the related works cited in Section 2.4 (e.g., SPMiner, MICRO-Graph, MotiFiesta); suggest 'the first benchmark for direct significance-profile prediction' or similar.
- [Table 3] The conclusion that multi-target regression is generally superior is not fully supported by the percentile table, since several entries show increased error for the multi-target model (e.g., rows at 100% and 50% for some graph types); consider reporting aggregate metrics or a paired significance test.
- [Section 6.2] The sentence 'Assuming that the difference between a value z ∼ z and µz is proportional to σz' is unclear as written; please rewrite to define z, µz, and σz explicitly.
- [Appendix A.4] 'Networks of of paper citations' contains a duplicated word.
- [Section 3.1] In the normalization formula, the denominator is defined as the norm over the group Ω(i); consider clarifying that groups are the size-three and size-four subsets of Ω, and that the formula assumes the group is non-empty.
Circularity Check
Core held-out SP predictions are not circular; the Table 4 count-then-score baseline is approximated from the count model's own training error rather than from actual null-model counting, so the claimed advantage is partly self-referential.
-
fitted input called prediction
[Section 6.2, Table 4 (Validations of the Assumptions Made)]
"To avoid generating 500 random networks per test instance, we opted for approximating the Z-score that would be later obtained from subgraph estimation. To achieve this, we decomposed the subgraph frequency variable into actual frequency (y) and model error (z)."
The count-then-score baseline in Table 4 is not an independent count-and-control-graph pipeline: its Z-scores are approximated using the count model's own training error z and the dataset's frequency statistics y. A Z-score requires the distribution of counts over null-model control graphs; substituting the model's training-error distribution means the 'Count' error column is generated from the very model being compared, not from a separate count-then-score procedure. The reported error reductions for direct SP estimation therefore depend on this self-referential approximation and do not establish superiority over an actual count-then-score baseline.
full rationale
The central contribution—multi-target regression of normalized significance-profiles—is evaluated on held-out synthetic and real-world graphs against ground truth computed with G-Tries, an external tool, so the predictions are not derived from the fitted quantities. The multitarget-versus-single-target comparison also uses validation-set errors, and the expressivity discussion relies on external results (Chen et al., Lanzinger and Barceló) rather than on self-citations that carry the argument. The one mild circularity is the Section 6.2 comparison in Table 4: the count-then-score baseline is approximated by decomposing frequency into y and model error z, with z taken from training, instead of generating control graphs and counting. That makes the count baseline's errors partly an artifact of the count model's own training distribution, weakening the superiority claim without invalidating the direct SP predictions. Accordingly, the paper has no load-bearing circularity in its main derivation, but one comparison step is self-referential enough to merit a low nonzero score.
Assumptions & free parameters
free parameters (3)
- Correctness thresholds =
5%, 10%, 25%, 50%
- Deterministic rewiring fraction =
25%
- Number of null-model control graphs for ground-truth Z-scores =
not stated
assumptions (6)
- domain assumption Degree-preserving random rewiring is the appropriate null model for motif significance.
- standard math G-Tries returns exact induced subgraph counts and correct Z-scores.
- standard math WL expressivity results (1-WL cannot count induced patterns with 3+ nodes; 3-WL counts all patterns of at most 3 nodes) carry over to SP regression.
- domain assumption Multi-target training benefits from shared structure among the 8 target graphs.
- domain assumption The synthetic generators' output distribution is diverse enough to stand in for real-world graphs.
- ad hoc to paper The count-error distribution of the frequency model can proxy for control-network Z-score variability.
Cite this review
Pith. "Pith review of Studying and Improving Graph Neural Network-based Motif Estimation." pith.science (2026). https://pith.science/paper/FSQSDBPY
@misc{pith2026250615709,
  author       = {Pith},
  title        = {Pith review of: Studying and Improving Graph Neural Network-based Motif Estimation},
  year         = {2026},
  howpublished = {\url{https://pith.science/paper/FSQSDBPY}},
  note         = {Machine review of arXiv:2506.15709}
}
read the original abstract
Graph Neural Networks (GNNs) are a predominant method for graph representation learning. However, beyond subgraph frequency estimation, their application to network motif significance-profile (SP) prediction remains under-explored, with no established benchmarks in the literature. We propose to address this problem, framing SP estimation as a task independent of subgraph frequency estimation. Our approach shifts from frequency counting to direct SP estimation and modulates the problem as multitarget regression. The reformulation is optimised for interpretability, stability and scalability on large graphs. We validate our method using a large synthetic dataset and further test it on real-world graphs. Our experiments reveal that 1-WL limited models struggle to make precise estimations of SPs. However, they can generalise to approximate the graph generation processes of networks by comparing their predicted SP with the ones originating from synthetic generators. This first study on GNN-based motif estimation also hints at how using direct SP estimation can help go past the theoretical limitations that motif estimation faces when performed through subgraph counting.
Figures


Figures from the paper (6 more)



Reference graph
Works this paper leans on
-
[1]
I., Grohe, M., and Lukasiewicz, T
Abboud, R., Ceylan, I. I., Grohe, M., and Lukasiewicz, T. (2021). The Surprising Power of Graph Neural Networks with Random Node Initialization . In Proceedings of the Thirtieth International Joint Conference on Artificial Intelligence , pages 2112--2118, California
work page 2021
-
[2]
Akiba, T., Sano, S., Yanase, T., Ohta, T., and Koyama, M. (2019). Optuna: A next-generation hyperparameter optimization framework. In Proceedings of the 25th ACM SIGKDD International Conference on Knowledge Discovery and Data Mining
work page 2019
-
[3]
Albert, R. and Barab \' a si, A. L. (2000). Topology of evolving networks: Local events and universality . Physical Review Letters , 85(24):5234--5237
work page 2000
-
[4]
Albert, R., Jeong, H., and Barabási, A.-L. (1999). Diameter of the world-wide web. Nature , 401(6749):130--131
work page 1999
-
[5]
Alon, U. (2007). Network motifs: theory and experimental approaches . Nature Reviews Genetics , 8(6):450--461
work page 2007
-
[6]
Asikainen, A., Iñiguez, G., Ureña-Carrión, J., Kaski, K., and Kivel\" a , M. (2020). Cumulative effects of triadic closure and homophily in social networks. Science Advances , 6(19)
work page 2020
-
[7]
Babai, L., Erdős, P., and Selkow, S. M. (1980). Random Graph Isomorphism . SIAM Journal on Computing , 9(3):628--635
work page 1980
-
[8]
Babai, L. and Kucera, L. (1979). Canonical Labelling of Graphs in Linear Average Time. Annual Symposium on Foundations of Computer Science - Proceedings , (2):39--46
work page 1979
Show all 70 references
-
[9]
Balcilar, M., Heroux, P., Gauzere, B., Vasseur, P., Adam, S., and Honeine, P. (2021). Breaking the limits of message passing graph neural networks. In Meila, M. and Zhang, T., editors, Proceedings of the 38th International Conference on Machine Learning , volume 139 of Proceed...
2021
-
[10]
and P \'o sfai, M
Barab \'a si, A.-L. and P \'o sfai, M. (2017). Network science . Cambridge University Press
2017
-
[11]
Barabási, A.-L., Albert, R., and Jeong, H. (2000). Scale-free characteristics of random networks: the topology of the world-wide web. Physica A: Statistical Mechanics and its Applications , 281(1-4):69--77
2000
-
[12]
Besta, M., Grob, R., Miglioli, C., Bernold, N., Kwasniewski, G., Gjini, G., Kanakagiri, R., Ashkboos, S., Gianinazzi, L., Dryden, N., and Hoefler, T. (2022). Motif prediction with graph neural networks. In Proceedings of the 28th ACM SIGKDD Conference on Knowledge Discovery an...
2022
-
[13]
Brandes, U., Gaertler, M., and Wagner, D. (2003). Experiments on Graph Clustering Algorithms , pages 568--579. Springer Berlin Heidelberg
2003
-
[14]
Cai, J.-Y., Furer, M., and Immerman, N. (1989). An optimal lower bound on the number of variables for graph identification . In 30th Annual Symposium on Foundations of Computer Science , pages 612--617. IEEE
1989
-
[15]
and Ying, R
Chen, J. and Ying, R. (2023). TempME: Towards the Explainability of Temporal Graph Neural Networks via Motif Discovery . (NeurIPS):1--24
2023
-
[16]
Chen, K., Liu, S., Zhu, T., Qiao, J., Su, Y., Tian, Y., Zheng, T., Zhang, H., Feng, Z., Ye, J., and Song, M. (2023). Improving Expressivity of GNNs with Subgraph-specific Factor Embedded Normalization . In Proceedings of the 29th ACM SIGKDD Conference on Knowledge Discovery an...
2023
-
[17]
Chen, Z., Chen, L., Villar, S., and Bruna, J. (2020). Can graph neural networks count substructures? Advances in Neural Information Processing Systems , 2020-Decem(NeurIPS)
2020
-
[18]
Corso, G., Cavalleri, L., Beaini, D., Li \` o , P., and Veli c kovi \' c , P. (2020). Principal Neighbourhood Aggregation for Graph Nets . Advances in Neural Information Processing Systems , 2020-Decem(NeurIPS)
2020
-
[19]
and Christensen, M
Dall, J. and Christensen, M. (2002). Random geometric graphs . Physical Review E , 66(1):016121
2002
-
[20]
R., Das, M., and Yang, H
Dareddy, M. R., Das, M., and Yang, H. (2019). motif2vec: Motif Aware Node Representation Learning for Heterogeneous Networks . In 2019 IEEE International Conference on Big Data (Big Data) , pages 1052--1059. IEEE
2019
-
[21]
N., Goltsev, A
Dorogovtsev, S. N., Goltsev, A. V., and Mendes, J. F. F. (2002). Pseudofractal scale-free web. Physical Review E , 65(6)
2002
-
[22]
and R \' e nyi, A
Erd o s, P. and R \' e nyi, A. (1960). On the Evolution of Random Graphs . Magyar Tudom \' a nyos Akad \' e mia \' E rtesit \" o je , 5(1):17--61
1960
-
[23]
M., and Maron, H
Frasca, F., Bevilacqua, B., Bronstein, M. M., and Maron, H. (2022). Understanding and Extending Subgraph GNNs by Rethinking Their Symmetries . Advances in Neural Information Processing Systems , 35(NeurIPS)
2022
-
[24]
Fu, T., Wei, C., Wang, Y., and Ying, R. (2023). DeSCo: Towards Generalizable and Scalable Deep Subgraph Counting
2023
-
[25]
and Mugler, A
Ginoza, R. and Mugler, A. (2010). Network motifs come in sets: Correlations in the randomization process. Physical Review E , 82(1)
2010
-
[26]
E., and Sculley, D., editors (2017)
Golovin, D., Solnik, B., Moitra, S., Kochanski, G., Karro, J. E., and Sculley, D., editors (2017). Google Vizier: A Service for Black-Box Optimization
2017
-
[27]
L., Ying, R., and Leskovec, J
Hamilton, W. L., Ying, R., and Leskovec, J. (2017). Inductive representation learning on large graphs
2017
-
[28]
J., Rašajski, M., and Pržulj, N
Higham, D. J., Rašajski, M., and Pržulj, N. (2008). Fitting a geometric graph to a protein-protein interaction network. Bioinformatics , 24(8):1093--1099
2008
-
[29]
and Kim, B
Holme, P. and Kim, B. J. (2002). Growing scale-free networks with tunable clustering . Physical Review E , 65(2):026107
2002
-
[30]
Hu, W., Fey, M., Ren, H., Nakata, M., Dong, Y., and Leskovec, J. (2021a). Ogb-lsc: A large-scale challenge for machine learning on graphs
2021
-
[31]
Hu, W., Fey, M., Zitnik, M., Dong, Y., Ren, H., Liu, B., Catasta, M., and Leskovec, J. (2021b). Open graph benchmark: Datasets for machine learning on graphs
2021
-
[32]
Huang, Y., Peng, X., Ma, J., and Zhang, M. (2022). Boosting the Cycle Counting Power of Graph Neural Networks with I \ \^ 2 \ -GNNs . pages 1--27
2022
-
[33]
L., and Yuryev, A
Ispolatov, I., Krapivsky, P. L., and Yuryev, A. (2005). Duplication-divergence model of protein interaction network . Physical Review E , 71(6):061911
2005
-
[34]
Kipf, T. N. and Welling, M. (2017). Semi-Supervised Classification with Graph Convolutional Networks . 5th International Conference on Learning Representations, ICLR 2017 - Conference Track Proceedings , pages 1--14
2017
-
[35]
and Barceló, P
Lanzinger, M. and Barceló, P. (2023). On the power of the weisfeiler-leman test for graph motif parameters
2023
-
[36]
B., Rossi, R
Lee, J. B., Rossi, R. A., Kong, X., Kim, S., Koh, E., and Rao, A. (2018). Higher-order graph convolutional networks
2018
-
[37]
Leskovec, J., Kleinberg, J., and Faloutsos, C. (2007). Graph evolution: Densification and shrinking diameters . ACM Transactions on Knowledge Discovery from Data , 1(1)
2007
-
[38]
E., and Stoica, I
Liaw, R., Liang, E., Nishihara, R., Moritz, P., Gonzalez, J. E., and Stoica, I. (2018). Tune: A research platform for distributed model selection and training. arXiv preprint arXiv:1807.05118
2018 arXiv
-
[39]
Lubotzky, A. (1994). Discrete Groups, Expanding Graphs and Invariant Measures . Birkh\" a user Basel
1994
-
[40]
and Alon, U
Mangan, S. and Alon, U. (2003). Structure and function of the feed-forward loop network motif. Proceedings of the National Academy of Sciences , 100(21):11980--11985
2003
-
[41]
Milo, R., Itzkovitz, S., Kashtan, N., Levitt, R., Shen-Orr, S., Ayzenshtat, I., Sheffer, M., and Alon, U. (2004a). Superfamilies of Evolved and Designed Networks . Science , 303(March):1538--1542
2004
-
[42]
Milo, R., Shen-Orr, S., Itzkovitz, S., Kashtan, N., Chklovskii, D., and Alon, U. (2004b). Network Motifs: Simple Building Blocks of Complex Networks . Science , 9781400841(October):217--220
2004
-
[43]
I., and Stoica, I
Moritz, P., Nishihara, R., Wang, S., Tumanov, A., Liaw, R., Liang, E., Elibol, M., Yang, Z., Paul, W., Jordan, M. I., and Stoica, I. (2018). Ray: A distributed framework for emerging ai applications
2018
-
[44]
M., Bause, F., Kersting, K., Mutzel, P., and Neumann, M
Morris, C., Kriege, N. M., Bause, F., Kersting, K., Mutzel, P., and Neumann, M. (2020). Tudataset: A collection of benchmark datasets for learning with graphs
2020
-
[45]
L., Srinivasan, B., Rao, V., and Ribeiro, B
Murphy, R. L., Srinivasan, B., Rao, V., and Ribeiro, B. (2019). Relational Pooling for Graph Representations . 36th International Conference on Machine Learning, ICML 2019 , 2019-June:8192--8202
2019
-
[46]
and Watts, D
Newman, M. and Watts, D. (1999). Renormalization group analysis of the small-world network model . Physics Letters A , 263(4-6):341--346
1999
-
[47]
Oliver, C., Chen, D., Mallet, V., Philippopoulos, P., and Borgwardt, K. (2022). Approximate Network Motif Mining Via Graph Learning
2022
-
[48]
Penrose, M. (2003). Random geometric graphs . Oxford Studies in Probability. Oxford University Press, London, England
2003
-
[49]
Pr z ulj, N. (2007). Biological network comparison using graphlet degree distribution . Bioinformatics , 23(2):e177--e183
2007
-
[50]
Ribeiro, P., Paredes, P., Silva, M. E. P., Aparicio, D., and Silva, F. (2021). A survey on subgraph counting: Concepts, algorithms, and applications to network motifs and graphlets. ACM Comput. Surv. , 54(2)
2021
-
[51]
and Silva, F
Ribeiro, P. and Silva, F. (2013). G-tries: a data structure for storing and finding subgraphs. Data Mining and Knowledge Discovery , 28(2):337--377
2013
-
[52]
Rong, Y., Bian, Y., Xu, T., Xie, W., Wei, Y., Huang, W., and Huang, J. (2020). Self-supervised graph transformer on large-scale molecular data
2020
-
[53]
Roy, S., Ghosh, P., Barua, D., and Das, S. K. (2020). Motifs enable communication efficiency and fault-tolerance in transcriptional networks. Scientific Reports , 10(1)
2020
-
[54]
S., Milo, R., Mangan, S., and Alon, U
Shen-Orr, S. S., Milo, R., Mangan, S., and Alon, U. (2002). Network motifs in the transcriptional regulation network of Escherichia coli . Nature Genetics , 31(1):64--68
2002
-
[55]
Sheng, J., Zhang, Y., Wang, B., and Chang, Y. (2024). MGATs: Motif-Based Graph Attention Networks . Mathematics , 12(2):293
2024
-
[56]
Silva, M. E. P., Gaunt, R. E., Ospina-Forero, L., Jay, C., and House, T. (2023). Comparing directed networks via denoising graphlet distributions. Journal of Complex Networks , 11(2)
2023
-
[57]
Veli c kovi \' c , P., Casanova, A., Li \` o , P., Cucurull, G., Romero, A., and Bengio, Y. (2018). Graph attention networks . 6th International Conference on Learning Representations, ICLR 2018 - Conference Track Proceedings , pages 1--12
2018
-
[58]
Veli c kovi \' c , P., Ying, R., Padovano, M., Hadsell, R., and Blundell, C. (2020). Neural Execution of Graph Algorithms . 8th International Conference on Learning Representations, ICLR 2020
2020
-
[59]
and Zhang, M
Wang, Y. and Zhang, M. (2023). Towards Better Evaluation of GNN Expressiveness with BREC Dataset
2023
-
[60]
Watanabe, S. (2023). Tree-structured parzen estimator: Understanding its algorithm components and their roles for better empirical performance
2023
-
[61]
Watts, D. J. and Strogatz, S. H. (1998). Collective dynamics of ‘small-world’ networks. Nature , 393(6684):440--442
1998
-
[62]
Wegner, A. E. (2014). Motif Conservation Laws for the Configuration Model . pages 4--6
2014
-
[63]
N., Gomes, J., Geniesse, C., Pappu, A
Wu, Z., Ramsundar, B., Feinberg, E. N., Gomes, J., Geniesse, C., Pappu, A. S., Leswing, K., and Pande, V. (2018). Moleculenet: A benchmark for molecular machine learning
2018
-
[64]
Xu, K., Hu, W., Leskovec, J., and Jegelka, S. (2019). How Powerful are Graph Neural Networks? pages 1--17
2019
-
[65]
Yan, Z., Zhou, J., Gao, L., Tang, Z., and Zhang, M. (2023). Efficiently Counting Substructures by Subgraph GNNs without Running GNN on Subgraphs
2023
-
[66]
Ying, R., Bourgeois, D., You, J., Zitnik, M., and Leskovec, J. (2019). GNNExplainer: Generating Explanations for Graph Neural Networks. Advances in neural information processing systems , 32:9240--9251
2019
-
[67]
Z., and Jiaxuan You, J
Ying, R., Wang, A. Z., and Jiaxuan You, J. L. (2020). Spminer: Frequent subgraph mining by walking in order embedding space
2020
-
[68]
and Gao, H
Yu, Z. and Gao, H. (2022). Molecular representation learning via heterogeneous motif graph neural networks
2022
-
[69]
Zhang, B., Feng, G., Du, Y., He, D., and Wang, L. (2023). A Complete Expressiveness Hierarchy for Subgraph GNNs via Subgraph Weisfeiler-Lehman Tests . Proceedings of Machine Learning Research , 202:41019--41077
2023
-
[70]
Zhang, S., Hu, Z., Subramonian, A., and Sun, Y. (2020). Motif-driven contrastive learning of graph representations
2020
Reviewed August 7, 2026 · model on record in the stance chip above.
Discussion (0). Sign in to comment.