REVIEW 4 major objections 5 minor 2 cited by
The Rayleigh Criterion: Resolution Limits of Astronomical Periodograms
T0 review · 4 major / 5 minor · reviewed 2026-08-06 · deepseek-v4-flash
Pith's one-line read The paper claims that periodogram peaks are resolvable only when separated by at least twice the Rayleigh resolution $R=1/T$, and applies this rule to call into question several published planet and stellar-rotation detections.
desk verdict Sensible caution about periodogram resolution, but the paper overstates the case for C=2, and its own synthetic experiment shows correct peaks at C=1.6. read the letter →
The pith
A machine-rendered reading of the paper's core claim, the machinery that carries it, and where it could break.
The reading
What carries the argument
The central object is the Rayleigh resolution $R = 1/T$, the frequency spacing of the spectral window (the Fejér kernel) produced by a finite, unevenly sampled time series. The paper's criterion $|f_1 - f_2| \geq 2R$, together with its corollaries $f_{\min} = 2R$ and 'oversampling adds no resolution,' is the tool that decides which periodogram peaks count as independent signals. The generalized Lomb-Scargle periodogram and the Bayesian generalized Lomb-Scargle periodogram are the estimators on which the criterion is tested and applied.
What would settle it
Run a simulation of two equal-amplitude sinusoids separated by $1.5R$ over a long baseline with random relative phases, and count how often the generalized Lomb-Scargle periodogram produces two distinct peaks at the correct frequencies. If a large majority of phase realizations resolve them, the paper's $2R$ threshold is too strict; if few do, the threshold is supported.
Extended reading notes
Core claim
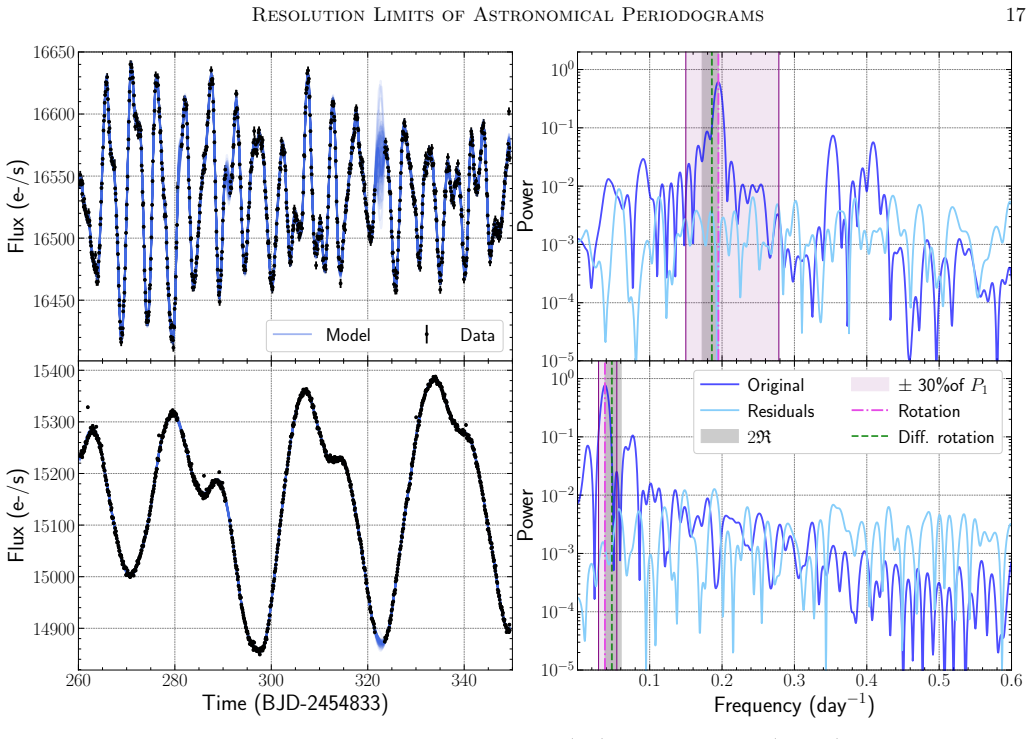
The paper's central claim is that the Rayleigh criterion should govern periodogram resolution with the conservative constant $C = 2$, so that two signals are resolved only when $|f_1 - f_2| \geq 2R = 2/T$, and that no oscillation can be detected at frequencies below $f_{\min} = 2R$. Oversampling the frequency grid cannot beat this limit. The choice of $C = 2$ is justified by the requirement that the time series contain a repeat of every part of every wave, including the beating between the two sinusoids. The authors then apply this criterion to four published datasets, finding that 55 Cnc d and the activity cycle are separated by only $0.75R$, the HD 99492 planet candidate sits at $0.98R$ from zero frequency, the Barnard's star long-term variability in the 2018 data is better fit by a cubic than a sinusoid, and for two Kepler stars the signals attributed to differential rotation can be modeled by a single quasiperiodic Gaussian process.
Load-bearing premise
The argument for choosing $C = 2$, rather than the smaller values near 1.5 found in earlier experiments, rests on a heuristic about sampling every part of the beat pattern and is not derived from first principles.
Editorial extensions
If this is right
- Observers should not claim two distinct periodic signals unless their frequencies are separated by at least $2R$, and should not quote a period longer than $T/2$ as a measured oscillation.
- The published radial velocities of 55 Cnc cannot by themselves establish the period of planet d or distinguish it from the star's magnetic activity cycle; other data types are required.
- The 4970-day planet candidate around HD 99492 is statistically indistinguishable from a zero-frequency trend in the published radial velocities, so it should be modeled as a trend rather than an orbit.
- The Barnard's star activity signal in the 2018 dataset is better described by a cubic polynomial than by a sinusoid, so no activity-cycle period should be inferred from those data alone.
- In the large Kepler rotation sample, 91.7 percent of reported differential-rotation frequency pairs do not meet the $2R$ threshold, and the two re-analyzed stars are adequately fit by a single quasiperiodic Gaussian process.
Reading between the lines
- If the true resolution threshold is nearer $1.5R$ than $2R$, as earlier numerical experiments and the paper's own Section 4.3 baseline ($C \approx 1.6$) suggest, the verdicts on 55 Cnc d, HD 99492 c, and the Kepler differential rotators would be over-conservative, and a longer-baseline dataset could legitimately resurrect some of those detections.
- The phase-dependence seen in the synthetic two-sinusoid experiment implies that resolution is not a fixed property of the time series alone but depends on the relative phases of the signals; a search pipeline could quantify the probability of resolving a given separation over random phases.
- The paper's criterion implies a practical catalog rule for ongoing planet surveys: any candidate whose reported period exceeds half the observing baseline should be flagged as an unresolved trend until astrometry or additional data confirm it.
- The Gaussian-process re-analysis suggests a testable extension: applying the same single-quasiperiodic model to a random subset of the 17,081 unresolved differential-rotation candidates would show how often the simpler model wins on out-of-sample light curves.
Editorial analysis
A structured set of objections, weighed in public.
Referee Report
Summary. The paper argues that the Rayleigh criterion, conventionally stated as |f1 - f2| >= C/T with R = 1/T, should be applied as a resolution check on periodograms of astronomical time series. It sets C = 2, states as Corollary 1 that the lowest observable frequency is f_min = C R, and as Corollary 2 that oversampling the frequency grid does not improve resolution. These corollaries are used to interpret three synthetic experiments (peak splitting from window function, phase-dependent resolving power, and time-baseline effects) and to reassess four published datasets: 55 Cnc, HD 99492, Barnard's Star, and two Kepler differential-rotation targets. The conclusions are that 55 Cnc d is not separable from the activity cycle in RVs, the long-period planet candidate of HD 99492 is not separable from zero frequency, a cubic polynomial is a better detrending model than a sinusoid for Barnard's Star RVs over the stated baseline, and the secondary rotation peaks of KIC 891916 and KIC 1869783 are not resolvable from the primary under the criterion.
Significance. If the criterion with C close to 2 is accepted, the paper supplies a practical and important cautionary framework for periodogram-based detection claims, with immediate relevance to RV planet searches, stellar activity studies, and differential-rotation surveys. The paper's strengths include controlled synthetic experiments, explicit comparison of generalized Lomb-Scargle and Bayesian periodograms, independent GP re-analysis of the Kepler light curves, and a public data release. The central quantitative result, however, is not a sharp derived limit but a heuristic choice of C=2, and the paper's own baseline experiment at C=1.6 already produces correct peak positions; this tension is load-bearing because most archival conclusions are phrased as binary resolvability statements using C=2.
major comments (4)
- [Sec. 3, Eq. (7)] The paper asserts that C=2 is 'the appropriate Rayleigh criterion' and justifies it only by the heuristic that the time series must contain a repeat of every part of every wave, including the beating envelope. This is a necessary condition for cleanly separating two sinusoids, not a proof of a sharp resolution threshold, and the paper explicitly promises experimental evidence in Sec. 4. That evidence, however, goes the other way: in Sec. 4.3, at T=80 (C=1.6), P1 and P3 already have all peaks at the correct frequencies. The conclusion drawn there that accurate estimates are 'only guaranteed' for f>2R is therefore not supported by the presented experiments; no trial isolates a failure between C=1.6 and C=2. Because all case-study conclusions in Sec. 5 (55 Cnc d, HD 99492 c, the Reinhold et al. pairs, and the 91.7% census) are stated against the C=2 threshold, the central claim of the paper needs either (a) a derivation of C=2 from a quantitative criterion (e.g., a false-positive/false-negative rate on periodogram peak recovery) or (b) a reframing of C=2 as a conservative, non-sharp convention, with the archival claims softened accordingly.
- [Sec. 4.3, Fig. 4] The text states that at N=40 and T=0.8, P3 has a peak centered at f=2.4, even less accurate than at T=30; yet at N=80 and T=1.6, P1 and P3 have all peaks at the correct frequencies. This narrative is qualitative: there is no measure of peak-position error versus T, no repeated noise realizations, and no statistical confidence intervals for the recovered frequencies. Given that the paper's Corollary 1 (f_min = 2R) is used to justify a hard cutoff in all archival sections, the experiment should be quantified (e.g., histogram of recovered frequency errors as a function of C, or the fraction of trials in which both peaks are identified within some tolerance). Without such quantification, the statement that f>2R is the threshold at which accuracy is guaranteed overstates the evidence and is not falsifiable.
- [Secs. 5.1, 5.2, 5.4] The applied conclusions are phrased as binary statements: 55 Cnc d and the activity cycle 'cannot be distinguished' at |fd - fmag| = 0.75R, the HD 99492 planet candidate 'cannot be statistically separated' at f = 0.98R, and 17,081 of 18,616 differential-rotation pairs 'should not be claimed' because their separation is below 2R. These statements inherit the uncertainty in C. For 0.75R and 0.98R, even the more optimistic cited thresholds (1.44-1.5R) give the same qualitative answer, so those two case studies are robust; however, the differential-rotation census would change substantially if the threshold were near 1.5R instead of 2R, and the paper should either recompute the census for a range of C values or explicitly state that the census is for the conservative C=2 convention. As written, the 91.7% figure and the associated warnings overstate the case.
- [Sec. 5.3] The conclusion that a cubic polynomial is a better model than a sinusoid for the Barnard's Star long-term variability rests on a difference in residual standard deviations of 2.597 m/s versus 2.704 m/s. This is a small difference, and the paper does not provide uncertainties on these fits (e.g., via cross-validation, a likelihood-ratio test, or an information criterion). The statement that the cubic is 'superior' should be supported by a quantitative model comparison, especially because the paper elsewhere advises using BIC/AIC and likelihood-ratio tests for model selection.
minor comments (5)
- [Sec. 4.1] In the paragraph after Figure 2, 'periododogram' should be 'periodogram'; earlier in the same section 'Rayeligh' should be 'Rayleigh'.
- [Sec. 4, last paragraph of 4.2] In the sentence beginning 'On the other hand, harmonic analysis is a frequency domain model-fitting process...' the phrase 'sinsuosid' should be 'sinusoid'.
- [Table 2] The row for KIC 1869783 is missing the value of 2R in the final column; the separation 0.0096 is listed, but the reader cannot verify the claim that it is less than 2R without that entry.
- [Fig. 12 caption] The caption reads 'GLPS of the original data' but should read 'GLSP'; also, in Sec. 5.4.1 'GLSP' is used consistently elsewhere.
- [Appendix A] Equation (A1) uses the abbreviation 'GSLP' while the rest of the paper uses 'GLSP'; please make consistent.
Circularity Check
No significant circularity: the Rayleigh criterion is an external standard applied to independent synthetic and archival data; the C=2 choice is heuristic but not fitted or self-referential.
full rationale
The paper's central quantity, the Rayleigh resolution R = 1/T, is an externally defined standard (e.g., Godin 1972; Christensen-Dalsgaard & Gough 1982), and the criterion |f1 - f2| >= CR is presented as a stated convention rather than as a quantity fitted to the data being 'predicted.' The synthetic experiments in Section 4 use known input signals and compare periodogram peaks against the chosen threshold; no parameter that defines the target conclusion (e.g., the 2R separation for 55 Cnc d and the activity cycle, or the f < 2R status of HD 99492 c) is estimated from those datasets. The GP and polynomial fits in Section 5 are independent model comparisons with stated likelihoods and residuals. The only self-citations (Dodson-Robinson et al. 2022 for Welch's method; Ramirez Delgado 2023 for data availability) are not load-bearing. The weak point is that C = 2 is justified by a repeat-of-beating heuristic, and Section 4.3 actually finds correct peaks at C = 1.6; this is an evidentiary or consistency concern about the chosen constant, not a circular derivation, because the case-study verdicts do not enter the definition of C.
Assumptions & free parameters
free parameters (3)
- Rayleigh criterion constant C =
2 (chosen by hand)
- SHO GP parameters for KIC 891916 =
mean 16533.77 e-/s, omega0 1.50 rad/day, S0 483.61, Q 2.90, jitter 5.41 e-/s
- SHO GP parameters for KIC 1869783 =
mean 15154.55 e-/s, omega0 0.29 rad/day, S0 11105.77, Q 4.94, jitter 12.67 e-/s
assumptions (3)
- standard math Finite time baseline limits periodogram resolution to the width of the spectral window, and the Fejer kernel's main lobe defines the resolution scale.
- ad hoc to paper For a periodic signal to be claimed, its frequency must be statistically distinguishable from zero, so f_min = C R.
- domain assumption A stochastically driven damped simple harmonic oscillator kernel adequately represents quasiperiodic stellar rotation for these two Kepler light curves.
Cite this review
Pith. "Pith review of The Rayleigh Criterion: Resolution Limits of Astronomical Periodograms." pith.science (2026). https://pith.science/paper/HRPBBBHZ
@misc{pith2026250620864,
  author       = {Pith},
  title        = {Pith review of: The Rayleigh Criterion: Resolution Limits of Astronomical Periodograms},
  year         = {2026},
  howpublished = {\url{https://pith.science/paper/HRPBBBHZ}},
  note         = {Machine review of arXiv:2506.20864}
}
read the original abstract
The Rayleigh criterion determines the resolution limit of a periodogram, which is the minimum frequency separation required to barely resolve two sinusoids. Failing to consider the Rayleigh criterion may result in incorrect interpretations of long-period signals or spurious claims that two closely spaced periodogram peaks represent two distinct physical processes. We demonstrate how applying the Rayleigh criterion can help observers avoid false positive detections caused by uneven observing cadence or insufficient observing time baseline. We present three synthetic datasets that illustrate (1) a single oscillation with a split Lomb-Scargle periodogram peak resulting from uneven observing cadence can be mistaken for two oscillations if the Rayleigh criterion is neglected, (2) oversampling a periodogram's frequency grid does not improve resolution, and (3) observing time baseline requirements for resolving two closely spaced oscillations. We use the Rayleigh criterion to revisit detections of planets, stellar activity, and differential rotation from four published datasets. We show that the frequency separation between planet 55~Cnc~d and the activity cycle is too small to distinguish the two phenomena based on published radial velocities (RVs) alone. Likewise, the contested 4970-day planet orbiting HD~99492 cannot be statistically separated from zero frequency. We determine that a cubic polynomial better explains the long-term RV variability of Barnard's star than a sinusoid model. Finally, our re-analysis of {\it Kepler} observations of two active stars shows that the signals previously attributed to differential rotation can be modeled by a Gaussian process with a single quasiperiodicity. This work demonstrates the importance of the Rayleigh criterion when constructing a time-domain model.
Figures


Figures from the paper (13 more)




Forward citations
Cited by 2 Pith papers
-
Helical radio jets as probes of magnetised cluster environments: Periodic Faraday Rotation Revealed in the Corkscrew Galaxy by POSSUM
Periodic RM oscillations matching the Corkscrew jet's lateral deviations reveal a transition from jet/sheath to local-ICM Faraday media along the flow.
-
High-Pass Filtering and Gaussian Process Regularization: Stellar Activity Characterization Techniques Applied to the 55 Cancri Planetary System
A curvature-penalized Gaussian process can absorb the long-term radial velocity signal attributed to 55 Cancri d, so the data alone do not prove the planet exists.
Reference graph
Works this paper leans on
-
[1]
, " * write output.state after.block = add.period write newline
ENTRY address archivePrefix author booktitle chapter doi edition editor eprint howpublished institution journal key month number organization pages publisher school series title misctitle type volume year version url label extra.label sort.label short.list INTEGERS output.state before.all mid.sentence after.sentence after.block FUNCTION init.state.consts ...
-
[2]
write newline
" write newline "" before.all 'output.state := FUNCTION format.url url empty "" new.block "" url * "" * if FUNCTION format.eprint eprint empty "" archivePrefix empty "" archivePrefix "arXiv" = new.block " " eprint * " " * new.block " " eprint * " " * if if if FUNCTION format.doi doi empty "" " " doi * " " * if FUNCTION format.pid doi empty eprint empty ur...
-
[3]
UZg̈X˯w | ? |ݷN͇T?]ҿwϝ oۯHU ߾y >/էgdw5r
thebibliography [1] 20pt to REFERENCES 6pt =0pt -12pt 10pt plus 3pt =0pt =0pt =1pt plus 1pt =0pt =0pt -12pt =13pt plus 1pt =20pt =13pt plus 1pt \@M =10000 =-1.0em =0pt =0pt 0pt =0pt =1.0em @enumiv\@empty 10000 10000 `\.\@m \@noitemerr \@latex@warning Empty `thebibliography' environment \@ifnextchar \@reference \@latexerr Missing key on reference command E...
arXiv 2021
-
[4]
Abe, M., & Smith, J. O. 2004, Journal of The Audio Engineering Society
2004
-
[5]
2023, PeerJ Computer Science, 9, e1516
Abril-Pla, O., Andreani, V., Carroll, C., et al. 2023, PeerJ Computer Science, 9, e1516
2023
-
[6]
Aerts , C., Christensen-Dalsgaard , J., & Kurtz , D. W. 2010, Asteroseismology (Springer Science and Business Media), 10.1007/978-1-4020-5803-5
-
[7]
2012, , 548, A58, 10.1051/0004-6361/201219910
Anglada-Escud \'e , G., & Tuomi , M. 2012, , 548, A58, 10.1051/0004-6361/201219910
-
[8]
2013, , 556, A126, 10.1051/0004-6361/201321331
Anglada-Escud \'e , G., Tuomi , M., Gerlach , E., et al. 2013, , 556, A126, 10.1051/0004-6361/201321331
Show all 122 references
-
[9]
2018, , 474, 2094, 10.1093/mnras/stx2109
Angus , R., Morton , T., Aigrain , S., Foreman-Mackey , D., & Rajpaul , V. 2018, , 474, 2094, 10.1093/mnras/stx2109
2018 doi
-
[10]
M., Sip o cz , B
Astropy Collaboration , Price-Whelan , A. M., Sip o cz , B. M., et al. 2018, , 156, 123, 10.3847/1538-3881/aabc4f
2018 doi
-
[11]
L., Donahue , R
Baliunas , S. L., Donahue , R. A., Soon , W. H., et al. 1995, , 438, 269, 10.1086/175072
1995 doi
- [13]
- [14]
-
[15]
Basu , S., & Antia , H. M. 2008, , 457, 217, 10.1016/j.physrep.2007.12.002
2008 doi
-
[16]
A., Gorshkov , A
Baturin , V. A., Gorshkov , A. B., & Oreshina , A. V. 2015, Astronomy Reports, 59, 46, 10.1134/S1063772915010023
2015 doi
-
[17]
F., McArthur , B., Chappell , D
Benedict , G. F., McArthur , B., Chappell , D. W., et al. 1999, , 118, 1086, 10.1086/300975
1999 doi
- [18]
-
[19]
M., O'Donovan , F
Blomme , J., Sarro , L. M., O'Donovan , F. T., et al. 2011, , 418, 96, 10.1111/j.1365-2966.2011.19466.x
2011
-
[20]
2000, Fourier analysis of time series: an introduction, 2nd ed., Wiley series in probability and statistics
Bloomfield, P. 2000, Fourier analysis of time series: an introduction, 2nd ed., Wiley series in probability and statistics. Applied probability and statistics section (New York: Wiley)
2000
-
[21]
M., et al
Blunt , S., Endl , M., Weiss , L. M., et al. 2019, , 158, 181, 10.3847/1538-3881/ab3e63
2019 doi
-
[22]
2011, , 528, A4, 10.1051/0004-6361/201014354
Boisse , I., Bouchy , F., H \'e brard , G., et al. 2011, , 528, A4, 10.1051/0004-6361/201014354
2011 doi
-
[23]
Bonfils , X., Lo Curto , G., Correia , A. C. M., et al. 2013, , 556, A110, 10.1051/0004-6361/201220237
2013 doi
-
[24]
2018, , 619, A1, 10.1051/0004-6361/201833154
Bourrier , V., Dumusque , X., Dorn , C., et al. 2018, , 619, A1, 10.1051/0004-6361/201833154
2018 doi
-
[25]
Box , G. E. P., & Draper, N. R. 1987, Empirical model-building and response surfaces (USA: John Wiley & Sons, Inc.)
1987
-
[26]
2001, in Encyclopedia of Vibration, ed
Braun, S. 2001, in Encyclopedia of Vibration, ed. S. Braun (Oxford: Elsevier), 1208--1223, https://doi.org/10.1006/rwvb.2001.0187
2001
-
[27]
S., Antia , H
Brun , A. S., Antia , H. M., Chitre , S. M., & Zahn , J. P. 2002, , 391, 725, 10.1051/0004-6361:20020837
2002 doi
-
[28]
P., Marcy , G
Butler , R. P., Marcy , G. W., Williams , E., Hauser , H., & Shirts , P. 1997, , 474, L115, 10.1086/310444
1997 doi
-
[29]
P., Vogt , S
Butler , R. P., Vogt , S. S., Laughlin , G., et al. 2017, , 153, 208, 10.3847/1538-3881/aa66ca
2017 doi
-
[30]
1969, Proceedings of the IEEE, 57, 1408, 10.1109/PROC.1969.7278
Capon, J. 1969, Proceedings of the IEEE, 57, 1408, 10.1109/PROC.1969.7278
1969
-
[31]
Chaboyer , B., Demarque , P., & Pinsonneault , M. H. 1995, , 441, 865, 10.1086/175408
1995 doi
-
[32]
W., et al
Choi , J., McCarthy , C., Marcy , G. W., et al. 2013, , 764, 131, 10.1088/0004-637X/764/2/131
2013 doi
-
[33]
Christensen-Dalsgaard , J., & Gough , D. O. 1982, , 198, 141, 10.1093/mnras/198.1.141
1982 doi
-
[34]
R., McLeod , C
Claverie , A., Isaak , G. R., McLeod , C. P., van der Raay , H. B., & Roca Cortes , T. 1979, , 282, 591, 10.1038/282591a0
1979 doi
-
[35]
P., Marcy , G
Cumming , A., Butler , R. P., Marcy , G. W., et al. 2008, , 120, 531, 10.1086/588487
2008 doi
-
[36]
I., & Fabrycky , D
Dawson , R. I., & Fabrycky , D. C. 2010, , 722, 937, 10.1088/0004-637X/722/1/937
2010 doi
-
[37]
B., Hara , N., & S \'e gransan , D
Delisle , J. B., Hara , N., & S \'e gransan , D. 2020, , 635, A83, 10.1051/0004-6361/201936905
2020 doi
-
[38]
E., Delgado , V
Dodson-Robinson , S. E., Delgado , V. R., Harrell , J., & Haley , C. L. 2022, , 163, 169, 10.3847/1538-3881/ac52ed
2022 doi
-
[39]
Z., Levesque , E
Dorn-Wallenstein , T. Z., Levesque , E. M., & Davenport , J. R. A. 2019, , 878, 155, 10.3847/1538-4357/ab223f
2019 doi
-
[40]
C., Udry , S., Lovis , C., & Bonfils , X
Dumusque , X., Santos , N. C., Udry , S., Lovis , C., & Bonfils , X. 2011, , 527, A82, 10.1051/0004-6361/201015877
2011 doi
-
[41]
D., et al
Endl , M., Robertson , P., Cochran , W. D., et al. 2012, , 759, 19, 10.1088/0004-637X/759/1/19
2012 doi
-
[42]
P., Su \'a rez Mascare \ n o , A., Figueira , P., et al
Faria , J. P., Su \'a rez Mascare \ n o , A., Figueira , P., et al. 2022, , 658, A115, 10.1051/0004-6361/202142337
2022 doi
-
[43]
A., Marcy , G
Fischer , D. A., Marcy , G. W., Butler , R. P., et al. 2008, , 675, 790, 10.1086/525512
2008 doi
-
[44]
2018, Research Notes of the American Astronomical Society, 2, 31, 10.3847/2515-5172/aaaf6c
Foreman-Mackey , D. 2018, Research Notes of the American Astronomical Society, 2, 31, 10.3847/2515-5172/aaaf6c
2018 doi
-
[45]
2017, , 154, 220, 10.3847/1538-3881/aa9332
Foreman-Mackey , D., Agol , E., Ambikasaran , S., & Angus , R. 2017, , 154, 220, 10.3847/1538-3881/aa9332
2017 doi
- [46]
-
[47]
2023, , 672, A149, 10.1051/0004-6361/202245201
Fuhrmeister , B., Coffaro , M., Stelzer , B., et al. 2023, , 672, A149, 10.1051/0004-6361/202245201
2023 doi
-
[48]
2020, VizieR Online Data Catalog, I/350, 10.26093/cds/vizier.1350
Gaia Collaboration . 2020, VizieR Online Data Catalog, I/350, 10.26093/cds/vizier.1350
2020 doi
-
[49]
1973, , 78, 769, 10.1086/111480
Gatewood , G., & Eichhorn , H. 1973, , 78, 769, 10.1086/111480
1973 doi
-
[50]
Gelman, A., & Rubin, D. B. 1992, Statistical science, 7, 457
1992
-
[51]
1972, The Analysis of Tides (University of Toronto Press)
Godin, G. 1972, The Analysis of Tides (University of Toronto Press)
1972
-
[52]
I., Su \'a rez Mascare \ n o , A., Silva , A
Gonz \'a lez Hern \'a ndez , J. I., Su \'a rez Mascare \ n o , A., Silva , A. M., et al. 2024, , 690, A79, 10.1051/0004-6361/202451311
2024 doi
-
[53]
Gregory , P. C. 2016, , 458, 2604, 10.1093/mnras/stw147
2016 doi
-
[54]
C., & Fischer , D
Gregory , P. C., & Fischer , D. A. 2010, , 403, 731, 10.1111/j.1365-2966.2009.16233.x
2010
-
[55]
C., Bou \'e , G., Laskar , J., & Correia , A
Hara , N. C., Bou \'e , G., Laskar , J., & Correia , A. C. M. 2017, , 464, 1220, 10.1093/mnras/stw2261
2017 doi
-
[56]
Harris, F. J. 1978, Proceedings of the IEEE, 66, 51
1978
-
[57]
P., Endl , M., Cochran , W
Hatzes , A. P., Endl , M., Cochran , W. D., et al. 2018, , 155, 120, 10.3847/1538-3881/aaa8e1
2018 doi
-
[58]
D., Collier Cameron , A., Queloz , D., et al
Haywood , R. D., Collier Cameron , A., Queloz , D., et al. 2014, , 443, 2517, 10.1093/mnras/stu1320
2014 doi
- [59]
-
[60]
S., Yoma , N
Jenkins , J. S., Yoma , N. B., Rojo , P., Mahu , R., & Wuth , J. 2014, , 441, 2253, 10.1093/mnras/stu683
2014 doi
-
[61]
R., Thirumalachari , B., Henry , G
Kane , S. R., Thirumalachari , B., Henry , G. W., et al. 2016, , 820, L5, 10.3847/2041-8205/820/1/L5
2016 doi
-
[62]
I., Gulvanskii, V
Kaplun, D. I., Gulvanskii, V. V., Minenkov, D. V., & Kanatov, I. I. 2023, in 2023 Seminar on Signal Processing, 32--35, 10.1109/IEEECONF60473.2023.10366088
2023
-
[63]
2006, , 371, 1390, 10.1111/j.1365-2966.2006.10762.x
Koen , C. 2006, , 371, 1390, 10.1111/j.1365-2966.2006.10762.x
2006
- [64]
-
[65]
2019, Journal of Open Source Software, 4, 1143, 10.21105/joss.01143
Kumar, R., Carroll, C., Hartikainen, A., & Martin, O. 2019, Journal of Open Source Software, 4, 1143, 10.21105/joss.01143
2019 doi
-
[66]
2003, , 403, 1077, 10.1051/0004-6361:20030396
K \"u rster , M., Endl , M., Rouesnel , F., et al. 2003, , 403, 1077, 10.1051/0004-6361:20030396
2003 doi
-
[67]
2012, Numerical ecology (Elsevier)
Legendre, P., & Legendre, L. 2012, Numerical ecology (Elsevier)
2012
-
[68]
Lightkurve Collaboration , Cardoso , J. V. d. M., Hedges , C., et al. 2018, Lightkurve: Kepler and TESS time series analysis in Python , Astrophysics Source Code Library. 1812.013
2018
-
[69]
Lomb , N. R. 1976, , 39, 447, 10.1007/BF00648343
1976 doi
-
[70]
L \'o pez-Morales , M., Triaud , A. H. M. J., Rodler , F., et al. 2014, , 792, L31, 10.1088/2041-8205/792/2/L31
2014 doi
- [71]
-
[72]
2021, , 162, 61, 10.3847/1538-3881/ac0057
Lubin , J., Robertson , P., Stefansson , G., et al. 2021, , 162, 61, 10.3847/1538-3881/ac0057
2021 doi
-
[73]
H., Allain, D
Lyard, F. H., Allain, D. J., Cancet, M., Carrère, L., & Picot, N. 2021, Ocean Science, 17, 615, 10.5194/os-17-615-2021
2021 doi
-
[74]
W., Butler , R
Marcy , G. W., Butler , R. P., Fischer , D. A., et al. 2002, , 581, 1375, 10.1086/344298
2002 doi
-
[75]
W., Butler , R
Marcy , G. W., Butler , R. P., Vogt , S. S., et al. 2005, , 619, 570, 10.1086/426384
2005 doi
-
[76]
E., Endl , M., Cochran , W
McArthur , B. E., Endl , M., Cochran , W. D., et al. 2004, , 614, L81, 10.1086/425561
2004 doi
-
[77]
S., et al
Meschiari , S., Laughlin , G., Vogt , S. S., et al. 2011, , 727, 117, 10.1088/0004-637X/727/2/117
2011 doi
-
[78]
1999, Delta Scuti Star Newsletter, vol
Montgomery, M., & O'donoghue, D. 1999, Delta Scuti Star Newsletter, vol. 13, p. 28, 13, 28
1999
-
[79]
2015, arXiv preprint arXiv:1510.03924
Moritz, S., Sard \'a , A., Bartz-Beielstein, T., Zaefferer, M., & Stork, J. 2015, arXiv preprint arXiv:1510.03924
2015 arXiv
-
[80]
2017, , 601, A110, 10.1051/0004-6361/201630201
Mortier , A., & Collier Cameron , A. 2017, , 601, A110, 10.1051/0004-6361/201630201
2017 doi
-
[81]
P., Correia , C
Mortier , A., Faria , J. P., Correia , C. M., Santerne , A., & Santos , N. C. 2015, , 573, A101, 10.1051/0004-6361/201424908
2015 doi
-
[82]
L., et al
Naef , D., Mayor , M., Beuzit , J. L., et al. 2004, , 414, 351, 10.1051/0004-6361:20034091
2004 doi
-
[83]
1995, Modern spectrum analysis of time series (CRC Press, Boca Raton)
Naidu, P. 1995, Modern spectrum analysis of time series (CRC Press, Boca Raton)
1995
-
[84]
E., Ford , E
Nelson , B. E., Ford , E. B., Wright , J. T., et al. 2014, , 441, 442, 10.1093/mnras/stu450
2014 doi
-
[85]
J., Tinney , C
O'Toole , S. J., Tinney , C. G., Jones , H. R. A., et al. 2009, , 392, 641, 10.1111/j.1365-2966.2008.14051.x
2009
-
[86]
2020, , 905, 67, 10.3847/1538-4357/abc250
Pan , Y., Fu , J.-N., Zong , W., et al. 2020, , 905, 67, 10.3847/1538-4357/abc250
2020 doi
-
[87]
2021, , 645, A96, 10.1051/0004-6361/202038306
Pepe , F., Cristiani , S., Rebolo , R., et al. 2021, , 645, A96, 10.1051/0004-6361/202038306
2021 doi
-
[88]
H., Flannery , B
Press , W. H., Flannery , B. P., Teukolsky , S. A., Vetterling , W. T., & Gould , H. 1987, American Journal of Physics, 55, 90, 10.1119/1.14981
1987 doi
-
[89]
A., Reece , S., & Roberts , S
Rajpaul , V., Aigrain , S., Osborne , M. A., Reece , S., & Roberts , S. 2015, , 452, 2269, 10.1093/mnras/stv1428
2015 doi
-
[90]
2023, The Rayleigh Criterion: Resolution Limits of Astronomical Periodograms, Zenodo, 10.5281/ZENODO.10039084
Ramirez Delgado, V. 2023, The Rayleigh Criterion: Resolution Limits of Astronomical Periodograms, Zenodo, 10.5281/ZENODO.10039084
2023 doi
- [91]
-
[92]
1879, The London, Edinburgh, and Dublin Philosophical Magazine and Journal of Science, 8, 261
Rayleigh, L. 1879, The London, Edinburgh, and Dublin Philosophical Magazine and Journal of Science, 8, 261
-
[93]
2015, , 583, A65, 10.1051/0004-6361/201526216
Reinhold , T., & Gizon , L. 2015, , 583, A65, 10.1051/0004-6361/201526216
2015 doi
-
[94]
2013, Astronomy & Astrophysics, 560, A4, 10.1051/0004-6361/201321970
Reinhold, T., Reiners, A., & Basri, G. 2013, Astronomy & Astrophysics, 560, A4, 10.1051/0004-6361/201321970
2013 doi
-
[95]
2018, , 563, 365, 10.1038/s41586-018-0677-y
Ribas , I., Tuomi , M., Reiners , A., et al. 2018, , 563, 365, 10.1038/s41586-018-0677-y
2018 doi
-
[96]
L., S \'e gransan , D., Marmier , M., et al
Rickman , E. L., S \'e gransan , D., Marmier , M., et al. 2019, , 625, A71, 10.1051/0004-6361/201935356
2019 doi
-
[97]
J., Fulton, B
Rosenthal, L. J., Fulton, B. J., Hirsch, L. A., et al. 2021, The Astrophysical Journal Supplement Series, 255, 8, 10.3847/1538-4365/abe23c
2021 doi
-
[98]
Scargle , J. D. 1982, , 263, 835, 10.1086/160554
1982 doi
-
[99]
1898, Terrestrial Magnetism, 3, 13
Schuster, A. 1898, Terrestrial Magnetism, 3, 13
-
[100]
1991, , 253, 198, 10.1093/mnras/253.2.198
Schwarzenberg-Czerny , A. 1991, , 253, 198, 10.1093/mnras/253.2.198
1991 doi
-
[101]
H., & Stoffer, D
Shumway, R. H., & Stoffer, D. S. 2001, Time Series Analysis and Its Applications, 4th edn. (New York: Springer)
2001
-
[102]
Smith, J. O. 2011, Spectral audio signal processing (W3K)
2011
-
[103]
2023, , 678, A90, 10.1051/0004-6361/202346887
Stalport , M., Cretignier , M., Udry , S., et al. 2023, , 678, A90, 10.1051/0004-6361/202346887
2023 doi
-
[104]
2022, in Society of Photo-Optical Instrumentation Engineers (SPIE) Conference Series, Vol
Stotesbury , I., Edwards , B., Lavigne , J.-F., et al. 2022, in Society of Photo-Optical Instrumentation Engineers (SPIE) Conference Series, Vol. 12180, Space Telescopes and Instrumentation 2022: Optical, Infrared, and Millimeter Wave, ed. L. E. Coyle , S. Matsuura , & M. D. P...
2022 doi
-
[105]
R., et al
Su \'a rez Mascare \ n o , A., Gonz \'a lez- \'A lvarez , E., Zapatero Osorio , M. R., et al. 2023, , 670, A5, 10.1051/0004-6361/202244991
2023 doi
-
[106]
J., Lanzerotti, L
Thomson, D. J., Lanzerotti, L. J., Vernon, F. L., Lessard, M. R., & Smith, L. T. P. 2007, Proceedings of the IEEE, 95, 1085
2007
- [107]
-
[108]
2018, Experimental Astronomy, 46, 135, 10.1007/s10686-018-9598-x
Tinetti, G., Drossart, P., Eccleston, P., et al. 2018, Experimental Astronomy, 46, 135, 10.1007/s10686-018-9598-x
2018 doi
-
[109]
Tuomi , M., Jones , H. R. A., Jenkins , J. S., et al. 2013, , 551, A79, 10.1051/0004-6361/201220509
2013 doi
- [110]
- [111]
- [112]
-
[113]
1982, Vistas in Astronomy, 26, 141, 10.1016/0083-6656(82)90004-6
---. 1982, Vistas in Astronomy, 26, 141, 10.1016/0083-6656(82)90004-6
1982 doi
-
[114]
A., et al
Vanderburg , A., Plavchan , P., Johnson , J. A., et al. 2016, , 459, 3565, 10.1093/mnras/stw863
2016 doi
-
[115]
VanderPlas , J. T. 2018, , 236, 16, 10.3847/1538-4365/aab766
2018 doi
-
[116]
2021, Bayesian analysis, 16, 667
Vehtari, A., Gelman, A., Simpson, D., Carpenter, B., & B \"u rkner, P.-C. 2021, Bayesian analysis, 16, 667
2021
-
[117]
2013, Astronomy and Computing, 1, 5, 10.1016/j.ascom.2012.12.001
Vio , R., Diaz-Trigo , M., & Andreani , P. 2013, Astronomy and Computing, 1, 5, 10.1016/j.ascom.2012.12.001
2013 doi
-
[118]
1971, Biometrika, 58, 21
Walker, A. 1971, Biometrika, 58, 21
1971
-
[119]
1967, IEEE Transactions on Audio and Electroacoustics, AU-15, 70
Welch, P. 1967, IEEE Transactions on Audio and Electroacoustics, AU-15, 70
1967
-
[120]
A., Clark , J
Wittenmyer , R. A., Clark , J. T., Zhao , J., et al. 2019, , 484, 5859, 10.1093/mnras/stz290
2019 doi
-
[121]
Wright , J. T. 2004, , 128, 1273, 10.1086/423221
2004 doi
-
[122]
F., H \'e brard , E
Yu , L., Donati , J. F., H \'e brard , E. M., et al. 2017, , 467, 1342, 10.1093/mnras/stx009
2017 doi
-
[123]
2009, , 496, 577, 10.1051/0004-6361:200811296
Zechmeister , M., & K \"u rster , M. 2009, , 496, 577, 10.1051/0004-6361:200811296
2009 doi
Reviewed August 6, 2026 · model on record in the stance chip above.
Discussion (0). Continue with ORCID to comment.