REVIEW 3 major objections 5 minor 36 references
DeltaSHAP: Explaining Prediction Evolutions in Online Patient Monitoring with Shapley Values
T0 review · 3 major / 5 minor · reviewed 2026-08-06 · deepseek-v4-flash
Pith's one-line read DeltaSHAP decomposes the change in a patient-monitoring risk score into signed contributions from the newest measurements, and reports large faithfulness and speed gains over prior time-series XAI on critical-care benchmarks.
desk verdict A clean practical XAI method for the newest time step, but the headline faithfulness gain is largely an artifact of using the same forward-fill perturbation in both the value function and the evaluation metrics. read the letter →
The pith
A machine-rendered reading of the paper's core claim, the machinery that carries it, and where it could break.
The reading
What carries the argument
The load-bearing machinery is a Shapley-value game over the current time step's observed features, in which a coalition's value is how much seeing that subset of the newest measurements moves the risk prediction relative to the no-new-information baseline. Permutation sampling approximates the Shapley values with $N$ sampled orderings instead of $2^D$ coalitions, and a final rescaling enforces the efficiency property $\sum_{j\in F_{\text{obs}}}\phi_j = \Delta$ exactly. The other half is baseline selection: unobserved features at time $T$ are filled by forward-filling, the same missing-value rule already used in LSTM-based preprocessing, so counterfactual evaluations stay in the training distribution and no generative imputation model is needed.
What would settle it
Run an LSTM monitoring model on a set of patient traces and compare DeltaSHAP's baseline difference $\Delta = f(X_{T-W+1:T}) - f(X_{T-W+1:T}\setminus X_T)$ against the literal consecutive prediction gap $f(X_{T-W+1:T}) - f(X_{T-W:T-1})$. If the two disagree systematically whenever measurements change quickly, then the attributed quantity is not the consecutive prediction evolution, and a time-shifted counterfactual is required.
Extended reading notes
Core claim
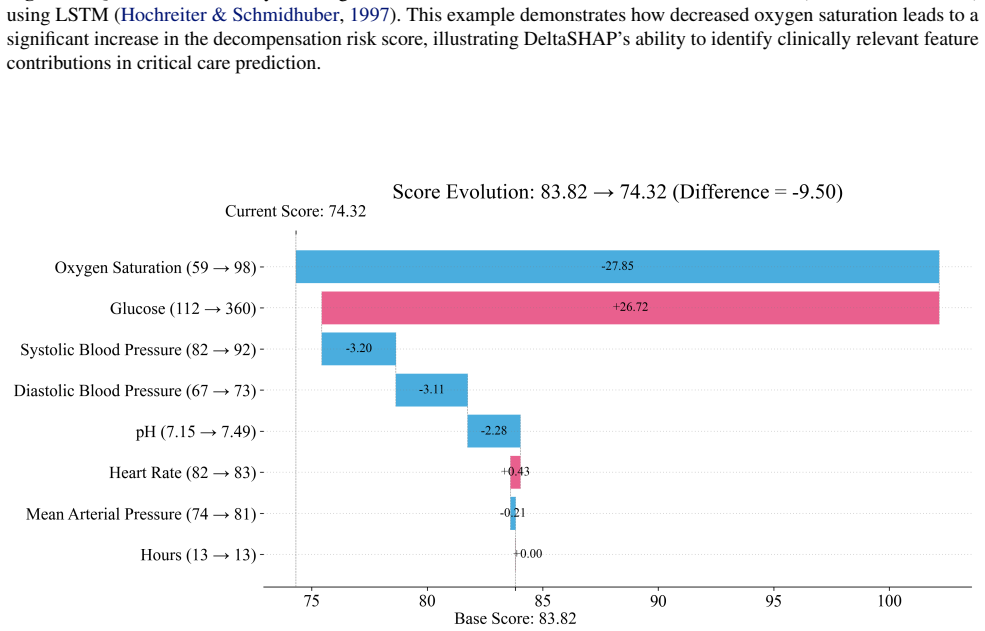
DeltaSHAP's central claim is that a prediction change in a sliding-window monitoring model can be attributed entirely to the features observed at the most recent time step. For a window $X_{T-W+1:T}$, the evolution is $\Delta = f(X_{T-W+1:T}) - f(X_{T-W+1:T}\setminus X_T)$, where the second term evaluates the same window with the newest row treated as unobserved and filled by the preprocessing's missing-value rule. The paper defines a coalition game on the features present at time $T$, with value $v(S) = f(X_{T-W+1:T-1}\cup X_T^S) - f(X_{T-W+1:T}\setminus X_T)$, and takes the Shapley value--a fair division of a cooperative game's payoff among players--of each feature in that game as its attribution. A permutation-sampling approximation, restricted to actually observed features and rescaled so that $\sum_{j\in F_{\text{obs}}}\phi_j = \Delta$, makes the computation linear in the number of permutations rather than exponential in the feature count. Because the baseline matches the preprocessing the model already uses, the counterfactual evaluations stay in distribution; the paper's experiments on decompensation and sepsis prediction tasks then report that the attributions are both more faithful and faster than prior methods.
Load-bearing premise
The paper treats the scenario where the newest measurements are replaced by last-known values as the prediction the model would have made before seeing them, even though the sliding window has shifted. If this replacement does not stand in for 'no new information,' the quantity being explained is not truly the consecutive prediction evolution.
Editorial extensions
If this is right
- A bedside system can present a risk-score jump as a short signed list of which newly measured vitals or labs are responsible, with the list summing exactly to the jump.
- Because only the newest window row is explained, the per-step cost scales with the observed feature count and the number of sampled permutations, making real-time explanation feasible on standard hardware.
- The new area-based faithfulness metrics give online prediction settings a common yardstick that treats deleting top-ranked versus bottom-ranked features asymmetrically, avoiding cancellation from mixed-sign attributions.
- If the reported benchmark results hold, removing DeltaSHAP's top-ranked features should degrade risk-stratification performance more, and removing its bottom-ranked features less, than with prior methods on the same LSTM models.
Reading between the lines
- The same decomposition could be applied to any sliding-window predictor, not just clinical LSTMs; whether the speed advantage survives on attention-based models is a direct testable extension.
- Because the method explains only the last time step, it may under-credit delayed effects of earlier measurements; combining DeltaSHAP with lag-aware attribution across windows would address the paper's stated limitation about missed delayed effects.
- The reported faithfulness gains could partly reflect that the evaluation removes features using the same forward-fill substitution the method itself uses; an independent check would remove features by masking them in the raw input stream rather than through the preprocessing fill.
- A stricter 'consecutive prediction' explanation would use the previous window's prediction as the reference point; DeltaSHAP's reference is the current window without the newest row, so it explains the informational contribution of the newest measurements rather than the full time-step transition.
Editorial analysis
A structured set of objections, weighed in public.
Referee Report
Summary. The paper proposes DeltaSHAP, an XAI method for online patient monitoring that attributes the prediction difference Δ = f(X_{T-W+1:T}) − f(X_{T-W+1:T}\X_T) to the features observed at the most recent time step T, using Shapley-value sampling with forward-filling as the baseline for unobserved features. The authors introduce new evaluation metrics (AUPD, AUPP, AUAUCD, AUAPRD, AUAUCP, AUAPRP) that measure prediction, AUC, and APR changes when removing the most or least salient features, and report that DeltaSHAP outperforms existing XAI methods on MIMIC-III and PhysioNet 2019 benchmarks in both faithfulness (up to 62% improvement) and speed (about 0.02 seconds per batch). The paper also includes an ablation study and qualitative clinical case studies.
Significance. If the explanatory target is properly validated, DeltaSHAP would be a valuable contribution: it is model-agnostic, provides signed directional attributions, avoids costly generative baselines, and ships code that plausibly reproduces the experiments. The Shapley sampling and the efficiency-preserving normalization in Eq. (2) are mathematically standard, and the ablation study cleanly isolates the forward-fill baseline choice. However, the central claim that DeltaSHAP explains prediction evolutions between consecutive time steps relies on an unverified equivalence between the forward-filled counterfactual and the previous sliding-window prediction, and the reported faithfulness gains are entangled with the fact that the evaluation metrics use exactly the same forward-fill operation as the method's value function. These issues are load-bearing for the paper's headline claims.
major comments (3)
- [Section 3.1 and Section 4.1] The paper repeatedly states that Δ = f(X_{T-W+1:T}) − f(X_{T-W+1:T}\X_T) is the prediction change between consecutive time steps T−1 and T, but the second term is not the previous prediction. The previous sliding-window prediction is f(X_{T-W:T−1}), which differs from the forward-filled counterfactual because the window shifts. The paper provides no empirical check that f(X_{T-W+1:T}\X_T) ≈ f(X_{T-W:T−1}) on the deployed models; if the forward-fill does not adequately emulate 'no new information', then the attributions are not explaining the claimed evolution. Please either reframe the objective as explaining a specific counterfactual difference (with the baseline defined exactly as implemented) or add a validation study quantifying the gap between the forward-filled counterfactual and the actual previous window prediction.
- [Section 5.1 and Table 1] The faithfulness metrics AUPD, AUPP, AUAUCD, AUAPRD, AUAUCP, and AUAPRP remove features by replacing their value at the last time step with the forward-filled value from the previous time step. This is precisely the missing-data operation used to construct DeltaSHAP's value function v(S) in Section 3.2 and Algorithm 1. Consequently, DeltaSHAP's feature rankings are calibrated to maximize prediction change under exactly the perturbation the metrics measure, while competing methods (IG, LIME, FIT, WinIT) use different baselines or gradient definitions and are not optimized for this perturbation. The reported gains, e.g., AUPD 22.59 vs. 13.46 for IG on MIMIC-III, are therefore partly a metric–baseline alignment artifact and do not independently establish superior faithfulness. Please evaluate with at least one hold-out perturbation (e.g., zero-imputation or deletion of the time step) or with metrics that reference the actual previous-window prediction, and report the results separately.
- [Section 5.1, definitions of CPD/CPP and AUPD/AUPP] The metric definitions are internally unusual. CPD(f,X,K) is defined as a sum of absolute prediction changes over k=0..K−1, and AUPD is then defined as (1/K) Σ_{k=1}^K CPD(f,X,k). This makes AUPD a cumulative sum of cumulative sums rather than an area under a prediction-change curve, which complicates interpretation of the reported magnitudes and the claim that AUPD 'assesses attribution ordering better'. Please clarify the curve whose area is being computed, or replace these with standard area-under-curve definitions that integrate the prediction profile after removing k features.
minor comments (5)
- [Section 2] There is a typo in 'KernalSHAP' (should be 'KernelSHAP'), and in the Related Work section the phrase 'condition generative models' should read 'conditional generative models'.
- [References] In the reference for Tonekaboni et al., 'Neural Ifnformation Processing Systems' should be 'Neural Information Processing Systems'.
- [Section 5.1, implementation details] The adaptive removal formula for the least-salient features uses 'D − Fobs' (the number of missing features) plus '⌈p·Fobs⌉'; it would be clearer to define 'Fobs' and 'D' precisely here, since the same symbols are used for the total feature set in Section 3.2.
- [Abstract and Section 5.2] The headline '62% improvement' is not clearly derived from the tables; improvements vary across metrics and datasets (e.g., AUPD on MIMIC shows roughly 68% over IG, while on PhysioNet the gain is roughly 57%). Please state explicitly which metric and comparison the 62% figure refers to.
- [Section 5.4, Table 2] The rows 'w/o Norm.' and 'DeltaSHAP' appear to have identical AUPD and AUAUCD values (22.58 and 397.88), which may be a typo; please confirm the normalization indeed has no effect on these metrics, since the text says it does not alter rankings.
Circularity Check
Faithfulness benchmark is aligned with DeltaSHAP's own forward-fill value function, making the 62% gain partly a metric–method artifact.
-
self definitional
[§5.1 Evaluation metrics and Table 1 caption; §4.3 Baseline Selection; §3.2 value function v(S)]
"where X ↑ k and X ↓ k are derived by removing the top-k and bottom-k features (by absolute attribution) at the final time step T ... We evaluate by removing the most or least salient 25% of the features per time step with forward fill substitution. ... we utilize forward-filling, where missing values are imputed using the most recent observed value."
DeltaSHAP's value function v(S) evaluates f on windows where unobserved features at time T are forward-filled (§4.3), so its Shapley values measure marginal prediction impact under forward-fill substitution. The AUPD/AUPP faithfulness metrics remove top/bottom features 'at the final time step T' and, per the Table 1 caption, use exactly the same 'forward fill substitution.' The method is thus ranked by how well its attributions predict prediction changes under the same perturbation that defines the attributions. The ablation makes the alignment explicit: replacing forward-fill with zero-filling ('w/o BS') collapses AUPD from 22.58 to 8.49 on MIMIC-III, showing the metric rewards the chosen baseline.
full rationale
The core decomposition is not circular: DeltaSHAP defines Δ and v(S) explicitly, approximates Shapley values by permutation sampling, and normalizes to enforce efficiency; no fitted parameter encodes the benchmark answer. The circularity lies in the empirical validation. The proposed AUPD/AUPP/AUAUCD/AUAPRD metrics remove features at the final time step with forward-fill substitution, which is precisely the missing-value operation used to build v(S) and select the baseline (Section 4.3). Consequently, DeltaSHAP is optimized, by construction of its value function, for the exact perturbation the metric applies; the ablation (w/o BS: 8.49 vs 22.58 AUPD) confirms that the gain is driven by baseline choice. Competing methods use different counterfactuals and are therefore measured under a perturbation they were not designed for. The CPD/CPP metrics are attributed to Jang et al. (2025), a prior paper sharing two authors; this self-citation is not load-bearing because the metric definitions are fully stated in the text. Separately, the paper's interpretation of Δ as 'prediction evolution between consecutive time steps' assumes forward-filled f(X_{T-W+1:T}\X_T) approximates the previous sliding-window prediction; that is a validity/correctness concern, not a circularity. Overall, partial circularity in the central faithfulness claim warrants a 6.
Assumptions & free parameters
free parameters (2)
- N =
25
- p =
0.25
assumptions (4)
- standard math Shapley value sampling gives an unbiased approximation of exact Shapley values.
- domain assumption Forward-filling the current time step produces a valid counterfactual for 'unobserved current measurements'.
- domain assumption Features not observed at the final time step have zero attribution, and all relevant signal for the prediction change is in the final step.
- ad hoc to paper Removing the most or least attributed features and measuring prediction or AUC changes is a valid test of attribution faithfulness.
Cite this review
Pith. "Pith review of DeltaSHAP: Explaining Prediction Evolutions in Online Patient Monitoring with Shapley Values." pith.science (2026). https://pith.science/paper/MEWONXBK
@misc{pith2026250702342,
  author       = {Pith},
  title        = {Pith review of: DeltaSHAP: Explaining Prediction Evolutions in Online Patient Monitoring with Shapley Values},
  year         = {2026},
  howpublished = {\url{https://pith.science/paper/MEWONXBK}},
  note         = {Machine review of arXiv:2507.02342}
}
read the original abstract
This study proposes DeltaSHAP, a novel explainable artificial intelligence (XAI) algorithm specifically designed for online patient monitoring systems. In clinical environments, discovering the causes driving patient risk evolution is critical for timely intervention, yet existing XAI methods fail to address the unique requirements of clinical time series explanation tasks. To this end, DeltaSHAP addresses three key clinical needs: explaining the changes in the consecutive predictions rather than isolated prediction scores, providing both magnitude and direction of feature attributions, and delivering these insights in real time. By adapting Shapley values to temporal settings, our approach accurately captures feature coalition effects. It further attributes prediction changes using only the actually observed feature combinations, making it efficient and practical for time-sensitive clinical applications. We also introduce new evaluation metrics to evaluate the faithfulness of the attributions for online time series, and demonstrate through experiments on online patient monitoring tasks that DeltaSHAP outperforms state-of-the-art XAI methods in both explanation quality as 62% and computational efficiency as 33% time reduction on the MIMIC-III decompensation benchmark. We release our code at https://github.com/AITRICS/DeltaSHAP.
Figures


Figures from the paper (5 more)


Reference graph
Works this paper leans on
-
[1]
write newline
" write newline "" before.all 'output.state := FUNCTION n.dashify 't := "" t empty not t #1 #1 substring "-" = t #1 #2 substring "--" = not "--" * t #2 global.max substring 't := t #1 #1 substring "-" = "-" * t #2 global.max substring 't := while if t #1 #1 substring * t #2 global.max substring 't := if while FUNCTION format.date year duplicate empty "emp...
-
[2]
A., Eckert, C., and Teredesai, A
Ahmad, M. A., Eckert, C., and Teredesai, A. Interpretable machine learning in healthcare. In IEEE International Conference on Healthcare Informatics (ICHI), 2018
work page 2018
-
[3]
Bento, J., Saleiro, P., Cruz, A. F., Figueiredo, M. A., and Bizarro, P. Timeshap: Explaining recurrent models through sequence perturbations. In ACM SIGKDD International Conference on Knowledge Discovery and Data Mining (KDD), 2021
work page 2021
-
[4]
Recurrent neural networks for multivariate time series with missing values
Che, Z., Purushotham, S., Cho, K., Sontag, D., and Liu, Y. Recurrent neural networks for multivariate time series with missing values. Scientific Reports, 2018
work page 2018
-
[5]
Interpretable machine learning: A guide for making black box models explainable
Christoph, M. Interpretable machine learning: A guide for making black box models explainable. Leanpub, 2020
work page 2020
-
[6]
Churpek, M. M., Yuen, T. C., Winslow, C., Meltzer, D. O., Kattan, M. W., and Edelson, D. P. Multicenter comparison of machine learning methods and conventional regression for predicting clinical deterioration on the wards. Critical Care Medicine, 2016
work page 2016
-
[7]
Crabb \'e , J. and Van Der Schaar, M. Explaining time series predictions with dynamic masks. In International Conference on Machine Learning (ICML), 2021
work page 2021
-
[8]
Das, A. and Rad, P. Opportunities and challenges in explainable artificial intelligence (xai): A survey. arXiv preprint arXiv:2006.11371, 2020
arXiv 2006
Show all 36 references
-
[9]
Learning perturbations to explain time series predictions
Enguehard, J. Learning perturbations to explain time series predictions. In International Conference on Machine Learning (ICML), 2023
2023
-
[10]
D., Linn, W
Farnett, L., Mulrow, C. D., Linn, W. D., Lucey, C. R., and Tuley, M. R. The j-curve phenomenon and the treatment of hypertension: is there a point beyond which pressure reduction is dangerous? Jama, 1991
1991
-
[11]
and Schmidhuber, J
Hochreiter, S. and Schmidhuber, J. Long short-term memory. Neural computation, 1997
1997
-
[12]
Set functions for time series
Horn, M., Moor, M., Bock, C., Rieck, B., and Borgwardt, K. Set functions for time series. In International Conference on Machine Learning (ICML), 2020
2020
-
[13]
TIMING: Temporality-Aware Integrated Gradients for Time Series Explanation
Jang, H., Kim, C., and Yang, E. TIMING: Temporality-Aware Integrated Gradients for Time Series Explanation . In International Conference on Machine Learning (ICML), 2025
2025
-
[14]
E., Pollard, T
Johnson, A. E., Pollard, T. J., Shen, L., Lehman, L.-w. H., Feng, M., Ghassemi, M., Moody, B., Szolovits, P., Anthony Celi, L., and Mark, R. G. Mimic-iii, a freely accessible critical care database. Scientific Data, 2016
2016
-
[15]
M., Cedars, A
Joseph, S. M., Cedars, A. M., Ewald, G. A., Geltman, E. M., and Mann, D. L. Acute decompensated heart failure: contemporary medical management. Texas Heart Institute Journal, 2009
2009
-
[16]
Association between elevated blood glucose level on admission and long-term mortality in patients with acute decompensated heart failure
Kattel, S., Kasai, T., Matsumoto, H., Yatsu, S., Murata, A., Kato, T., Suda, S., Hiki, M., Takagi, A., and Daida, H. Association between elevated blood glucose level on admission and long-term mortality in patients with acute decompensated heart failure. Journal of Cardiology,...
2017
-
[17]
Captum: A unified and generic model interpretability library for pytorch
Kokhlikyan, N., Miglani, V., Martin, M., Wang, E., Alsallakh, B., Reynolds, J., Melnikov, A., Kliushkina, N., Araya, C., Yan, S., et al. Captum: A unified and generic model interpretability library for pytorch. arXiv preprint arXiv:2009.07896, 2020
2009 arXiv
-
[18]
K., Rooke, C., Smith, J., Zuberi, S., and Volkovs, M
Leung, K. K., Rooke, C., Smith, J., Zuberi, S., and Volkovs, M. Temporal dependencies in feature importance for time series predictions. In International Conference on Learning Representations (ICLR), 2021
2021
-
[19]
Timex++: Learning time-series explanations with information bottleneck
Liu, Z., Wang, T., Shi, J., Zheng, X., Chen, Z., Song, L., Dong, W., Obeysekera, J., Shirani, F., and Luo, D. Timex++: Learning time-series explanations with information bottleneck. In International Conference on Machine Learning (ICML), 2024 a
2024
-
[20]
Explaining time series via contrastive and locally sparse perturbations
Liu, Z., Zhang, Y., Wang, T., Wang, Z., Luo, D., Du, M., Wu, M., Wang, Y., Chen, C., Fan, L., et al. Explaining time series via contrastive and locally sparse perturbations. In International Conference on Learning Representations (ICLR), 2024 b
2024
-
[21]
A unified approach to interpreting model predictions
Lundberg, S. A unified approach to interpreting model predictions. In Conference on Neural Information Processing Systems (NeurIPS), 2017
2017
-
[22]
Sampling permutations for shapley value estimation
Mitchell, R., Cooper, J., Frank, E., and Holmes, G. Sampling permutations for shapley value estimation. Journal of Machine Learning Research (JMLR), 2022
2022
-
[23]
Encoding time-series explanations through self-supervised model behavior consistency
Queen, O., Hartvigsen, T., Koker, T., He, H., Tsiligkaridis, T., and Zitnik, M. Encoding time-series explanations through self-supervised model behavior consistency. Conference on Neural Information Processing Systems (NeurIPS), 2024
2024
-
[24]
M., Hajaj, N., Hardt, M., Liu, P
Rajkomar, A., Oren, E., Chen, K., Dai, A. M., Hajaj, N., Hardt, M., Liu, P. J., Liu, X., Marcus, J., Sun, M., et al. Scalable and accurate deep learning with electronic health records. NPJ Digital Medicine, 2018
2018
-
[25]
A., Josef, C
Reyna, M. A., Josef, C. S., Jeter, R., Shashikumar, S. P., Westover, M. B., Nemati, S., Clifford, G. D., and Sharma, A. Early prediction of sepsis from clinical data: the physionet/computing in cardiology challenge 2019. Critical Care Medicine, 2020
2019
-
[26]
T., Singh, S., and Guestrin, C
Ribeiro, M. T., Singh, S., and Guestrin, C. ``why should i trust you?'' explaining the predictions of any classifier. In ACM SIGKDD International Conference on Knowledge Discovery and Data Mining (KDD), 2016
2016
-
[27]
J., Rothman, S
Rothman, M. J., Rothman, S. I., and Beals IV, J. Development and validation of a continuous measure of patient condition using the electronic medical record. Journal of Biomedical Informatics, 2013
2013
-
[28]
Shapley, L. S. A value for n-person games. In Contributions to the Theory of Games, Volume II. Princeton University Press, 1953
1953
-
[29]
Learning important features through propagating activation differences
Shrikumar, A., Greenside, P., and Kundaje, A. Learning important features through propagating activation differences. In International Conference on Machine Learning (ICML), 2017
2017
-
[30]
Shukla, S. N. and Marlin, B. M. Multi-time attention networks for irregularly sampled time series. In International Conference on Learning Representations (ICLR), 2021
2021
-
[31]
S., Seymour, C
Singer, M., Deutschman, C. S., Seymour, C. W., Shankar-Hari, M., Annane, D., Bauer, M., Bellomo, R., Bernard, G. R., Chiche, J.-D., Coopersmith, C. M., et al. The third international consensus definitions for sepsis and septic shock (sepsis-3). Jama, 2016
2016
-
[32]
and Kononenko, I
Strumbelj, E. and Kononenko, I. An efficient explanation of individual classifications using game theory. Journal of Machine Learning Research (JMLR), 2010
2010
-
[33]
Axiomatic attribution for deep networks
Sundararajan, M., Taly, A., and Yan, Q. Axiomatic attribution for deep networks. In International Conference on Machine Learning (ICML), 2017
2017
-
[34]
A., Szolovits, P., and Ghassemi, M
Suresh, H., Hunt, N., Johnson, A., Celi, L. A., Szolovits, P., and Ghassemi, M. Clinical intervention prediction and understanding using deep networks. Machine Learning for Healthcare Conference (MLHC), 2017
2017
-
[35]
and Reddy, C
Tipirneni, S. and Reddy, C. K. Self-supervised transformer for sparse and irregularly sampled multivariate clinical time-series. ACM Transactions on Knowledge Discovery from Data (TKDD), 2022
2022
-
[36]
K., and Goldenberg, A
Tonekaboni, S., Joshi, S., Campbell, K., Duvenaud, D. K., and Goldenberg, A. What went wrong and when? instance-wise feature importance for time-series black-box models. Conference on Neural Ifnformation Processing Systems (NeurIPS), 2020
2020
Reviewed August 6, 2026 · model on record in the stance chip above.
Discussion (0). Sign in to comment.