REVIEW 4 major objections 5 minor 64 references
An Explainable Transformer Model for Alzheimer's Disease Detection Using Retinal Imaging
T0 review · 4 major / 5 minor · reviewed 2026-08-06 · deepseek-v4-flash
Pith's one-line read A compact transformer called Retformer, trained from scratch on retinal images, classifies Alzheimer's disease with 92% accuracy on OCT scans and 94% on fundus images, outperforming CNNs and a retinal foundation model by up to 11…
desk verdict A sensible small-data transformer architecture undermined by slice-level leakage and non-blind hyperparameter selection; the headline accuracy claims don't hold as stated. read the letter →
The pith
A machine-rendered reading of the paper's core claim, the machinery that carries it, and where it could break.
The reading
What carries the argument
The central object is the Retformer encoder-only transformer. It converts an image into patches through a CNN, adds non-learnable rotary position embeddings (RoPE), passes the sequence through transformer layers that use grouped-query attention (GQA), SwiGLU activations, layer normalization, and two residual connections, and ends in an MLP classifier head. Every choice is aimed at lowering the number of trainable parameters so the model can be trained from scratch on small retinal datasets; the paper's ablation shows the first residual connection, RoPE, and the CNN patch encoder matter most. The explanatory machinery is Grad-CAM, which weights the penultimate feature map by class-specific gradients to produce the localization maps that link model decisions to retinal anatomy.
What would settle it
A concrete test: re-run the OCT comparison with patient-level nested cross-validation, where all slices from a given patient are assigned to the same fold, and report the mean and standard deviation of per-patient accuracy for Retformer and VGG-16; if per-patient accuracy drops to near or below the VGG-16 value, or if slices from the same patient were found to span train and test folds in the current protocol, the paper's central performance claim would collapse.
Extended reading notes
Core claim
The authors find that a deliberately small, encoder-only vision transformer, with no pretraining, can outperform both ImageNet-pretrained CNNs (EfficientNet-B3, MobileNet, ResNet-50, VGG-16) and the retina-pretrained foundation model RETFound on Alzheimer's classification. On OCT data, Retformer reports accuracy 92% ± 1%, precision 91% ± 2%, sensitivity 90% ± 5%, specificity 91% ± 3%, F1 90% ± 4%, and ROC AUC 96% ± 1%; the best benchmark, VGG-16, reaches 81% ± 4% accuracy. On the fundus dataset it reports 94% ± 8% accuracy and 99% ± 3% AUC. Using Grad-CAM, the paper identifies the optic nerve head and retinal vasculature in fundus images, and the choroid and retinal layers (including RNFL, ganglion, and nuclear layers) in OCT slices, as the decisive regions; a masked-image experiment found that preserving only Grad-CAM-selected regions keeps accuracy at the level of the original images, while random masks degrade it significantly. The authors conclude that the combination of a small, regularized transformer and gradient-based explanation yields both higher accuracy and clinically interpretable decisions.
Load-bearing premise
The load-bearing premise is that the OCT slices are independent samples even though all 1,120 slices come from just 28 patients, with no described patient-level grouping; if the same patient's slices fall into both training and test folds, the reported 92% accuracy and the 11-point lead over baselines are inflated and do not show detection in new patients.
Editorial extensions
If this is right
- A from-scratch transformer could serve as an AD screening tool using standard OCT and fundus cameras, with accuracy above 90% in the reported settings.
- Other rare-disease imaging tasks, where labeled data is scarce, could adopt the same toolkit of CNN patch embedding, RoPE, GQA, and SwiGLU to avoid pretraining dependencies.
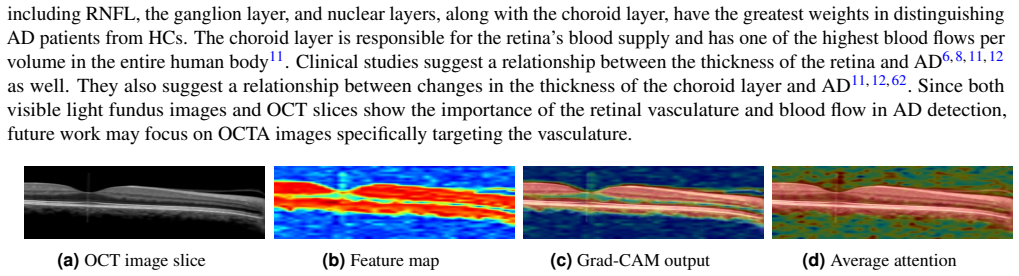
- Grad-CAM localization offers a way to connect model predictions to anatomical regions and existing retinal-biomarker literature, potentially guiding future clinical measurement of RNFL, choroid, and vasculature.
- The claimed parameter efficiency (about 4 million parameters against 42 million for VGG-16) suggests lower computational cost, which matters for community or mobile deployment.
Reading between the lines
- Because the OCT accuracy is computed over 2D slices from only 28 patients, the true patient-level margin over VGG-16 is probably smaller than 11 points; a grouped re-analysis would settle how much of the reported gain is real.
- The downsampling plateau at 50x50 images suggests the method could transfer to low-cost, low-resolution retinal cameras used in community screening, where clinical-grade OCT is unavailable.
- The Grad-CAM localization could seed a prospective study: enroll at-risk patients, measure RNFL, choroid, and vasculature in the highlighted regions, and test whether those measurements track cognitive decline.
Editorial analysis
A structured set of objections, weighed in public.
Referee Report
Summary. The paper proposes Retformer, a compact transformer architecture combining convolutional patch embedding, rotary position embeddings, grouped-query attention, and SwiGLU activations, for detecting Alzheimer's disease from retinal fundus images and OCT image slices. The authors report nested cross-validation experiments on an OCT dataset of 1,120 slices derived from 28 patients and on a combined fundus dataset, claiming accuracy improvements of up to 11% over several baselines including EfficientNet, MobileNet, ResNet-50, VGG-16, and RETFound. They also use Grad-CAM to identify retinal regions important for classification and compare these regions with clinical knowledge of retinal biomarkers of Alzheimer's disease. The central claim is that Retformer outperforms the benchmarks across all reported metrics and provides clinically plausible explanations.
Significance. The proposed architecture is sensibly designed for small medical image datasets, and the paper includes a useful ablation study and a Grad-CAM-based sanity check. If the reported performance were validated with a leakage-free evaluation protocol, the results could be of practical interest for non-invasive AD screening. The paper also makes the used open datasets identifiable, which supports reproducibility. However, the empirical evaluation is currently not trustworthy: the OCT results are based on slice-level splits without patient grouping, which creates a high risk of information leakage and directly undermines the headline comparison against benchmark models.
major comments (4)
- [§1.1, §2.2] The OCT evaluation is not patient-independent. Section 1.1 states that the OCT dataset consists of 224 three-dimensional volumes from only 28 patients (14 AD, 14 HC), which are converted into 1,120 two-dimensional slices. Section 2.1 describes nested cross-validation with 3 outer folds but does not mention any grouping by patient. Because adjacent slices from the same 3D volume are highly correlated, random slice-level folds place slices from the same patient in both training and test sets. This allows the model to exploit patient-specific scanning artifacts, anatomy, or imaging conditions rather than generalizable AD biomarkers. Consequently, the reported accuracy of 92% ± 1% on OCT and the 11% accuracy gap over VGG-16 in Table 7 are not reliable evidence for the paper's central claim. A valid evaluation requires patient-level grouping (e.g., GroupKFold), and with only 28 patients the reported standard deviations of 1–5% are implausibly small for patient-level folds.
- [§2.1, Tables 3–4] Hyperparameters are selected using a 'simple (non-nested) cross-validation on the entire datasets' before the nested cross-validation evaluation. This is explicitly stated in Section 2.1 and shown in Tables 3 and 4. Selecting hyperparameters on the full dataset leaks information from the eventual test folds into the model configuration, so the nested cross-validation no longer provides an unbiased estimate of generalization performance. This issue is independent of the OCT grouping problem and would need to be corrected by performing hyperparameter selection inside the inner folds of the nested procedure.
- [§2.2, Table 8] The p-values in Table 8 are not credible for the stated evaluation design. With only 3 outer folds, any fold-level comparison has at most 2 degrees of freedom for a paired test, and the manuscript's own power calculation in Equations (15)–(16) uses DF = k − 1 = 2. Reporting p < 0.001 for all six metrics requires an implausibly large and consistent t-statistic, and the table does not specify how the test was computed or whether multiple-testing corrections were applied. Moreover, fold-level performance estimates in nested cross-validation are not independent because training sets across folds overlap substantially. The statistical evidence for the claimed superiority of Retformer is therefore not established.
- [§2.2 vs. §2.6] There is a direct inconsistency between the reported OCT accuracies. Table 7 reports Retformer accuracy of 92% ± 1% using nested cross-validation, while Table 10 reports a baseline accuracy of 94% in the ablation study using 'a simple 3-fold cross-validation'. The ablation is therefore not comparable to the main evaluation, and the discrepancy suggests that the model's performance depends strongly on the evaluation protocol. This inconsistency weakens the ablation conclusions and, combined with the leakage concerns, indicates that the reported metrics are sensitive to how the experiments are set up.
minor comments (5)
- [§2.3, §3] The parameter count of Retformer is inconsistently reported: Section 2.3 states '4 million parameters' while the Discussion states a '7.6M parameter count'. Please clarify which value is correct and reconcile the two numbers.
- [Introduction] There is a typo in the Introduction: 'AD-related retinpoathy' should read 'AD-related retinopathy'.
- [§2.2, Table 9] The fundus dataset is highly imbalanced (14% AD vs. 86% HC), and only accuracy and AUC are reported. On such a dataset, accuracy can be misleading; the paper should report balanced metrics such as precision, recall, F1, or specificity/sensitivity, as is done for the OCT dataset.
- [§2.4, Figure 5] Figure 5 reports accuracy versus image size but does not specify the evaluation protocol (nested CV vs. simple split) or show error bars. Without this information, the downsampling experiment is difficult to interpret.
- [§1.2, Equation (3)] The notation in Equation (3) for grouped-query attention is incomplete: the underbrace labels show 'Attention group 1' and 'Attention group g', but intermediate groups are not defined, and the dimensions of the concatenated output are unclear. Please make the notation fully explicit.
Circularity Check
No load-bearing circularity; the accuracy claim is empirical, with only a minor self-referential Grad-CAM sanity check.
-
other
[Section 2.7 (Explainability, Grad-CAM masked-image experiment)]
"In this setup, we trained a Retformer model on the training data of the outer folds of the nested cross-validation, and used it to generate regions of interest in the test images of the outer folds. ... This suggests that the regions of interest detected by Grad-CAM contribute meaningfully to the model’s performance."
The Grad-CAM regions of interest are computed from the Retformer model itself, so the masked-image comparison tests the model's saliency maps for consistency with its own decisions rather than independently validating those regions as AD biomarkers. The inference that the highlighted regions are 'relevant for AD diagnosis' is therefore self-referential by construction: the same model generates the masks and is then shown to perform well when trained on those masks. This is a standard explainability sanity check and does not support the paper's headline accuracy comparison, so the overall circularity is minimal.
full rationale
The paper's central claim—that Retformer outperforms EfficientNet, MobileNet, ResNet-50, VGG-16, and RETFound by up to 11% accuracy—is an empirical benchmark result obtained by nested cross-validation; no core equation or fitted parameter reduces to the target result by construction. The architecture choices (RoPE, GQA, SwiGLU, CNN patch embedding) are standard components cited from external work, and the ablations are empirical. Self-citations (References 17-19, involving co-author Chiong) are literature-review items and are not load-bearing. The only self-referential element is the Grad-CAM masked-image sanity check in Section 2.7, which uses the model's own saliency maps to claim the highlighted regions are clinically relevant; this is a secondary interpretability validation, not the source of the reported accuracy. Potential evaluation weaknesses (slice-level OCT leakage from 28 patients and hyperparameters tuned on the full datasets before nested CV) are validity concerns about independence of the benchmark, not circularity of the derivation chain.
Assumptions & free parameters
free parameters (3)
- Retformer hyperparameters =
D=62/32, patch size 4, layers 1/4, heads 12/2, query groups 3/1 (OCT/fundus)
- Image size =
50x50 pixels
- Exclusion of young adult OCT controls =
8 subjects excluded
assumptions (3)
- domain assumption 2D OCT slices are independent samples
- domain assumption Retinal biomarker patterns from clinical studies can be visually compared with Grad-CAM maps
- standard math Standard transformer components (RoPE, GQA, SwiGLU) behave as reported in prior work
Cite this review
Pith. "Pith review of An Explainable Transformer Model for Alzheimer's Disease Detection Using Retinal Imaging." pith.science (2026). https://pith.science/paper/QXX76AKK
@misc{pith2026250704259,
  author       = {Pith},
  title        = {Pith review of: An Explainable Transformer Model for Alzheimer's Disease Detection Using Retinal Imaging},
  year         = {2026},
  howpublished = {\url{https://pith.science/paper/QXX76AKK}},
  note         = {Machine review of arXiv:2507.04259}
}
read the original abstract
Alzheimer's disease (AD) is a neurodegenerative disorder that affects millions worldwide. In the absence of effective treatment options, early diagnosis is crucial for initiating management strategies to delay disease onset and slow down its progression. In this study, we propose Retformer, a novel transformer-based architecture for detecting AD using retinal imaging modalities, leveraging the power of transformers and explainable artificial intelligence. The Retformer model is trained on datasets of different modalities of retinal images from patients with AD and age-matched healthy controls, enabling it to learn complex patterns and relationships between image features and disease diagnosis. To provide insights into the decision-making process of our model, we employ the Gradient-weighted Class Activation Mapping algorithm to visualize the feature importance maps, highlighting the regions of the retinal images that contribute most significantly to the classification outcome. These findings are compared to existing clinical studies on detecting AD using retinal biomarkers, allowing us to identify the most important features for AD detection in each imaging modality. The Retformer model outperforms a variety of benchmark algorithms across different performance metrics by margins of up to 11\.
Figures


Figures from the paper (5 more)


Reference graph
Works this paper leans on
-
[1]
Association, A. et al. 2016 alzheimer’s disease facts and figures. Alzheimer’s & Dementia 12, 459–509 (2016)
work page 2016
-
[2]
Sperling, R. A., Jack Jr, C. R. & Aisen, P. S. Testing the right target and right drug at the right stage. Sci. translational medicine 3 (2011)
work page 2011
-
[3]
Dubois, B. et al. Preclinical alzheimer’s disease: definition, natural history, and diagnostic criteria.Alzheimer’s & Dementia 12, 292–323 (2016)
work page 2016
-
[4]
Sperling, R. A. et al. Toward defining the preclinical stages of alzheimer’s disease: Recommendations from the national institute on aging-alzheimer’s association workgroups on diagnostic guidelines for alzheimer’s disease. Alzheimer’s & dementia 7, 280–292 (2011)
work page 2011
-
[5]
Iseri, P. K., Altinas, Ö., Tokay, T. & Yüksel, N. Relationship between cognitive impairment and retinal morphological and visual functional abnormalities in alzheimer disease. J. neuro-ophthalmology 26, 18–24 (2006)
work page 2006
-
[6]
Kirbas, S., Turkyilmaz, K., Anlar, O., Tufekci, A. & Durmus, M. Retinal nerve fiber layer thickness in patients with alzheimer disease. J. Neuro-Ophthalmology 33, 58–61 (2013)
work page 2013
-
[7]
Kromer, R. et al. Detection of retinal nerve fiber layer defects in alzheimer’s disease using sd-oct. Front. psychiatry 5, 22 (2014)
work page 2014
-
[8]
den Haan, J., Verbraak, F. D., Visser, P. J. & Bouwman, F. H. Retinal thickness in alzheimer’s disease: a systematic review and meta-analysis. Alzheimer’s & Dementia: Diagn. Assess. & Dis. Monit. 6, 162–170 (2017). 17/20
work page 2017
Show all 64 references
-
[9]
Neurocognitive assessment and retinal thickness alterations in alzheimer disease: is there a correlation? J
Cipollini, V .et al. Neurocognitive assessment and retinal thickness alterations in alzheimer disease: is there a correlation? J. Neuro-Ophthalmology 40, 370–377 (2020)
2020
-
[10]
Y ., Choi, E
Shin, J. Y ., Choi, E. Y ., Kim, M., Lee, H. K. & Byeon, S. H. Changes in retinal microvasculature and retinal layer thickness in association with apolipoprotein e genotype in alzheimer’s disease. Sci. Reports 11, 1847 (2021)
2021
-
[11]
Y .et al
Cheung, C. Y .et al. Retinal imaging in alzheimer’s disease. J. Neurol. Neurosurg. & Psychiatry92, 983–994 (2021)
2021
-
[12]
Y .-l., Ikram, M
Cheung, C. Y .-l., Ikram, M. K., Chen, C. & Wong, T. Y . Imaging retina to study dementia and stroke.Prog. retinal eye research 57, 89–107 (2017)
2017
-
[13]
Retinal biomarkers in alzheimer’s disease and mild cognitive impairment: A systematic review and meta-analysis
Ge, Y .-J.et al. Retinal biomarkers in alzheimer’s disease and mild cognitive impairment: A systematic review and meta-analysis. Ageing Res. Rev. 69, 101361 (2021)
2021
-
[14]
A foundation model for generalizable disease detection from retinal images
Zhou, Y .et al. A foundation model for generalizable disease detection from retinal images. Nature 622, 156–163 (2023)
2023
-
[15]
& Fatima, A
Badar, M., Haris, M. & Fatima, A. Application of deep learning for retinal image analysis: A review. Comput. Sci. Rev. 35, 100203 (2020)
2020
-
[16]
& Javadzadeh, A
Ashayeri, H., Jafarizadeh, A., Yousefi, M., Farhadi, F. & Javadzadeh, A. Retinal imaging and alzheimer’s disease: a future powered by artificial intelligence. Graefe’s Arch. for Clin. Exp. Ophthalmol. 1–13 (2024)
2024
-
[17]
A., Luo, S
Ebrahimighahnavieh, M. A., Luo, S. & Chiong, R. Deep learning to detect alzheimer’s disease from neuroimaging: A systematic literature review. Comput. methods programs biomedicine 187, 105242 (2020)
2020
-
[18]
Ebrahimi, A., Luo, S., Chiong, R., Initiative, A. D. N. et al. Deep sequence modelling for alzheimer’s disease detection using mri. Comput. Biol. Medicine 134, 104537 (2021)
2021
-
[19]
& Chiong, R
Ebrahimi-Ghahnavieh, A., Luo, S. & Chiong, R. Transfer learning for alzheimer’s disease detection on mri images. In 2019 IEEE International Conference on Industry 4.0, Artificial Intelligence, and Communications Technology (IAICT), 133–138 (IEEE, 2019)
2019
-
[20]
Tian, J. et al. Modular machine learning for alzheimer’s disease classification from retinal vasculature. Sci. Reports 11, 238 (2021)
2021
-
[21]
Tan, M. & Le, Q. Efficientnet: Rethinking model scaling for convolutional neural networks. In International conference on machine learning, 6105–6114 (PMLR, 2019)
2019
-
[22]
Y .et al
Cheung, C. Y .et al. A deep learning model for detection of alzheimer’s disease based on retinal photographs: a retrospective, multicentre case-control study. The Lancet Digit. Heal. 4, e806–e815 (2022)
2022
-
[23]
& Sun, J
He, K., Zhang, X., Ren, S. & Sun, J. Deep residual learning for image recognition. In Proceedings of the IEEE conference on computer vision and pattern recognition, 770–778 (2016)
2016
-
[24]
Wisely, C. E. et al. Convolutional neural network to identify symptomatic alzheimer’s disease using multimodal retinal imaging. Br. J. Ophthalmol. 106, 388–395 (2022)
2022
-
[25]
Wang, X. et al. Machine learning based on optical coherence tomography images as a diagnostic tool for alzheimer’s disease. CNS Neurosci. & Ther. 28, 2206–2217 (2022)
2022
-
[26]
& Lesage, F
Corbin, D. & Lesage, F. Assessment of the predictive potential of cognitive scores from retinal images and retinal fundus metadata via deep learning using the clsa database. Sci. Reports 12, 5767 (2022)
2022
-
[27]
& Zisserman, A
Simonyan, K. & Zisserman, A. Very deep convolutional networks for large-scale image recognition. CoRR abs/1409.1556 (2014)
2014 arXiv
-
[28]
Yousefzadeh, N. et al. Neuron-level explainable ai for alzheimer’s disease assessment from fundus images. Sci. Reports 14, 7710 (2024)
2024
-
[29]
& El-Sharkawy, M
Sinha, D. & El-Sharkawy, M. Thin mobilenet: An enhanced mobilenet architecture. In 2019 IEEE 10th annual ubiquitous computing, electronics & mobile communication conference (UEMCON), 0280–0285 (IEEE, 2019)
2019
-
[30]
K., Lim, Y
Kim, H. K., Lim, Y . J., Sunwoo, M. H.et al. Efficient deep retinal fundus image-based network for alzheimer’s disease diagnosis using mobile device applications. IEEE Access (2024)
2024
-
[31]
& Ben Ayed, I
Silva-Rodríguez, J., Chakor, H., Kobbi, R., Dolz, J. & Ben Ayed, I. A foundation language-image model of the retina (flair): encoding expert knowledge in text supervision. Med. Image Analysis 99, 103357, DOI: https://doi.org/10.1016/j. media.2024.103357 (2025)
2025
-
[32]
Du, J. et al. Ret-clip: A retinal image foundation model pre-trained with clinical diagnostic reports. In Linguraru, M. G. et al. (eds.) Medical Image Computing and Computer Assisted Intervention – MICCAI 2024, 709–719 (Springer Nature Switzerland, Cham, 2024). 18/20
2024
-
[33]
& Arora, S
Vij, R. & Arora, S. A systematic survey of advances in retinal imaging modalities for alzheimer’s disease diagnosis. Metab. Brain Dis. 37, 2213–2243 (2022)
2022
-
[34]
Shamshad, F. et al. Transformers in medical imaging: A survey. Med. image analysis 88, 102802 (2023)
2023
-
[35]
Hussain, T. et al. Effresnet-vit: A fusion-based convolutional and vision transformer model for explainable medical image classification. IEEE Access (2025)
2025
-
[36]
Alam, T. et al. An integrated approach using yolov8 and resnet, seresnet & vision transformer (vit) algorithms based on roi fracture prediction in x-ray images of the elbow. Curr. Med. Imaging 20, e15734056309890 (2024)
2024
-
[37]
& Liu, F
Dai, Y ., Gao, Y . & Liu, F. Transmed: Transformers advance multi-modal medical image classification.Diagnostics 11, 1384 (2021)
2021
-
[38]
Touvron, H. et al. Training data-efficient image transformers & distillation through attention. In International conference on machine learning, 10347–10357 (PMLR, 2021)
2021
-
[39]
Monajatipoor, M. et al. Berthop: An effective vision-and-language model for chest x-ray disease diagnosis. InInternational Conference on Medical Image Computing and Computer-Assisted Intervention, 725–734 (Springer, 2022)
2022
-
[40]
Valanarasu, J. M. J., Oza, P., Hacihaliloglu, I. & Patel, V . M. Medical transformer: Gated axial-attention for medical image segmentation. In Medical image computing and computer assisted intervention–MICCAI 2021: 24th international conference, Strasbourg, France, September 2...
2021
-
[41]
A., Marhoon, H
Hussain, T., Shouno, H., Mohammed, M. A., Marhoon, H. A. & Alam, T. Dcssga-unet: Biomedical image segmentation with densenet channel spatial and semantic guidance attention. Knowledge-Based Syst. 314, 113233 (2025)
2025
-
[42]
N., Ibrahim, M
Asim, M. N., Ibrahim, M. A., Imran Malik, M., Dengel, A. & Ahmed, S. Circ-locnet: A computational framework for circular rna sub-cellular localization prediction. Int. J. Mol. Sci. 23, 8221 (2022)
2022
-
[43]
Khan, S. U. R., Asim, M. N., V ollmer, S. & Dengel, A. Robust & precise knowledge distillation-based novel context-aware predictor for disease detection in brain and gastrointestinal. arXiv preprint arXiv:2505.06381 (2025)
2025
-
[44]
Dwivedi, R. et al. Explainable ai (xai): Core ideas, techniques, and solutions. ACM Comput. Surv. 55, 1–33 (2023)
2023
-
[45]
& Khan, S
Hekmat, A., Zuping, Z., Bilal, O. & Khan, S. U. R. Differential evolution-driven optimized ensemble network for brain tumor detection. Int. J. Mach. Learn. Cybern. 1–26 (2025)
2025
-
[46]
Selvaraju, R. R. et al. Grad-cam: Visual explanations from deep networks via gradient-based localization. In Proceedings of the IEEE international conference on computer vision, 618–626 (2017)
2017
-
[47]
Vaswani, A. et al. Attention is all you need. Adv. neural information processing systems 30 (2017)
2017
-
[48]
Dosovitskiy, A. et al. An image is worth 16x16 words: Transformers for image recognition at scale. In International Conference on Learning Representations (2021)
2021
-
[49]
Su, J. et al. Roformer: Enhanced transformer with rotary position embedding. Neurocomputing 568, 127063 (2024)
2024
-
[50]
Ainslie, J. et al. GQA: Training generalized multi-query transformer models from multi-head checkpoints. In Bouamor, H., Pino, J. & Bali, K. (eds.) Proceedings of the 2023 Conference on Empirical Methods in Natural Language Processing, 4895–4901, DOI: 10.18653/v1/2023.emnlp-ma...
2023 doi
-
[51]
Glu variants improve transformer
Shazeer, N. Glu variants improve transformer. arXiv preprint arXiv:2002.05202 (2020)
2020 arXiv
-
[52]
& Bernard, J
Bissig, D., Zhou, C., Le, V . & Bernard, J. A practical approach to functional optical coherence tomography shows abnormal retinal responses in alzheimer’s disease [dataset]. dryad. (2020). https://doi.org/10.5061/dryad.msbcc2ftc
2020 doi
-
[53]
Popovic, N. et al. Topological characterization of the retinal microvascular network visualized by portable fundus camera- effects of chronic disease (trend2) database (1.1) [dataset]. zenodo. (2023)
2023
-
[54]
Cen, L.-P. et al. Automatic detection of 39 fundus diseases and conditions in retinal photographs using deep neural networks. Nat. communications 12, 4828 (2021)
2021
-
[55]
L., Kiros, J
Ba, J. L., Kiros, J. R. & Hinton, G. E. Layer normalization (2016). 1607.06450
2016 arXiv
-
[56]
D., Wijewardena, P
Keles, F. D., Wijewardena, P. M. & Hegde, C. On the computational complexity of self-attention. In International Conference on Algorithmic Learning Theory, 597–619 (PMLR, 2023)
2023
-
[57]
& Jégou, H
Touvron, H., Cord, M., El-Nouby, A., Verbeek, J. & Jégou, H. Three things everyone should know about vision transformers. In European Conference on Computer Vision, 497–515 (Springer, 2022). 19/20
2022
-
[58]
Ke, X., Cao, W. & Lv, F. Relationship between complexity and precision of convolutional neural networks. In2017 2nd International Symposium on Advances in Electrical, Electronics and Computer Engineering (ISAEECE 2017), 325–329 (Atlantis Press, 2017)
2017
-
[59]
& Aghaeipoor, F
Kashefi, R., Barekatain, L., Sabokrou, M. & Aghaeipoor, F. Explainability of vision transformers: A comprehensive review and new perspectives. arXiv preprint arXiv:2311.06786 (2023)
2023 arXiv
-
[60]
Deng, J. et al. Imagenet: A large-scale hierarchical image database. In 2009 IEEE conference on computer vision and pattern recognition, 248–255 (Ieee, 2009)
2009
-
[61]
& Zeng, W
Wang, G., Zhao, Y ., Tang, C., Luo, C. & Zeng, W. When shift operation meets vision transformer: An extremely simple alternative to attention mechanism. In Proceedings of the AAAI Conference on Artificial Intelligence, vol. 36, 2423–2430 (2022)
2022
-
[62]
Lee, C. S. & Apte, R. S. Retinal biomarkers of alzheimer disease. Am. journal ophthalmology 218, 337–341 (2020)
2020
-
[63]
Budu-Aggrey, A. et al. The relationship between open angle glaucoma, optic disc morphology and alzheimer’s disease: a mendelian randomization study. medRxiv 2020–08 (2020)
2020
-
[64]
Bambo, M. P. et al. Analysis of optic disk color changes in alzheimer’s disease: A potential new biomarker. Clin. Neurol. Neurosurg. 132, 68–73 (2015). 20/20
2015
Reviewed August 6, 2026 · model on record in the stance chip above.
Discussion (0). Continue with ORCID to comment.