REVIEW 4 major objections 5 minor 58 references
gigiProfiler: Diagnosing Performance Issues by Uncovering Application Resource Bottlenecks
T0 review · 4 major / 5 minor · reviewed 2026-08-06 · deepseek-v4-flash
Pith's one-line read gigiProfiler claims that application-defined resource bottlenecks can be discovered from code metadata and profiled automatically, with all 12 tested real-world issues diagnosed.
desk verdict A plausible LLM+static hybrid for a real gap, with two developer-confirmed wins, but the resource-discovery stage is validated only on MySQL exclusive resources, leaving the 12/12 claim under-supported. read the letter →
The pith
A machine-rendered reading of the paper's core claim, the machinery that carries it, and where it could break.
The reading
What carries the argument
The mechanism that carries the argument is a three-stage pipeline. First, a tokenizer turns files, classes, functions, and variables into a tree of metadata, and Chain-of-Thought prompts make the LLM decide stage-by-stage which structures are exclusive or shared resources and which functions operate on them. Second, a static-analysis validator routes each candidate to a resource-specific pass: exclusive resources must have synchronization primitives that can yield the thread, and shared resources must show control-flow divergence or system-level interactions; otherwise the candidate is discarded. Third, lightweight hooks on the validated operator functions record resource usage into thread-local buffers, Algorithm 1 picks the resource with the largest blocking time, and value-assisted data-flow profiling compares loop-exit variables and iteration counts between buggy and normal runs; anomalous loops are reported as the root cause.
What would settle it
Take a reproduced resource-contention bug and strip or rewrite the documentation and comments surrounding the resource and its operator functions, then rerun gigiProfiler; if it still identifies the bottleneck, the metadata-discovery premise is not decisive, and if it fails, the premise is confirmed as the load-bearing step.
Extended reading notes
Core claim
The paper sets out to show that application-resource bottlenecks—the kind caused by waiting on an application-defined structure such as an UNDO log, buffer pool, or concurrency queue—are diagnosable automatically without manual instrumentation. Its central claim is that the hard part, knowing which custom structures are shared resources, can be solved by treating software metadata as the source of truth: an LLM infers candidate resources and operator functions from comments and documentation, and a static analyzer verifies them against code patterns, yielding 92 validated exclusive resources for MySQL with 80.4% accuracy versus 3.7% for the LLM alone and 41.9% for static analysis alone. With resources in hand, the tool instruments their usage, ranks them by blocking time, and explains the bottleneck by comparing critical loop variables between buggy and normal executions. The evaluation claims all 12 reproduced issues were diagnosed, with the true root cause ranked first in 9 and all true root causes ahead of other candidates in the remaining 3; two of the cases were previously unresolved MariaDB issues whose developer-confirmed fixes are reported.
Load-bearing premise
The approach assumes that a codebase's comments, documentation, and function descriptions reveal which custom data structures are shared resources; the paper itself notes that comment loss, misleading descriptions, and missing software context can defeat the LLM stage, and if the metadata does not name a resource, the pipeline never gets a chance to profile it.
Editorial extensions
If this is right
- Diagnosing slowdowns that produce no CPU hotspot and no system-level wait becomes a matter of instrumenting the resource list, not guessing which custom structure matters.
- The 12-case result—bottleneck found in all cases, true root cause ranked first in 9, all true root causes ahead of others in 3—is the headline claim a user would rely on.
- Two previously unresolved MariaDB regressions were traced to specific source lines (vector_mhnsw.cc:590 and :1296, and Galera TOI handling), and developers confirmed the fixes, suggesting the method can go beyond re-finding known bugs.
- At an average 95-second analysis time and 5.86% runtime overhead, the pipeline is usable in normal debugging workflows rather than only as a research prototype.
- Because the offline analyzer scans MySQL in 166 minutes and the online profiler runs separately, the resource list can be reused across repeated diagnoses once a codebase has been mapped.
Reading between the lines
- The metadata assumption is the stage most worth probing: running the same pipeline on a codebase whose comments have been stripped or made misleading should degrade bottleneck identification, since the LLM stage is the only source of candidate resources.
- Because root-cause analysis depends on comparing against a normal execution, a production deployment would need a way to obtain or synthesize that baseline; the paper's evaluation always has one available.
- The exclusive/shared dichotomy might be enriched: some resources are used exclusively in one phase and shared in another, and validation patterns for such hybrid resources are not discussed.
- If the LLM's probabilistic inconsistency, noted in section 3.1, persists inside the hybrid pipeline, sampling multiple LLM runs and taking the intersection before static validation could raise precision; this is not tested in the paper.
Editorial analysis
A structured set of objections, weighed in public.
Referee Report
Summary. gigiProfiler proposes OmniResource Profiling, a hybrid LLM-plus-static-analysis approach to discover application-defined resources from software metadata and to diagnose performance bottlenecks by instrumenting the application to trace resource usage, ranking resources by blocking time, and comparing sampled variables against a normal execution to identify root causes. The evaluation covers 12 real-world issues across MySQL, MariaDB, PostgreSQL, Apache, and LLAMA, and the paper reports that gigiProfiler identifies the bottleneck resource in all cases, ranks the true root cause first in 9 cases, ranks all true root causes ahead of other candidates in the remaining 3, and diagnoses two previously unresolved MariaDB issues whose fixes were later confirmed by developers. The paper also reports an average runtime overhead of 5.86% and offline analysis times of roughly 100 seconds per case.
Significance. The core idea—using LLM inference over documentation and comments followed by static validation to recover application-defined resources and then profiling them as first-class entities—is a useful step beyond system-level profilers. The evaluation spans a diverse set of real applications and includes two developer-confirmed diagnoses, which is strong evidence that the approach can produce actionable results. The paper does not ship machine-checked proofs or a public artifact, but the algorithmic skeleton in Algorithm 1 and the overhead measurements are concrete. The main risks are in the evaluation, not in the design: resource-discovery accuracy is only measured for exclusive resources in MySQL with no recall, the perf baseline is under-specified, and the normal-execution baseline is not characterized, so the central 12/12 claim is not yet fully supported.
major comments (4)
- [Section 5.6 / Table 2] The hybrid analyzer that generates the candidate resource list is validated only for exclusive resources in MySQL: Section 5.6 reports 80.4% precision and gives no recall value, and the manual verification protocol is not described. Table 2 contains six shared-resource cases (c4, c5, c7, c9, c10, c11) in MariaDB, PostgreSQL, Apache, and LLAMA, for which no resource-discovery accuracy or recall is reported. Because Algorithm 1 can only rank resources proposed by the analyzer, a missed true bottleneck resource would be silently absent from the ranking. Given that Section 3.1 documents LLM nondeterminism and dependence on documentation quality, the single-run 12/12 result does not establish that discovery reliably finds the relevant resources across the evaluated suite. Please report per-case whether the true bottleneck resource was present in the candidate list, plus recall and precision of resource discovery per application and resource type.
- [Section 5.3] The comparison with perf lacks the experimental setup required to make the results reproducible. The section only says that perf tracked the execution time of functions in blocked threads and ranked them in descending order. It does not state the perf events used, sampling rate, whether on-CPU or off-CPU profiling was performed, how call stacks were recorded, how the root cause function was determined for perf, or how the perf ranking was matched against the true root cause. Without this information, the claim that perf failed to record the root cause in 7 cases cannot be assessed.
- [Sections 4.4 and 5.1] The normal-execution baseline that drives value-assisted root cause analysis is not defined. For each case, the authors do not specify what constitutes the normal run (workload, input, configuration, duration), how the sampled variables from the buggy and normal runs are aligned, or what anomaly threshold flags a root cause variable. Since Table 2's 'Root Cause Variable' column derives from this comparison, the root-cause identification results are not reproducible with the information given.
- [Section 5.6] The manual verification behind the accuracy numbers (3.7%, 41.9%, 80.4%) is unspecified. The paper does not report how many of the 92 hybrid-selected resources were checked, who performed the classification, what the ground-truth criteria were, or whether the verification was independent of the authors' expectations. Please provide the annotation protocol and the number of resources verified; otherwise the accuracy claim is not interpretable.
minor comments (5)
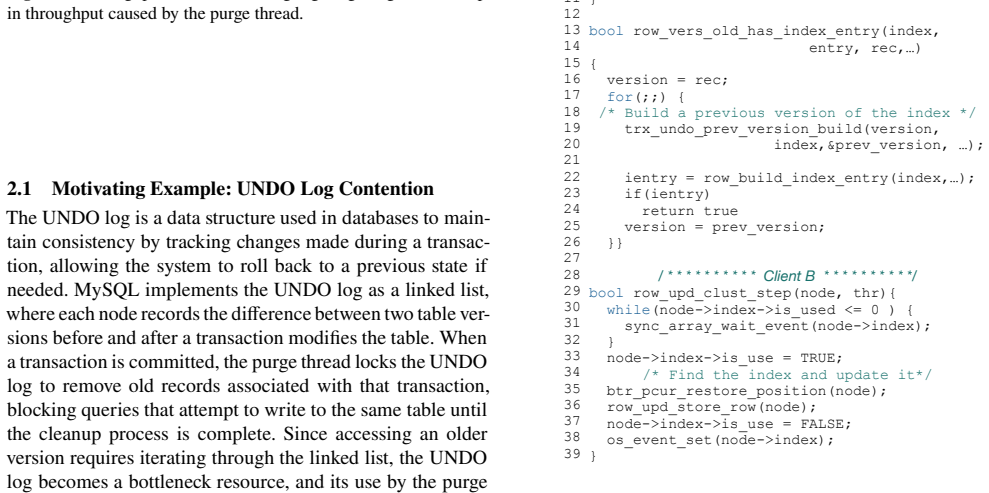
- [Figure 1] The pseudocode in Figure 1 contains corrupted token sequences (e.g., '/gid38/gid3/gid9...') that obscure the motivating example; the figure should be regenerated in a readable form.
- [Algorithm 1] The pseudocode is typeset with unicode math symbols that render as escape sequences (e.g., 'res_list' appears as a sequence of '/u1D45F...' tokens), making the algorithm unreadable; the algorithm should be retyped in normal text.
- [Section 5.4 / References [27], [28]] The reference descriptions for MDEV-34836 and MDEV-34989 both read 'Performance regression due to excessive purge lag,' but the body text describes MDEV-34989 as a vector search issue and MDEV-34836 as a Galera TOI issue; these citations appear mismatched and should be corrected.
- [Section 5.5] The overhead plot (Figure 9) shows per-case overheads but no error bars or numerical values; given that each case was run five times, reporting the mean and standard deviation would make the 5.86% average more reliable.
- [Section 5.2] The statement that in 3 cases gigiProfiler 'ranked all of them before other potential causes' is not directly supported by Table 2, which lists only the root-cause functions and their positions; specifying how the ranking was constructed for cases c3, c5, and c12 would help.
Circularity Check
No significant circularity: bottleneck ranking and root-cause diagnosis rest on independent measurements and externally confirmed ground truth.
full rationale
The paper's derivation chain is self-contained. gigiProfiler's bottleneck identification is not a fitted prediction: Algorithm 1 ranks resources by measured blocking/holding times accumulated from instrumentation, and the evaluation compares those rankings against externally documented, developer-confirmed root causes (Table 2; Section 5.2), including two previously unresolved MariaDB issues independently confirmed by developers (Section 5.4). The resource-discovery stage (LLM inference validated by static analysis, Sections 3.3-3.4) is an enabling input, not derived from the bottleneck claim; Section 5.6 checks its precision against a manually verified MySQL resource set (80.4%), and the fact that recall/coverage on the shared-resource cases is unreported is a validation gap, not a circular reduction. Root-cause analysis compares sampled loop/iteration behavior between buggy and normal executions (Section 4.4); the differential is the method's stated criterion, and the 'root cause' label is confirmed by external reports rather than defined by the output metric. There are self-citations ([19], [21], [50]) but none carries the central argument: they support background motivation or related-work context, and no uniqueness theorem or ansatz is imported from them. No fitted parameter, self-defined prediction, or citation-forced step was found.
Assumptions & free parameters
assumptions (4)
- domain assumption Application-defined resources are documented in code comments, documentation, and function descriptions.
- domain assumption Resource contention manifests as explicit yield or sleep synchronization for exclusive resources and as control-flow divergence or system-call interaction for shared resources.
- domain assumption Differential comparison of variable values and loop counts between buggy and normal executions identifies the root cause.
- domain assumption The 12 collected performance issues and their developer-identified root causes are valid ground truth.
Cite this review
Pith. "Pith review of gigiProfiler: Diagnosing Performance Issues by Uncovering Application Resource Bottlenecks." pith.science (2026). https://pith.science/paper/3AFPBIRG
@misc{pith2026250706452,
  author       = {Pith},
  title        = {Pith review of: gigiProfiler: Diagnosing Performance Issues by Uncovering Application Resource Bottlenecks},
  year         = {2026},
  howpublished = {\url{https://pith.science/paper/3AFPBIRG}},
  note         = {Machine review of arXiv:2507.06452}
}
read the original abstract
Diagnosing performance bottlenecks in modern software is essential yet challenging, particularly as applications become more complex and rely on custom resource management policies. While traditional profilers effectively identify execution bottlenecks by tracing system-level metrics, they fall short when it comes to application-level resource contention caused by waiting for application-level events. In this work, we introduce OmniResource Profiling, a performance analysis approach that integrates system-level and application-level resource tracing to diagnose resource bottlenecks comprehensively. gigiProfiler, our realization of OmniResource Profiling, uses a hybrid LLM-static analysis approach to identify application-defined resources offline and analyze their impact on performance during buggy executions to uncover the performance bottleneck. gigiProfiler then samples and records critical variables related to these bottleneck resources during buggy execution and compares their value with those from normal executions to identify the root causes. We evaluated gigiProfiler on 12 real-world performance issues across five applications. gigiProfiler accurately identified performance bottlenecks in all cases. gigiProfiler also successfully diagnosed the root causes of two newly emerged, previously undiagnosed problems, with the findings confirmed by developers.
Figures


Figures from the paper (5 more)


Reference graph
Works this paper leans on
-
[2]
Mona Attariyan, Michael Chow, and Jason Flinn. 2012. X-r ay: au- tomating root-cause diagnosis of performance anomalies in produc- tion software. In Proceedings of the 10th USENIX Conference on Op- erating Systems Design and Implementation (Hollywood, CA, USA) (OSDI’12). USENIX Association, USA, 307–320
work page 2012
-
[3]
Mona Attariyan and Jason Flinn. 2010. Automating configu ration trou- bleshooting with dynamic information flow analysis. In Proceedings of the 9th USENIX Conference on Operating Systems Design and Im ple- mentation (Vancouver, BC, Canada)(OSDI’10). USENIX Association, USA, 237–250
work page 2010
- [4]
-
[5]
Mark Chen, Jerry T worek, Heewoo Jun, Qiming Yuan, Henrique Ponde de Oliveira Pinto, Jared Kaplan, Harri Edwards, Yuri Burda, Nicholas Joseph, Greg Brockman, Alex Ray, Sandhini Puri, Gretchen Kr ueger, Michael Petrov, Heidy Khlaaf, Girish Sastry, Pamela Mishkin, Brooke Chan, Scott Gray, Nick Ryder, Michael Pavlov, Alethea Power, Lukas Kaiser, Mohammad Bav...
work page 2021
-
[6]
Yinfang Chen, Huaibing Xie, Minghua Ma, Yu Kang, Xin Gao, Liu Shi, Yunjie Cao, Xuedong Gao, Hao Fan, Ming Wen, Jun Zeng, Supriyo Ghosh, Xuchao Zhang, Chaoyun Zhang, Qingwei Lin, Saravan Rajmohan, Dongmei Zhang, and Tianyin Xu. 2024. Automatic Root Cause Analysis via Large Language Models for Cloud Incidents. In Proceedings of the Nineteenth European Con- ...
arXiv 2024
-
[7]
Michael Chow, David Meisner, Jason Flinn, Daniel Peek, and Thomas F. Wenisch. 2014. The mystery machine: end-to-end performanc e analy- sis of large-scale internet services. In Proceedings of the 11th USENIX Conference on Operating Systems Design and Implementation(Broom- field, CO) (OSDI’14). USENIX Association, USA, 217–231
work page 2014
-
[8]
Alibaba Cloud. 2019. An In-Depth Analysis of Undo Logs in InnoDB. https://www.alibabacloud.com/blog/an-in-depth-analy sis-of-undo-logs-in-innodb_598966
work page 2019
-
[10]
Yinlin Deng, Chunqiu Steven Xia, Chenyuan Y ang, Shizhu o Dy- lan Zhang, Shujing Y ang, and Lingming Zhang. 2024. Large Lan - guage Models are Edge-Case Generators: Crafting Unusual Pr o- grams for Fuzzing Deep Learning Libraries. In Proceedings of the IEEE/ACM 46th International Conference on Software En- gineering (Lisbon, Portugal) (ICSE ’24) . Associa...
arXiv 2024
Show all 58 references
-
[11]
OProfile Developers. 2023. OProfile: A System Profiler fo r Linux. https://oprofile.sourceforge.io/about/
2023
-
[12]
SystemTap Developers. 2023. SystemTap: Simplifying S ystem-Level Observability. https://sourceware.org/systemtap/
2023
-
[13]
Valgrind Developers. 2023. Valgrind: Instrumentatio n Framework for Building Dynamic Analysis Tools. https://valgrind.org/
2023
-
[14]
Xueying Du, Mingwei Liu, Kaixin Wang, Hanlin Wang, Junw ei Liu, Yixuan Chen, Jiayi Feng, Chaofeng Sha, Xin Peng, and Yiling L ou
-
[15]
Linux Foundation. [n. d.]. Perf: Linux profiling with pe rformance counters. https://perf.wiki.kernel.org/
-
[16]
Xiang Gao and Abhik Roychoudhury. 2020. Interactive Pa tch Gener- ation and Suggestion. In Proceedings of the IEEE/ACM 42nd Interna- tional Conference on Software Engineering Workshops (Seoul, Repub- lic of Korea) (ICSEW’20). Association for Computing Machinery, New Y ork, NY,...
2020
-
[17]
gperftools Developers. 2023. gperftools: Google Perf ormance Tools. https://github.com/gperftools/gperftools
2023
-
[18]
Sudheendra Hangal and Monica S. Lam. 2002. Tracking down software bugs using automatic anomaly detection. In Proceedings of the 24th International Conference on Software Engineering (Orlando, Florida) (ICSE ’02) . Association for Computing Machinery, New Y ork, NY, USA, 291–30...
2002
-
[19]
Yigong Hu, Gongqi Huang, and Peng Huang. 2023. Pushing P erfor- mance Isolation Boundaries into Application with pBox. In Proceed- ings of the 29th Symposium on Operating Systems Principles (Koblenz, Germany) (SOSP ’23) . Association for Computing Machinery, New Y ork, NY, USA...
2023
-
[21]
Baris Kasikci, Benjamin Schubert, Cristiano Pereira, Gilles Pokam, and George Candea. 2015. Failure sketching: a technique for automated root cause diagnosis of in-production failures. In Proceedings of the 25th Symposium on Operating Systems Principles (Monterey, California) ...
2015
-
[22]
Tanvir Ahmed Khan, Ian Neal, Gilles Pokam, Barzan Moza- fari, and Baris Kasikci. 2021. DMon: Efficient Detection and Correction of Data Locality Problems Using Selective Profil - ing. In 15th USENIX Symposium on Operating Systems Design and Implementation (OSDI 21) . USENIX Assoc...
2021
-
[23]
Zheng, Alex Aiken, and M ichael I
Ben Liblit, Mayur Naik, Alice X. Zheng, Alex Aiken, and M ichael I. Jordan. 2005. Scalable statistical bug isolation. In Proceedings of the 2005 ACM SIGPLAN Conference on Programming Language Design and Implementation (Chicago, IL, USA) (PLDI ’05) . As- sociation for Computing...
2005
-
[24]
Chang Lou, Cong Chen, Peng Huang, Yingnong Dang, Si Qin, Xinsheng Y ang, Xukun Li, Qingwei Lin, and Murali Chinta- lapati. 2022. RESIN: A Holistic Service for Dealing with Memory Leaks in Production Cloud Infrastructure. In 16th 14 USENIX Symposium on Operating Systems Design ...
2022
-
[25]
Lezhi Ma, Shangqing Liu, Yi Li, Xiaofei Xie, and Lei Bu. 2 024. SpecGen: Automated Generation of Formal Program Specifica- tions via Large Language Models. arXiv:2401.08807 [cs.SE] https://arxiv.org/abs/2401.08807
-
[26]
Jonathan Mace, Ryan Roelke, and Rodrigo Fonseca. 2016. Pivot Tracing: Dynamic Causal Monitoring for Distributed Systems. In 2016 USENIX Annual Technical Conference (USENIX ATC 16) . USENIX Association, Denver, CO. https://www.usenix.org/conference/atc16/technical-sessions/pres...
2016
-
[27]
MariaDB. 2023. MDEV-34836: Performance regression du e to exces- sive purge lag. https://jira.mariadb.org/browse/MDEV-34836 Ac- cessed: 2023-10-01
2023
-
[28]
MariaDB. 2023. MDEV-34989: Performance regression du e to exces- sive purge lag. https://jira.mariadb.org/browse/MDEV-34989 Ac- cessed: 2023-10-01
2023
-
[29]
MySQL. 2015. MySQL Bug #75540: Purge thread causes perf ormance regression. https://bugs.mysql.com/bug.php?id=75540
2015
-
[30]
MySQL. 2020. MySQL Bug #99315: Performance regression due to excessive purge lag. https://bugs.mysql.com/bug.php?id=99315
2020
-
[31]
Adrian Nistor, Linhai Song, Darko Marinov, and Shan Lu. 2013. Tod- dler: detecting performance problems via similar memory-a ccess pat- terns. In Proceedings of the 2013 International Conference on Soft- ware Engineering (San Francisco, CA, USA) (ICSE ’13). IEEE Press, 562–571
2013
-
[32]
Kay Ousterhout, Ryan Rasti, Sylvia Ratnasamy, Scott Sh enker, and Byung-Gon Chun. 2015. Making Sense of Perfor- mance in Data Analytics Frameworks. In 12th USENIX Sym- posium on Networked Systems Design and Implementation (NSDI 15) . USENIX Association, Oakland, CA, 293–307. h...
2015
-
[33]
Percona. 2014. InnoDB Transaction History Often Hides Dangerous Debt. https://www.percona.com/blog/innodb-transaction-his tory-often-hides-dangerous-debt/?utm_content=buffer4 2e4a&utm_medium=social&utm_source=app.net&utm_
2014
-
[34]
Percona. 2014. InnoDB’s Multi- Versioning Handling Can Be Achilles’ Heel. https://www.percona.com/blog/innodbs-multi-versioni ng-handling-can-be-achilles-heel/
2014
-
[35]
Percona. 2015. MySQL Performance Im- plications of InnoDB Isolation Modes. https://www.percona.com/blog/mysql-performance-impl ications-of-innodb-isolation-modes/
2015
-
[36]
Percona. 2017. Chasing a Hung Transaction in MySQL: InnoDB History Length Strikes Back. https://www.percona.com/blog/chasing-a-hung-transac tion-in-mysql-innodb-history-length-strikes-back/
2017
-
[37]
Percona. 2017. Impact of Swapping on MySQL Performance . https://www.percona.com/blog/impact-of-swapping-on- mysql-performance/
2017
-
[38]
Waiting for table flush
Percona. 2023. Percona XtraBackup and MySQL 5.7: Queries in "Waiting for table flush" State. https://www.percona.com/blog/percona-xtrabackup-and -mysql-5-7-queries-in-waiting-for-table-flush-state/
2023
-
[39]
GNU Project. 1998. GNU gprof: a Call Graph Execution Profiler . https://ftp.gnu.org/old-gnu/Manuals/gprof-2.9.1/htm l_mono/gprof.html
1998
-
[40]
Lenin Ravindranath, Jitendra Padhye, Sharad Agarwal, Ratul Mahajan, Ian Obermiller, and Shahin Shayandeh. 2012. Ap- pInsight: Mobile App Performance Monitoring in the Wild. In 10th USENIX Symposium on Operating Systems Design and Imple - mentation (OSDI 12). USENIX Association...
2012
-
[41]
Xiang (Jenny) Ren, Sitao Wang, Zhuqi Jin, David Lion, Ad rian Chiu, Tianyin Xu, and Ding Yuan. 2023. Relational Debug- ging — Pinpointing Root Causes of Performance Problems. In 17th USENIX Symposium on Operating Systems Design and Imple - mentation (OSDI 23) . USENIX Associat...
2023
-
[42]
Dominik Sobania, Martin Briesch, Carol Hanna, and Just yna Petke
-
[43]
Linhai Song and Shan Lu. 2014. Statistical debugging fo r real-world performance problems. SIGPLAN Not. 49, 10 (Oct. 2014), 561–578. https://doi.org/10.1145/2714064.2660234
2014
-
[44]
Linhai Song and Shan Lu. 2017. Performance diagnosis fo r inefficient loops. In Proceedings of the 39th International Conference on Soft- ware Engineering (Buenos Aires, Argentina) (ICSE ’17). IEEE Press, 370–380. https://doi.org/10.1109/ICSE.2017.41
2017 doi
-
[45]
Zian Su, Xiangzhe Xu, Ziyang Huang, Zhuo Zhang, Y apeng Y e, Jianjun Huang, and Xiangyu Zhang. 2024. CodeArt: Better Cod e Models by Attention Regularization When Symbols Are Lackin g. arXiv:2402.11842 [cs.SE] https://arxiv.org/abs/2402.11842
2024 arXiv
-
[46]
Zoltán Szebenyi, Felix Wolf, and Brian J. N. Wylie. 2009 . Space- efficient time-series call-path profiling of parallel applic ations. In Pro- ceedings of the Conference on High Performance Computing Network- ing, Storage and Analysis (Portland, Oregon) (SC ’09) . Association for...
2009
-
[47]
Hanzhuo Tan, Qi Luo, Jing Li, and Yuqun Zhang. 2024. LLM4Decompile: Decompiling Binary Code with Large Languag e Models. arXiv:2403.05286 [cs.PL] https://arxiv.org/abs/2403.05286
2024 arXiv
-
[48]
John Vilk and Emery D. Berger. 2018. BLeak: automatically debugging memory leaks in web applications. SIGPLAN Not. 53, 4 (June 2018), 15–29. https://doi.org/10.1145/3296979.3192376
2018
-
[49]
Chi, Quoc V
Jason Wei, Xuezhi Wang, Dale Schuurmans, Maarten Bosma , Brian Ichter, Fei Xia, Ed H. Chi, Quoc V . Le, and Denny Zhou. 2024. Chain- of-thought prompting elicits reasoning in large language m odels. In Proceedings of the 36th International Conference on Neural Informa- tion Pr...
2024
-
[50]
Lingmei Weng, Yigong Hu, Peng Huang, Jason Nieh, and Jun feng Y ang. 2023. Effective Performance Issue Diagnosis with Valu e- Assisted Cost Profiling. In Proceedings of the Eighteenth European Conference on Computer Systems (Rome, Italy) (EuroSys ’23) . As- sociation for Computi...
2023
-
[51]
Lingmei Weng, Peng Huang, Jason Nieh, and Junfeng Y ang. 2021. Argus: Debugging Performance Issues in Modern Desktop Appl ica- tions with Annotated Causal Tracing. In 2021 USENIX Annual Tech- nical Conference (USENIX ATC 21) . USENIX Association, 193–207. https://www.usenix.or...
2021
-
[52]
Chunqiu Steven Xia, Yuxiang Wei, and Lingming Zhang. 20 23. Au- tomated Program Repair in the Era of Large Pre-Trained Langu age Models. In Proceedings of the 45th International Conference on Soft- ware Engineering (Melbourne, Victoria, Australia) (ICSE ’23). IEEE Press, 1482–...
-
[54]
Xusheng Xiao, Shi Han, Dongmei Zhang, and Tao Xie. 2013. Context- sensitive delta inference for identifying workload-depen dent perfor- mance bottlenecks. In Proceedings of the 2013 International Sympo- sium on Software Testing and Analysis (Lugano, Switzerland) (ISSTA 2013). ...
2013
-
[55]
Danning Xie, Zhuo Zhang, Nan Jiang, Xiangzhe Xu, Lin Tan , and Xiangyu Zhang. 2024. ReSym: Harnessing LLMs to Recover Variable and Data Structure Symbols from Stripped Binaries. In Proceedings of the 2024 ACM SIGSAC Conference on Computer and Communications 15 Security
2024
-
[56]
Bissyandé, and Shunfu Jin
Boyang Y ang, Haoye Tian, Weiguo Pian, Haoran Yu, Haitao Wang, Jacques Klein, Tegawendé F. Bissyandé, and Shunfu Jin. 2024. CREF: An LLM-Based Conversational Software Repair Framework for Pro- gramming Tutors. In Proceedings of the 33rd ACM SIGSOFT Interna- tional Symposium on...
2024
-
[57]
Yhuelf. 2021. Diagnosing Bottlenecks with pg_stat_st atements. https://yhuelf.github.io/2021/09/30/pg_stat_stateme nts_bottleneck.html
2021
-
[58]
Ding Yuan, Haohui Mai, Weiwei Xiong, Lin Tan, Yuanyuan Z hou, and Shankar Pasupathy. 2010. SherLog: error diagnosis by co nnecting clues from run-time logs. In Proceedings of the Fifteenth International Conference on Architectural Support for Programming Languages and Operatin...
2010
-
[59]
Y ongle Zhang, Serguei Makarov, Xiang Ren, David Lion, a nd Ding Yuan. 2017. Pensieve: Non-Intrusive Failure Reproduction for Dis- tributed Systems using the Event Chaining Approach. In Proceedings of the 26th Symposium on Operating Systems Principles (Shanghai, China) (SOSP ’...
2017
-
[60]
Fang Zhou, Yifan Gan, Sixiang Ma, and Y ang Wang. 2018. wP erf: Generic Off-CPU Analysis to Identify Bottleneck Waiting Eve nts. In 13th USENIX Symposium on Operating Systems Design and Imple - mentation (OSDI 18) . USENIX Association, Carlsbad, CA, 527–543. https://www.usenix....
2018
-
[2023]
arXiv:2301.08653 [cs.SE] https://arxiv.org/abs/2301.08653
An Analysis of the Automatic Bug Fixing Performance of Chat- GPT. arXiv:2301.08653 [cs.SE] https://arxiv.org/abs/2301.08653
-
[2024]
In Proceedings of the IEEE/ACM 46th International Conference on Software Engineering (Lisbon, Portugal) (ICSE ’24)
Evaluating Large Language Models in Class-Level Code Gener- ation. In Proceedings of the IEEE/ACM 46th International Conference on Software Engineering (Lisbon, Portugal) (ICSE ’24) . Association for Computing Machinery, New Y ork, NY, USA, Article 81, 13 pages. https://doi.or...
Reviewed August 6, 2026 · model on record in the stance chip above.
Discussion (0). Sign in to comment.