REVIEW 2 major objections 5 minor 3 cited by
Early release of low-frequency atlas of continuous gravitational waves
T0 review · 2 major / 5 minor · reviewed 2026-08-06 · deepseek-v4-flash
Pith's one-line read A public atlas now sets the tightest all-sky upper limits on 20–200 Hz continuous gravitational waves, reaching worst-case strain below $10^{-25}$.
desk verdict Solid per-point upper limits and a genuinely useful data release; the flashier population-average comparison rests on a proxy that the paper itself tells you is not fully validated. read the letter →
The pith
A machine-rendered reading of the paper's core claim, the machinery that carries it, and where it could break.
The reading
What carries the argument
The central object is the atlas itself: a partition of the search space into 50 mHz frequency bands and Voronoi cells on the celestial sphere, each cell carrying an upper limit on $h_0$ and an SNR peak. The upper limits are computed with the universal statistics algorithm, which gives strict frequentist coverage without assuming a particular noise distribution. The new "lock-level" proxy is computed from a background-noise estimate for each cell and represents the signal strain required for the search to correctly report frequency and polarization for 95% of signals at that sky position. The proxy is deliberately insensitive to signals in the band, so it can be used to decide whether a parameter-space follow-up of an SNR peak is worthwhile.
What would settle it
For a frequency band where the worst-case upper limit is claimed below $10^{-25}$, inject simulated signals with strain $h_0$ above that limit, random sky positions, and worst-case linear polarization, re-run the search on the same O3 data, and count how many produce an SNR peak with the injected frequency recovered within 0.5 mHz; if fewer than 95% do, the frequentist coverage claim fails.
Extended reading notes
Core claim
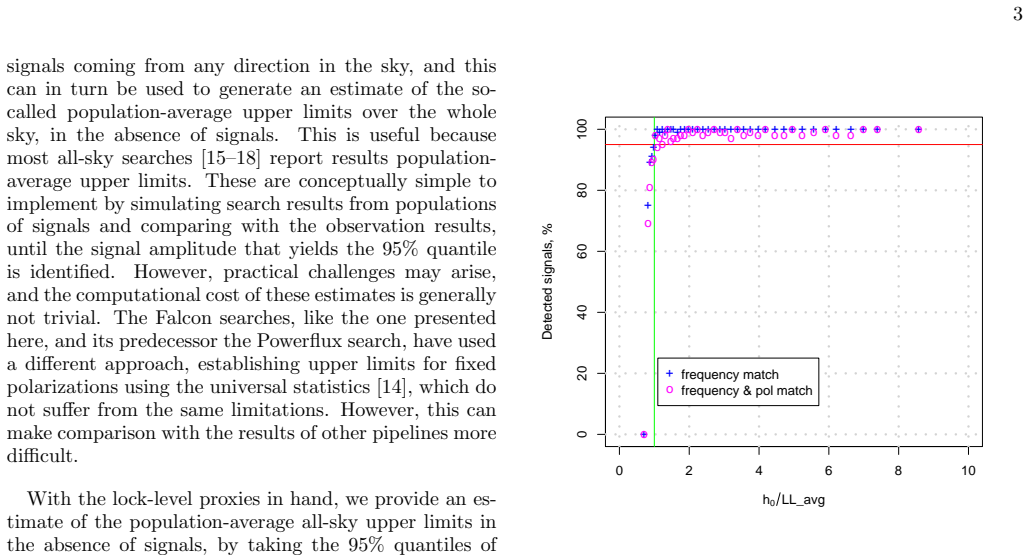
The paper's central claim is that it has carried out the most sensitive all-sky search for continuous gravitational waves in the 20–200 Hz band to date, using the full O3 dataset and a 2-day coherence length, and that the results are released as a public atlas. For each 50 mHz frequency band and each sky-position Voronoi cell, the atlas gives strict frequentist 95% confidence upper limits on the strain amplitude $h_0$, together with the SNR peak's frequency and polarization. The worst-case all-sky upper limits now drop below $10^{-25}$ at the most sensitive frequencies, about 30% better than the previous release, while the sky grid is six times finer. The atlas also defines a location-specific "lock-level" proxy: the strain at which 95% of signals from that sky location would have their frequency and polarization correctly reported in the atlas's SNR peak. Taking the 95% quantile of these proxies over the sky gives a population-average upper-limit estimate at 90% confidence, intended for comparison with other pipelines and not as a formal upper limit.
Load-bearing premise
The search assumes every plausible continuous-wave source's frequency evolution over a year is described by $|f_1|\le 5\times10^{-11}$ Hz/s and $|f_2|\le 10^{-20}$ Hz/s$^2$, and that a 2-day coherence length safely absorbs any higher-order frequency derivatives; a source with stronger spin-down would lie outside the atlas's coverage.
Editorial extensions
If this is right
- The public atlas lets any search team directly read off, for any sky position and 50 mHz band, the strain above which a continuous gravitational wave would have been loud enough to appear in the SNR peaks.
- The sub-$10^{-25}$ worst-case limits in the most sensitive band are the tightest all-sky bounds reported there, so any future claim of a signal in this band must face this constraint.
- The lock-level proxy gives a per-cell map of follow-up worthiness, allowing limited computational resources to be spent where parameter recovery is reliable rather than on noise-dominated cells.
- Because the data are released before the full follow-up is finished, candidate follow-up and population studies can proceed in parallel with the final analysis.
- The population-average proxy provides a common basis for sensitivity comparisons with other pipelines, while the formal upper limits remain the correct frequentist quantities.
Reading between the lines
- If the atlas's coverage extends to boson-cloud and wide-binary sources as the authors suggest, the same released upper limits could be reinterpreted as constraints on those exotic source classes without rerunning the search.
- A natural next step would be to use the sky-position-dependent polarization coefficients to produce upper limits for arbitrary source orientations on demand, turning the static atlas into a queryable sensitivity service.
- The 100 Hz band's artifact contamination, already visible in the spot-check, implies that per-cell lock-level maps could serve as a detector-health diagnostic, flagging bands where instrumental lines compromise parameter recovery.
- The early-release workflow itself is testable: if a loud candidate found in the released SNR peaks is later confirmed by the follow-up analysis, that validates the practice of using the pre-follow-up atlas for prioritisation.
Editorial analysis
A structured set of objections, weighed in public.
Referee Report
Summary. This paper releases the low-frequency atlas of continuous gravitational waves covering 20-200 Hz, frequency derivatives |f1| <= 5e-11 Hz/s and |f2| <= 1e-20 Hz/s^2, built from the full LIGO O3 data with two-day coherence lengths. For each 50 mHz frequency band and sky-position Voronoi cell, the atlas provides frequentist 95% confidence upper limits on strain, computed with the universal statistics algorithm, together with the SNR peaks and their recovered parameters. The paper also introduces a location-specific polarization-average lock-level proxy and uses its 95% quantile over the sky to define an all-sky population-average sensitivity curve. The atlas data and example R scripts are publicly released.
Significance. The per-point frequentist upper limits are credible: they use the established universal statistics method, and the three hardware injections inside the searched parameter space (Table I rows 3, 5, and 11) all satisfy UL/h0 > 100%, providing an end-to-end validation of the upper-limit pipeline. The public data release with example scripts is a valuable community resource. The population-average lock-level proxy is a practically useful and clearly motivated concept, but it is not a direct upper limit and its validation is incomplete. The headline claim of being the most sensitive all-sky search to date rests on this proxy, so the result is significant if the proxy is reliable across the full band, but the current evidence only directly supports it for part of the band.
major comments (2)
- [Section V and Figure 1] The conclusion that this is 'the most sensitive all-sky search to date' rests on the Falcon population-average proxy curve in Figure 1, not on direct upper-limit measurements. The proxy is validated only with test signals in the 100-200 Hz band (Figure 2) and spot-checked only in the 100-101 Hz band (Table II), where one band (100.003-100.054 Hz) fails to reach the 90% lock rate because of detector artifacts. The paper itself states that 'computationally expensive test-signal recovery simulations would be required to determine the actual confidence associated with the values in each band.' Without such validation across 20-100 Hz and in other artifact-contaminated bands, the wide-band comparison with other pipelines may overstate sensitivity. Please either validate the proxy over the full band or explicitly qualify the 'most sensitive' claim as provisional and restricted to the validated range.
- [Section IV and Figure 1] The population-average proxy is defined as the strain at which 95% of signals have correctly recovered parameters at a given sky location, and the all-sky curve is the 95% quantile of these location-specific proxies, described as a 90% confidence level. This is a different statistical quantity from the frequentist 95% confidence upper limits reported by the other pipelines (e.g., refs. [15-18]) with which it is compared in Figure 1. Directly overlaying these curves and using them to claim superiority conflates a proxy for 'lock-on' with a rigorous upper limit. The text should state explicitly what this comparison can and cannot establish, and should avoid using the phrase 'most sensitive' as if it were established by an apples-to-apples measurement.
minor comments (5)
- [Figure 2] The caption states that the frequency match criterion is 0.2 mHz, while Section IV and Table I use 0.5 mHz as the expected frequency offset tolerance. Please align these tolerances or explain the difference.
- [Section II] The claim that higher-order frequency derivatives are covered by the 'intrinsic robustness' of a 2-day coherence search is asserted without supporting tests or citations. Since this is an assumption about search sensitivity, a brief justification or reference would help.
- [References] Reference [12] contains the placeholder text 'number will be inserted by publisher'; this must be resolved before final publication.
- [Abstract and Section V] The phrase 'most sensitive all-sky search to date' appears without the caveat, stated in Section IV, that this comparison is based on the population-average proxy rather than on direct upper limits. Adding that qualifier in the abstract and conclusion would prevent misreading.
- [Figure 1 caption] The caption says 'The upper limits reflect the sensitivity of the search,' but the Falcon pop avg curve is not an upper limit; it is a proxy. The caption should distinguish upper-limit curves from proxy curves to avoid ambiguity.
Circularity Check
No significant circularity: the central upper limits are injection-validated measurements, and the lock-level proxies are not used to derive the primary results.
full rationale
The primary product is a set of per-frequency, per-sky-point frequentist 95% confidence upper limits computed with the universal statistics algorithm [14]. This is a self-citation, but it is not load-bearing circularity: the method is external to the present atlas, and the paper provides an end-to-end independent check via hardware injections inside the searched parameter space (Table I rows 3, 5, and 11 all have UL/h0 > 100%). The lock-level proxy is defined as the strain at which 95% of signals are recovered, and Figure 2 validates that a noise-derived estimate achieves that defining property; this is a calibration/consistency check, not a derivation of the proxy from the recovery data. The population-average curve is explicitly built as the 95% quantile of these location-specific proxies, giving an expected 90% lock rate; Table II spot-checks that arithmetic end-to-end. The paper's own concession that full test-signal simulations would be needed to establish per-band confidence, and the failure of the contaminated 100.003-100.054 Hz band, are limitations on the headline sensitivity comparison, not circular reductions. Nothing in the derivation chain reduces by construction to its own inputs.
Assumptions & free parameters
assumptions (3)
- domain assumption Continuous wave sources are modeled with at most a second frequency derivative bounded by 1e-20 Hz/s2.
- domain assumption Searches with 2-day coherence lengths are intrinsically robust to higher-order frequency derivatives.
- domain assumption The universal statistics algorithm computes valid frequentist upper limits for the observed noise distribution.
Cite this review
Pith. "Pith review of Early release of low-frequency atlas of continuous gravitational waves." pith.science (2026). https://pith.science/paper/LNIFL3TG
@misc{pith2026250712161,
  author       = {Pith},
  title        = {Pith review of: Early release of low-frequency atlas of continuous gravitational waves},
  year         = {2026},
  howpublished = {\url{https://pith.science/paper/LNIFL3TG}},
  note         = {Machine review of arXiv:2507.12161}
}
read the original abstract
We present the public release of the low-frequency atlas of continuous gravitational waves, covering signals with frequencies from 20 Hz to 200 Hz and frequency derivatives from -5e-11 to 5e-11 Hz/s. Compared to the previous atlas releases, this version demonstrates significant improvements in sensitivity and sky resolution. In the most sensitive region even the worst-case upper limits on gravitational wave strain are below 1e-25. The atlas data is being released ahead of the completion of the full follow-up analysis.
Figures


Figures from the paper (2 more)


Forward citations
Cited by 3 Pith papers
-
First Constraints on the Ellipticities of Self-Interacting Fermionic Dark Matter Admixed Neutron Stars from Continuous Gravitational-Wave Searches
Using LIGO O3 continuous-wave search data, the authors place the first constraints on ellipticities of self-interacting fermionic dark matter admixed neutron stars and exclude regions of the DM parameter space for mas...
-
Search for continuous gravitational waves from the pulsar J0435+3233
A LIGO O4a search for continuous gravitational waves from millisecond pulsar J0435+3233 finds no signal, setting h0<5.8×10^-27 at 95% confidence and an ellipticity limit of 1.6×10^-8.
-
High-frequency continuous gravitational waves searched in LIGO O3 public data with Einstein@Home
An all-sky Einstein@Home search of LIGO O3 data records no continuous gravitational waves between 800 and 1686 Hz and sets the best upper limits to date on neutron star ellipticity and r-mode amplitude there.
Reference graph
Works this paper leans on
-
[1]
Vladimir Dergachev and Maria Alessandra Papa, Frequency-Resolved Atlas of the Sky in Continuous Grav- itational Waves, Phys. Rev. X 13, 021020 (2023)
work page 2023
-
[2]
Vladimir Dergachev and Maria Alessandra Papa, Early release of the expanded atlas of the sky in continuous gravitational waves, Phys. Rev. D 109, 022007 (2024) 5 SNR RA Dec 360 330 300 270 240 210 180 150 120 90 60 30 0 −90 −60 −30 0 30 60 90 + ++ + + + + + + + + + + ++ ++ ++ + ++ + + + + + + 8.0 17.1 26.2 35.3 44.4 53.5 62.6 71.7 80.8 89.9 99.0 FIG. 5. T...
work page 2024
-
[3]
Vladimir Dergachev and Maria Alessandra Papa, Ex- panded atlas of the sky in continuous gravitational waves, arXiv:2503.11512 [gr-qc]
-
[4]
The O3a Data Release https://doi.org/10.7935/ nfnt-hm34
-
[5]
The O3b Data Release https://doi.org/10.7935/ pr1e-j706
-
[6]
location-specific polarization-average lock- level proxy
data. Additionally, we include signal-to-noise ratio (SNR) peaks and their associated parameters. II. SIGNAL MODEL Continuous gravitational waves are expected from rapidly rotating neutron stars with sustained non- axisymmetric deformation ε. The intrinsic amplitude of the gravitational wave signal at a distance d from the source is proportional to the de...
arXiv 2019
-
[7]
J. Aasi et al. (LIGO Scientific Collaboration), Advanced LIGO, Class. Quantum Grav. 32 7 (2015)
work page 2015
-
[8]
A. Singh, M. A. Papa and V. Dergachev, Characterizing the sensitivity of isolated continuous gravitational wave searches to binary orbits, Phys. Rev. D 100 (2019) no.2, 024058 doi:10.1103/PhysRevD.100.024058
Show all 19 references
-
[9]
Baryakhtar, R
M. Baryakhtar, R. Lasenby, M. Teo, Black Hole Super- radiance Signatures of Ultralight Vectors, Phys. Rev. D 96, 035006s (2017)
2017
-
[10]
Arvanitaki, M
A. Arvanitaki, M. Baryakhtar, R. Lasenby, S. Dimopou- los, S. Dubovsky, Black Hole Mergers and the QCD Ax- ion at Advanced LIGO, Phys. Rev. D 95, 043001 (2017)
2017
-
[11]
Arvanitaki, M
A. Arvanitaki, M. Baryakhtar, and X. Huang, Discov- ering the QCD axion with black holes and gravitational waves, Phys. Rev. D 91, 084011 (2015)
2015
-
[12]
S. J. Zhu, M. Baryakhtar, M. A. Papa, D. Tsuna, N. Kawanaka and H. Eggenstein, Characterizing the continuous gravitational-wave signal from boson clouds around Galactic isolated black holes, Phys. Rev. D 102, 063020 (2020)
2020
-
[13]
[number will be inserted by publisher] for numerical values of upper limits
See EPAPS Document No. [number will be inserted by publisher] for numerical values of upper limits. Also at https://www.aei.mpg.de/continuouswaves/ O3fFalcon20-200 including the full atlas
-
[14]
Vladimir Dergachev, Efficient representations of upper limits and confidence intervals for experimental data, Phys. Rev. D 110, 085001 (2024)
2024
-
[15]
Dergachev, A Novel Universal Statistic for Computing Upper Limits in Ill-behaved Background, Phys
V. Dergachev, A Novel Universal Statistic for Computing Upper Limits in Ill-behaved Background, Phys. Rev. D 87, 062001 (2013)
2013
-
[16]
Steltner, M
B. Steltner, M. A. Papa, H. B. Eggenstein, R. Prix, M. Bensch, B. Allen and B. Machenschalk, Deep Ein- stein@Home All-sky Search for Continuous Gravitational Waves in LIGO O3 Public Data, Astrophys. J.952, no.1, 55 (2023)
2023
-
[17]
Einstein@Home all-sky
B. McGloughlin, J. Martins, B. Steltner, M. A. Papa, H. B. Eggenstein, B. Machenschalk, R. Prix and M. Ben- sch, “Einstein@Home all-sky ”bucket” search for con- tinuous gravitational waves in LIGO O3 public data,” [arXiv:2508.16423 [gr-qc]]
-
[18]
High-frequency continuous gravita- tional waves searched in LIGO O3 public data with Ein- stein@Home,
B. McGloughlin, B. Steltner, J. Martins, M. A. Papa, H. B. Eggenstein, J. Ming, B. Machenschalk, R. Prix and M. Bensch, “High-frequency continuous gravita- tional waves searched in LIGO O3 public data with Ein- stein@Home,” [arXiv:2508.20073 [gr-qc]]
-
[19]
signal-lock
R. Abbott et al.(LIGO Scientific Collaboration, Virgo Collaboration and KAGRA Collaboration), All-sky search for continuous gravitational waves from isolated neutron stars using Advanced LIGO and Advanced Virgo O3 data, Phys. Rev. D 106, 102008 (2022) 6 Band start Band stop SN...
2022
Reviewed August 6, 2026 · model on record in the stance chip above.
Discussion (0). Sign in to comment.