Defect-Mediated Aggregation and Motility-Induced Phase Separation in Self-Propelled Lattice-Gas Active XY Model
Pith reviewed 2026-05-19 03:35 UTC · model grok-4.3
The pith
Self-propulsion in the active XY model causes particles to aggregate around positive vortex defects, producing motility-induced phase separation whose relaxation time scales as the cube of system size.
A machine-rendered reading of the paper's core claim, the machinery that carries it, and where it could break.
Core claim
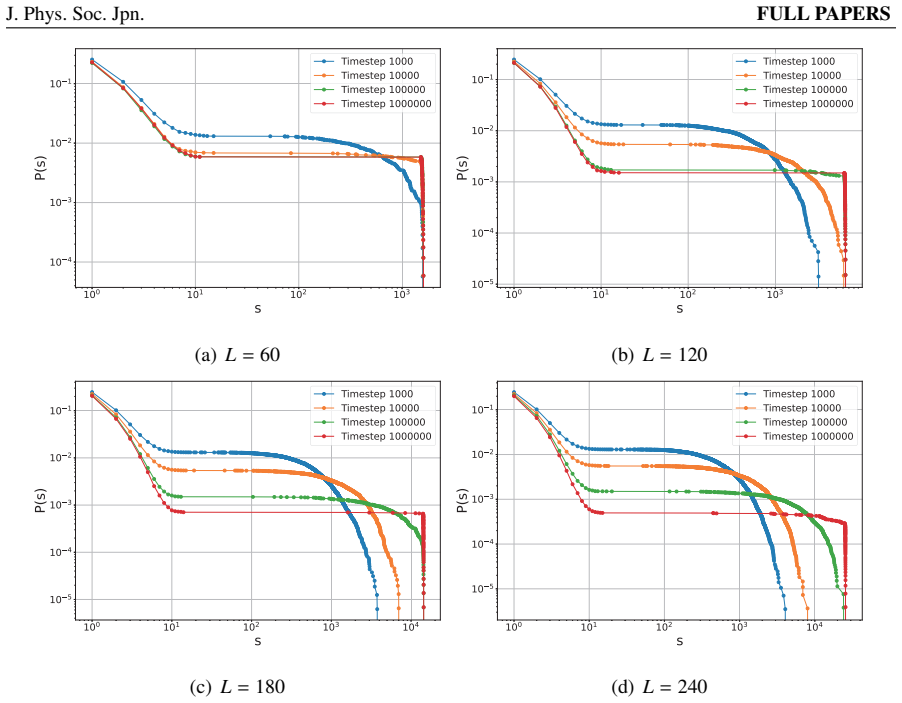
In the proposed active XY model, self-propulsion induces motility-induced phase separation in which particles form clusters that nucleate and grow around topological defects possessing positive vortex charge. Defects carrying negative charge instead dissipate without forming stable aggregates. The temporal evolution of cluster size proceeds via two distinct exponential relaxation stages, and the associated characteristic time scales as τ ∼ L³ with system size L, a dependence that mirrors the kinetics of first-order phase separation in equilibrium systems.
What carries the argument
The self-propulsion parameter that imposes a directional bias on particle hops, acting together with the lattice-gas update rules to make positive-vortex-charge defects stable sites for particle accumulation.
If this is right
- Positive vortex defects act as persistent nucleation centers for dense clusters while negative defects are transient and do not support aggregation.
- Cluster growth occurs in two successive exponential stages whose duration is controlled by system size.
- The L³ scaling of the relaxation time places the nonequilibrium clustering process in the same dynamical class as equilibrium first-order phase separation.
- Topological defects therefore function as the microscopic agents that convert uniform self-propulsion into macroscopic phase separation.
Where Pith is reading between the lines
- If the same defect selectivity survives in off-lattice or hydrodynamic versions of the model, defect charge could serve as a general predictor of clustering locations across many active-matter systems.
- The observed L³ scaling suggests that defect-mediated MIPS may exhibit finite-size effects that are experimentally measurable in microfluidic or colloidal active-matter setups of varying container size.
- One could test whether adding explicit hydrodynamic interactions alters the two-stage relaxation or merely rescales the prefactor in the L³ law.
Load-bearing premise
The discrete lattice rules and the chosen form of self-propulsion bias are sufficient to capture the essential defect dynamics and clustering behavior of real active matter.
What would settle it
A set of larger-system simulations in which the measured relaxation time fails to grow proportionally to L³ or in which negative-charge defects remain stable and nucleate clusters would contradict the reported scaling and defect selectivity.
Figures


read the original abstract
We propose an ``active XY model'' that incorporates key elements of both the classical XY model and the Vicsek model to study the role of topological defects in active matter systems. This model features self-propelled particles with XY spin degrees of freedom on a lattice and introduces a self-propulsion parameter controlling the directional bias of particle motion. Using numerical simulations, we demonstrate that self-propulsion induces motility-induced phase separation (MIPS), where particles aggregate into clusters around topological defects with positive vortex charge. In contrast, negative charge defects tend to dissipate. We analyze the evolution of these clusters and show that their growth follows a two-stage exponential relaxation process, with characteristic time scaling as $\tau \sim L^{3}$ with the system size $L$, reminiscent of first-order phase separation in equilibrium systems. Our results highlight the important role of topological defects in phase separations and clustering behavior in active systems, bridging nonequilibrium dynamics and equilibrium theory.
Editorial analysis
A structured set of objections, weighed in public.
Referee Report
Summary. The manuscript introduces a lattice-based active XY model combining elements of the classical XY model and the Vicsek model, controlled by a self-propulsion parameter. Numerical simulations show that self-propulsion induces motility-induced phase separation (MIPS), with particles aggregating into clusters around topological defects of positive vortex charge while negative-charge defects dissipate. Cluster growth is reported to follow a two-stage exponential relaxation whose characteristic time scales as τ ∼ L³ with system size L, analogous to first-order phase separation in equilibrium systems.
Significance. If the numerical observations prove robust, the work provides a useful lattice platform for examining how topological defects mediate clustering and phase separation in active matter. The reported L³ scaling for the relaxation time offers a concrete link to equilibrium first-order transition kinetics and could stimulate further studies of defect-driven nonequilibrium dynamics.
major comments (2)
- [Model Definition and Simulation Setup] Model and simulation sections: the assignment of local vorticity via plaquette angle sums and the subsequent classification into positive versus negative defects is central to the claim that only positive-charge defects nucleate stable MIPS clusters. No systematic variation of the vorticity cutoff, plaquette size, or coarse-graining length is described, nor is a comparison to an off-lattice or continuum implementation provided; without these controls the reported positive/negative distinction and the associated aggregation may contain lattice-scale artifacts.
- [Results on Cluster Growth and Scaling] Results on cluster evolution: the two-stage exponential fit and the τ ∼ L³ scaling are load-bearing for the analogy to equilibrium first-order phase separation. The manuscript does not report checks for robustness against finite-size effects, alternative initial conditions, or variations in the self-propulsion parameter range; these omissions leave open whether the scaling is an intrinsic feature of the active dynamics or sensitive to the chosen simulation protocol.
minor comments (2)
- [Abstract] Abstract: the phrase 'reminiscent of first-order phase separation in equilibrium systems' would benefit from a brief citation or explicit comparison to a specific equilibrium model (e.g., Ising or lattice gas).
- [Figures and Captions] Figure captions and text: ensure that error bars or standard deviations are shown for all reported scaling exponents and relaxation times.
Simulated Author's Rebuttal
We thank the referee for the thorough review and for recognizing the potential of our active XY model in studying defect-mediated dynamics in active matter. We address each major comment below and outline the revisions we will make to strengthen the manuscript.
read point-by-point responses
-
Referee: Model and simulation sections: the assignment of local vorticity via plaquette angle sums and the subsequent classification into positive versus negative defects is central to the claim that only positive-charge defects nucleate stable MIPS clusters. No systematic variation of the vorticity cutoff, plaquette size, or coarse-graining length is described, nor is a comparison to an off-lattice or continuum implementation provided; without these controls the reported positive/negative distinction and the associated aggregation may contain lattice-scale artifacts.
Authors: We agree that additional controls would enhance the robustness of our findings regarding the role of positive versus negative defects. In the revised version, we will include a systematic study varying the vorticity cutoff threshold (e.g., from 0.5 to 2.0 in units of 2π) and plaquette sizes. We will also perform simulations with different coarse-graining lengths to confirm that the aggregation around positive defects persists. While a full off-lattice comparison is beyond the scope of this lattice-focused study, we will add a brief discussion of how our results relate to continuum active matter models with topological defects. revision: yes
-
Referee: Results on cluster evolution: the two-stage exponential fit and the τ ∼ L³ scaling are load-bearing for the analogy to equilibrium first-order phase separation. The manuscript does not report checks for robustness against finite-size effects, alternative initial conditions, or variations in the self-propulsion parameter range; these omissions leave open whether the scaling is an intrinsic feature of the active dynamics or sensitive to the chosen simulation protocol.
Authors: We appreciate this point and will strengthen the results section accordingly. We will add data for multiple system sizes to better demonstrate finite-size scaling, include results from different initial conditions (e.g., random vs. clustered starts), and explore a broader range of self-propulsion parameters to show that the τ ∼ L³ scaling is robust. These additions will support the analogy to equilibrium first-order kinetics more convincingly. revision: yes
Circularity Check
No circularity: results are direct simulation outputs on an explicitly defined lattice model
full rationale
The paper defines an active XY lattice-gas model with explicit self-propulsion bias and update rules, then reports observations from numerical simulations including defect charge assignment, cluster aggregation around positive vortices, negative defect dissipation, two-stage exponential growth, and τ ∼ L³ scaling. These quantities are computed directly from the simulated configurations and time series; no analytical derivation, parameter fitting to a target observable, or self-citation chain is invoked to obtain the central claims. The model and measurement protocols are self-contained and externally falsifiable by rerunning the simulations, satisfying the criteria for a non-circular finding.
Axiom & Free-Parameter Ledger
free parameters (1)
- self-propulsion parameter
axioms (2)
- domain assumption Particles on lattice interact via nearest-neighbor XY spin alignment rules
- domain assumption Self-propulsion adds a directional bias to particle hops without altering spin interactions
invented entities (1)
-
active XY model
no independent evidence
Lean theorems connected to this paper
-
IndisputableMonolith/Foundation/AlexanderDuality.leanalexander_duality_circle_linking unclear?
unclearRelation between the paper passage and the cited Recognition theorem.
We propose an “active XY model” … topological defects with positive vortex charge … τ ∼ L^3 … reminiscent of first-order phase separation
-
IndisputableMonolith/Foundation/RealityFromDistinction.leanreality_from_one_distinction unclear?
unclearRelation between the paper passage and the cited Recognition theorem.
m = 1/2π ∮ ∇θ · dℓ … N = N_{+1} − N_{−1}
What do these tags mean?
- matches
- The paper's claim is directly supported by a theorem in the formal canon.
- supports
- The theorem supports part of the paper's argument, but the paper may add assumptions or extra steps.
- extends
- The paper goes beyond the formal theorem; the theorem is a base layer rather than the whole result.
- uses
- The paper appears to rely on the theorem as machinery.
- contradicts
- The paper's claim conflicts with a theorem or certificate in the canon.
- unclear
- Pith found a possible connection, but the passage is too broad, indirect, or ambiguous to say the theorem truly supports the claim.
Reference graph
Works this paper leans on
-
[1]
M. C. Marchetti, J. F. Joanny, S. Ramaswamy, T. B. Liverpool, J. Prost, M. Rao, and R. A. Simha: Reviews of Modern Physics 85 (2013) 1143
work page 2013
-
[2]
C. Bechinger, R. Di Leonardo, H. L ¨owen, C. Reichhardt, G. V olpe, and G. V olpe: Re- views of Modern Physics 88 (2016) 045006
work page 2016
-
[3]
J. L. Toner: The Physics of Flocking: Birth, Death, and Flight in Active Matter (Cam- bridge University Press, Cambridge, 2024)
work page 2024
-
[4]
C. W. Reynolds: ACM SIGGRAPH Computer Graphics 21 (1987) 25
work page 1987
-
[5]
N. Shimoyama, K. Sugawara, T. Mizuguchi, Y . Hayakawa, and M. Sano: Physical Re- view Letters 76 (1996) 3870
work page 1996
-
[6]
Niwa: Journal of Theoretical Biology 181 (1996) 47
H.-S. Niwa: Journal of Theoretical Biology 181 (1996) 47
work page 1996
- [7]
- [8]
-
[9]
M. S. Kumar and P. Philominathan: Biophysical Reviews 2 (2010) 13
work page 2010
-
[10]
D. Nishiguchi, S. Shiratani, K. A. Takeuchi, and I. S. Aranson: Proceedings of the Na- tional Academy of Sciences 122 (2025) e2414446122
work page 2025
- [11]
- [12]
- [13]
-
[14]
H. E. Stanley: Physical Review Letters 20 (1968) 589
work page 1968
- [15]
-
[16]
J. M. Kosterlitz and D. J. Thouless: Journal of Physics C: Solid State Physics 6 (1973) 1181
work page 1973
-
[17]
J. M. Kosterlitz: Journal of Physics C: Solid State Physics 7 (1974) 1046
work page 1974
-
[18]
V . L. Berezinskii: Soviet Physics JETP32 (1971) 493
work page 1971
-
[19]
V . L. Berezinskii: Soviet Physics JETP34 (1972) 610
work page 1972
-
[20]
D. R. Nelson: Defects and Geometry in Condensed Matter Physics (Cambridge Univer- sity Press, Cambridge, 2002). 27/28 J. Phys. Soc. Jpn. FULL PAPERS
work page 2002
-
[21]
S. Shankar, A. Souslov, M. J. Bowick, M. C. Marchetti, and V . Vitelli: Nature Reviews Physics 4 (2022) 380
work page 2022
-
[22]
M. E. Cates and J. Tailleur: Annual Review of Condensed Matter Physics 6 (2015) 219
work page 2015
-
[23]
M. Kourbane-Houssene, C. Erignoux, T. Bodineau, and J. Tailleur: Physical Review Letters 120 (2018) 268003
work page 2018
- [24]
- [25]
- [26]
- [27]
-
[28]
Toner: Physical Review E 86 (2012) 031918
J. Toner: Physical Review E 86 (2012) 031918
work page 2012
- [29]
- [30]
-
[31]
R. A. Fisher and F. Yates: Statistical tables for biological, agricultural and medical research (Edinburgh: Oliver and Boyd, 1963)
work page 1963
-
[32]
D. E. Knuth: The Art of Computer Programming, volume 2 Seminumerical Algorithms (Addison-Wesley, Reading, Massachusetts, 1998) 3rd ed
work page 1998
- [33]
-
[34]
I. Lifshitz and V . Slyozov: Journal of Physics and Chemistry of Solids19 (1961) 35
work page 1961
-
[35]
P. M. Chaikin and T. C. Lubensky:Principles of Condensed Matter Physics (Cambridge University Press, 1995)
work page 1995
-
[36]
Baldan: Journal of Materials Science 37 (2002) 2171
A. Baldan: Journal of Materials Science 37 (2002) 2171
work page 2002
-
[37]
A. G. Thompson, J. Tailleur, M. E. Cates, and R. A. Blythe: Journal of Statistical Me- chanics: Theory and Experiment 2011 (2011) P02029
work page 2011
-
[38]
K. Adachi and K. Kawaguchi: arXiv preprint arXiv:2012.02517 (2020)
-
[39]
J. Stenhammar, A. Tiribocchi, R. J. Allen, D. Marenduzzo, and M. E. Cates: Physical Review Letters 111 (2013) 145702. 28/28
work page 2013
discussion (0)
Sign in with ORCID, Apple, or X to comment. Anyone can read and Pith papers without signing in.