REVIEW 3 major objections 5 minor 63 references
Vibrational Modes in Strongly Deformed Nuclei
T0 review · 3 major / 5 minor · reviewed 2026-08-06 · deepseek-v4-flash
Pith's one-line read Genuine beta and gamma vibrations are identified above the rotational gamma band in 166Er and 162Dy.
desk verdict New PT-plot diagnostic plus state-of-the-art MCSM calculations make a plausible but not yet solid case for gamma and beta vibrations in 166Er and 162Dy; the vibrational assignments rest on phase patterns whose gauge invariance is not demonstrated. read the letter →
The pith
A machine-rendered reading of the paper's core claim, the machinery that carries it, and where it could break.
The reading
What carries the argument
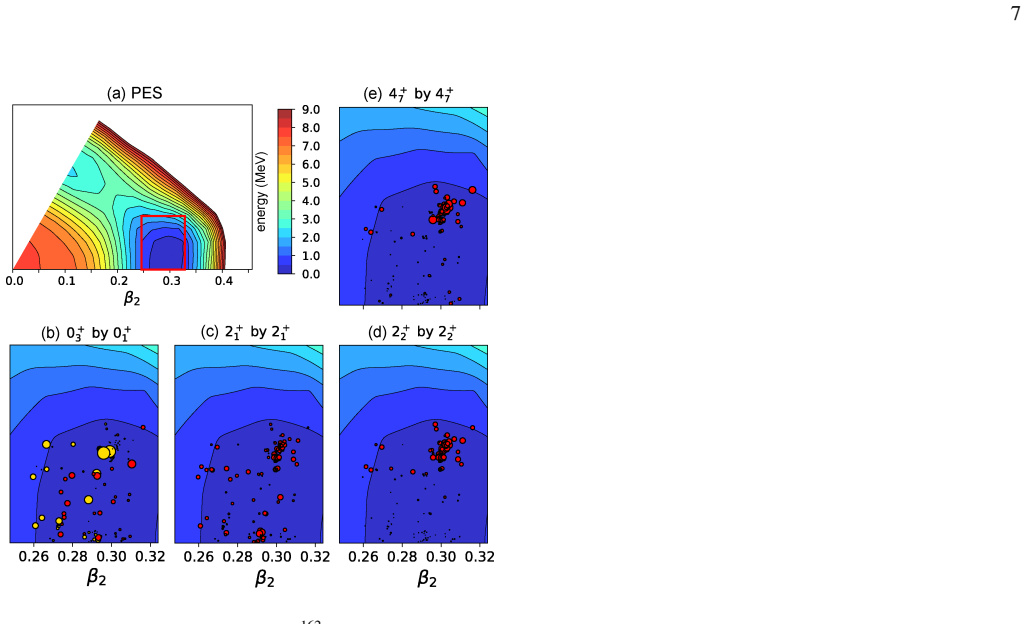
The key instrument is the phase-specified T-plot (PT-plot). A T-plot places a circle at the $(\beta_2,\gamma)$ deformation of each basis vector, with circle area proportional to the squared amplitude in the eigenstate; the PT-plot additionally colours each circle by the sign of the real part of the amplitude relative to a chosen reference state, computed through overlaps of the orthonormalised basis vectors. Because the amplitudes are predominantly real for the states of interest, the red/yellow sign pattern is meaningful. The work of the PT-plot is to display a node: when a state's amplitudes switch sign along $\gamma$ or $\beta_2$, the state is read as the first excited wave function of a harmonic oscillator in that coordinate, i.e. a one-phonon vibrational excitation. The reference state is chosen state by state; for example, the $2^+_5$ state is plotted against the $2^+_2$ state, not the $2^+_1$ state, because the $2^+_2$ state is the rotational partner of the ground state and the $2^+_1$ is not.
What would settle it
Measure the gamma-decay branch from the $0^+_3$ state in $^{166}$Er: the calculation predicts $B(E2;0^+_3\rightarrow2^+_2)=9.8$ W.u., so a much weaker experimental transition would contradict the assignment; equally, recompute the PT-plot with a different reference state or with an enlarged basis and check whether the red-to-yellow sign boundary in $\gamma$ stays at the same deformation.
Extended reading notes
Core claim
On the paper's own terms, the central discovery is that $\beta$- and gamma-vibrational modes are real, identifiable excitations in strongly deformed heavy nuclei, and that the traditional labelling missed them because the low-lying gamma band is actually a rotational excitation of a triaxial intrinsic state. In $^{166}$Er the $0^+_3$ state shows a one-node amplitude pattern in the $\gamma$ coordinate relative to the $0^+_1$ ground state, making it the $K^P=0^+$ gamma-vibrational band head; the $2^+_5$ state shows the same pattern relative to the $2^+_2$ triaxial rotational state, making it a gamma vibration on top of that state. In $^{162}$Dy the $0^+_2$ state shows a one-node pattern in the $\beta_2$ coordinate (a $\beta$ vibration), and the $0^+_6$ state shows a gamma vibration. The authors further find that the $K^P=0^+$ vibrational band lies below the $K^P=2^+$ vibrational band because of the $K$-splitting of the triaxial intrinsic state, and that the $0^+$ gamma-vibrational head decays strongly to the $2^+_\gamma$ state, a decay that could be misread as a double-gamma-phonon signature.
Load-bearing premise
The load-bearing premise is that a sign change in the PT-plot, measured against a chosen reference state, truly marks a node of the collective wave function in the $\gamma$ or $\beta_2$ coordinate; if the reference-state convention or the orthogonalisation is unstable, the vibrational assignment would not be established.
Editorial extensions
If this is right
- The $0^+_3$ state in $^{166}$Er should be re-labelled as a $K^P=0^+$ gamma vibration rather than a double-gamma-phonon candidate; its strong decay to the $2^+_2$ state follows from single-phonon vibrational character.
- The $0^+_2$ state in $^{162}$Dy is a beta vibration whose rotational band includes the $2^+_3$ state, while the $0^+_6$ state is a gamma vibration on top of the ground state.
- Genuine vibrational band heads in these nuclei typically appear above the rotational gamma band, with the notable exception of the $^{162}$Dy beta band, which sits low.
- Shape-coexistence states, such as the $0^+_2$ state in $^{166}$Er, can appear at even lower energies than vibrational band heads, so spectroscopy in this region must separate vibrational from coexisting deformed configurations.
- In $^{166}$Er the $2^+_5$ state is a prediction of a gamma vibration on top of the triaxial $2^+_2$ band, giving a concrete experimental target.
Reading between the lines
- If the PT-plot sign-change criterion is a true nodal diagnostic, the same method could be applied across the deformed rare-earth and actinide regions; one testable prediction is that a low beta band will appear only where the potential energy surface is wide along $\beta_2$, and will be absent where it is narrow.
- A natural generalisation is to require the node location to be stable when several different reference states are used for the same eigenstate; that would turn the current diagnostic into a quantitative test of anharmonicity.
- If these assignments are right, the traditional beta- and gamma-phonon counting in deformed nuclei needs revision: measured $B(E2)$ branchings that have been attributed to double-phonon states may in some cases be single-phonon decays from a $K^P=0^+$ gamma vibration.
Signed reviews
Editorial analysis
A structured set of objections, weighed in public.
Referee Report
Summary. The manuscript presents a large-scale QVSM/MCSM study of 166Er and 162Dy and introduces an extension of the T-plot, termed the phase-specified T-plot (PT-plot), in which the real part of the overlap between K-integrated basis states of a reference and a target eigenstate is used to color circles at each basis vector's (β2, γ) position. Based on a red/yellow sign pattern and a harmonic-oscillator analogy, the authors identify the 0+3 state of 166Er as a K^P = 0+ gamma vibration built on the ground state, the 2+5 state as a gamma vibration built on the 2+2 state, the 0+2 state of 162Dy as a beta vibration, and the 0+6 state as a gamma vibration; shape-coexistence bands are also discussed. Energies and selected B(E2) values are compared with experiment.
Significance. The result is potentially significant for the nuclear structure of heavy deformed nuclei: it argues that genuine vibrational modes appear above the rotational gamma band, and that the traditional double-gamma-phonon 0+ interpretation may be a single gamma-vibrational phonon in a triaxial context. The underlying QVSM/MCSM calculations are state of the art (Hilbert spaces of dimension about 10^33), and the energies and B(E2) values are genuine outputs of the shell-model Hamiltonian, not fitted to the vibrational observables; some predictions have experimental counterparts, e.g., B(E2; 4+γγ → 2+2) ≈ 8.4 W.u. in 162Dy and the predicted strong decay of the 0+3 state in 166Er to the 2+2 state. The novelty is high if the identification holds. However, the central classification currently rests on a qualitative visual pattern, so the significance is conditional on making that pattern quantitative and phase-convention independent.
major comments (3)
- [End Matter, Eq. (3); Fig. 2(c); footnote [61]] The PT-plot color is defined as the real part of ⟨tilde φ_i^(R)|tilde φ_i^(k)⟩, and this quantity is not invariant under the arbitrary global phase that each energy eigenvector |Ψ^k⟩ carries, nor under the residual unitary freedom of the norm-matrix eigenvectors when eigenvalues are near-degenerate. Footnote [61] asserts only that the orthogonalization mixes states with very close deformation parameters, so that β2 and γ labels are preserved; it does not address the stability of the relative phases that define the red/yellow pattern. If the phase of |Ψ^k⟩ is flipped, every circle changes color; if near-degenerate norm eigenvalues are present, the tilde basis can rotate and the pattern of Fig. 2(c) can change without changing any energy or B(E2). The authors should demonstrate, e.g., by diagonalizing the norm matrix with random degenerate-subspace rotations and by testing the effect of global sign conventions, that the reported sign change is a robust property of the state rather than a gauge artifact.
- [Fig. 3(b)–(e) and the paragraph comparing them with Fig. 3(a)] The red/yellow histograms are expansion coefficients in a non-orthogonal, discrete MCSM basis, not a collective wavefunction in γ or β2. A sign change in these coefficients is necessary but not sufficient for a one-node vibration: orthogonality to a nodeless 0+1 ground state can itself force sign oscillations in such an expansion, and the binning/normalization procedure adds additional convention dependence. The harmonic-oscillator analogy is qualitative; the paper reports no quantitative measure of the node position, no count of sign changes, no significance test against a null pattern (e.g., random signs with the same ground-state overlap), and no check that the pattern survives a different basis truncation. The authors should provide an invariant node definition, for example by constructing a collective wavefunction in a suitably orthonormalized coordinate projection and counting its zeros, or by computing the overlap of the candidate state with a one-phonon excitation operator acting on the reference state.
- [Fig. 2(e) and the discussion of the 2+5 state] The assignment of the 2+5 state as a gamma vibration 'on top of the 2+2 state' uses the 2+2 state as reference because 2+1 is a member of the ground band. But the same analysis is not applied to the rotational members of the proposed vibrational band, and no B(E2) or E0 transition connecting the 2+5 state to the 2+2 band is given to corroborate the phonon picture. Since the reference-state choice changes which states are compared, the authors should show that the node pattern is stable when the reference state is varied within the bands (e.g., using the 4+ member of the ground band as an alternative reference) and that the proposed vibrational band members share the same PT-plot signature.
minor comments (5)
- [Throughout] The acronym 'PT-plot' is introduced, but 'T-plot' is used alone in several places (e.g., End Matter, 'The T-plot displays...'), which is confusing; please use the full name consistently or state explicitly when the standard T-plot is meant.
- [End Matter, Eq. (3)] The superscript (k) in |tilde φ_i^(k)⟩ and the eigenstate index k in |Ψ^k⟩ are the same symbol but refer to different objects; this dual use should be disambiguated, for instance by using a different label for the K-integrated basis states.
- [Main text, first paragraph] 'one-and-half HO shell' should read 'one-and-a-half HO shell'; also 'a` la A. Bohr' should be typeset as 'à la A. Bohr'.
- [Fig. 1 and Fig. 4 captions] The criterion for omitting experimental and theoretical levels is not stated; since the comparison of band structures depends on which levels are included, the selection rule should be specified.
- [Footnote [61]] Footnote [61] is placed at the end of the T-plot definition but is not referenced in the main text; consider inserting the reference at the first use of the T-plot, as it is directly relevant to the interpretation of the circle positions.
Circularity Check
No significant circularity: PT-plot assignments are interpretations of unfitted MCSM wavefunctions, not fitted inputs disguised as predictions.
full rationale
The paper identifies vibrational states in 166Er and 162Dy via the phase pattern of PT-plot amplitudes computed from QVSM/MCSM wavefunctions. The energies and B(E2) values are genuine outputs of the many-body calculation with the V_MU interaction fixed in earlier work; no parameter is fitted to the 0+3, 2+5, or 0+6 states, nor to the B(E2) values used for comparison. The identification of a sign change in the PT-plot as a nodal excitation is an interpretive step based on the harmonic-oscillator analogy, not a definition that equates the output with the input. The paper does rely on Ref. [12] for the triaxial-rotational character of the gamma band, but this is a self-citation of an independently published calculation, and the present paper also provides its own PT-plot evidence, e.g., the 4+4 state 'displays a PT-plot similar to panel (d) ... confirming its J^P=K^P=4+ character.' No equation in the paper is equivalent by construction to the claimed result, and no fitted parameter is renamed as a prediction. Concerns about the phase convention or the stability of the orthogonalization (footnote [61]) are technical validity issues, not circularity.
Assumptions & free parameters
free parameters (3)
- V_MU effective interaction parameters =
set by Ref. [23]
- slight modification of V_MU in proton-neutron channel =
not specified
- MCSM basis vector count =
not specified
assumptions (4)
- domain assumption The valence space is restricted to one-and-a-half harmonic oscillator shells, sdg for protons and pfh for neutrons, above a 110Zr core.
- ad hoc to paper A sign change in the PT-plot amplitude distribution indicates a vibrational node, in analogy with the wavefunction of a harmonic oscillator.
- domain assumption The orthonormalization of the non-orthogonal basis vectors does not significantly change the deformation parameters beta_2 and gamma of the original basis states.
- domain assumption The effective Hamiltonian, Brown plus V_MU, is adequate for describing the low-lying states of these heavy deformed nuclei.
Cite this review
Pith. "Pith review of Vibrational Modes in Strongly Deformed Nuclei." pith.science (2026). https://pith.science/paper/PIXELSOG
@misc{pith2026250720275,
  author       = {Pith},
  title        = {Pith review of: Vibrational Modes in Strongly Deformed Nuclei},
  year         = {2026},
  howpublished = {\url{https://pith.science/paper/PIXELSOG}},
  note         = {Machine review of arXiv:2507.20275}
}
abstract
Low-energy vibrational excitations associated with the fluctuation of quadrupole deformed shapes are discussed within the frame of state-of-the-art Configuration Interaction calculations, actually performed via the Quasi-particle Vacua Shell Model version of the Monte Carlo Shell Model. Recently, low-lying $\gamma$ bands in heavy strongly deformed nuclei were shown to be rotational $K^P$ = 2$^+$ excitations of triaxially deformed states (see T. Otsuka \etal, Eur. Phys. J. A 61, 126 (2025)) rather than vibrational excitations as traditionally interpreted. In this context, it is important to identify possible low-lying vibrational excitations and to characterize the excitation energy at which they emerge. Focusing on two typical examples, $^{166}$Er and $^{162}$Dy, vibrational states are indeed identified above the $\gamma$ band using an extended version of the so-called T-plot. The phenomenon of shape coexistence is also shown to produce low-lying states below such vibrational band heads. These results suggest novel and rich structures in heavy deformed nuclei. While experimental counterparts are seen for some of such states, others are predictions opening doors to future dedicated experiments.
Figures


Figures from the paper (2 more)

Reference graph
Works this paper leans on
-
[61]
The T-plot actually uses theβ 2 andγvalues computed of the vectors|ϕ (i)⟩[51, 52] because the orthogonalization linking both sets of states only involves states with very close val- ues of the deformation parameters such that no significant changes of their values occurs between|ϕ iK⟩and| ˜ϕiK⟩. End Matter In the Appendix, we provide detailed discussions ...
- [1]
- [2]
-
[3]
A. N. Bohr,Nobel Lectures, Physics 1971–1980, Edi- tor Stig Lundqvist (World Scientific, Singapore, 1992); https://www.nobelprize.org/prizes/physics/1975/bohr/facts/
work page 1971
-
[4]
A. Bohr and B. R. Mottelson, Mat. Fys. Medd. Dan. Vid. Selsk.27, 16 (1953)
work page 1953
-
[5]
A. Bohr and B. R. Mottelson,Nuclear Structure(Benjamin, New York, 1975), V ol. II
work page 1975
-
[6]
D. J. Rowe,Nuclear Collective Motion: Models and Theory (Methuen, London, 1970)
work page 1970
-
[7]
A. de-Shalit and H. Feshbach,Nuclear Structure (Theoret- ical Nuclear Physics)(John Wiley and Sons, New York, 1974)
work page 1974
Show all 63 references
-
[8]
M. A. Preston and R. K. Bhaduri,Structure of the Nucleus (Addison-Wesley, New York, 1975), Chap. 9
1975
-
[9]
Ring and P
P. Ring and P. Schuck,The Nuclear Many-Body Problem (Springer-Verlag, Berlin, 1980)
1980
-
[10]
J. M. Eisenberg and W. Greiner,Nuclear Theory, 3rd ed., (North-Holland, Amsterdam, 1987), V ol. I
1987
-
[11]
R. F. Casten,Nuclear Structure from a Simple Perspective (Oxford University Press, New York, 2000)
2000
-
[12]
Phase-specified T-plot (PT- plot)
along with the experimental 4 + state at excitation en- ergyE x =2.028 MeV and the calculatedJ P =K P =4 + state. Some of these low-lying states were analyzed in the past from the viewpoint of possible triaxial shapes or so- calledγ-instability, see Refs. [31–43], as well as t...
-
[13]
Otsuka, Y
T. Otsuka, Y . Tsunoda, T. Abe, N. Shimizu, and P. Van Dup- pen, Phys. Rev. Lett.123, 222502 (2019)
2019
-
[14]
Otsuka, Y
T. Otsuka, Y . Tsunoda, N. Shimizu, Y . Utsuno, T. Abe, and H. Ueno, Eur. Phys. J. A61, 126 (2025)
2025
-
[15]
Otsuka, M
T. Otsuka, M. Honma, T. Mizusaki, N. Shimizu, and Y . Ut- suno, Prog. Part. Nucl. Phys.47, 319 (2001)
2001
-
[16]
Shimizu, Y
N. Shimizu, Y . Tsunoda, Y . Utsuno, and T. Otsuka, Phys. Rev. C103, 014312 (2021)
2021
-
[17]
Frauendorf, Int
S. Frauendorf, Int. J. Mod. Phys. E24, 1541001 (2015)
2015
-
[18]
Shimizuet al., Prog
N. Shimizuet al., Prog. Theor. Exp. Phys.2012, 01A205 (2012)
2012
-
[19]
A. N. Andreyevet al., Nature405, 430 (2000)
2000
-
[20]
J. L. Wood, K. Heyde, W. Nazarewicz, M. Huyse, and P. Van Duppen, Phys. Rep.215, 101 (1992)
1992
-
[21]
Leoni, B
S. Leoni, B. Fornal, A. Bracco, Y . Tsunoda, and T. Otsuka, Prog. Part. Nucl. Phys.139, 104119 (2024)
2024
-
[22]
Heyde and J
K. Heyde and J. L. Wood, Rev. Mod. Phys.83, 1467 (2011)
2011
-
[23]
Otsuka, T
T. Otsuka, T. Suzuki, M. Honma, Y . Utsuno, N. Tsunoda, K. Tsukiyama, and M. Hjorth-Jensen, Phys. Rev. Lett.104, 012501 (2010)
2010
-
[24]
B. A. Brown, Phys. Rev. Lett.85, 5300 (2000)
2000
-
[25]
Kremeret al., Phys
C. Kremeret al., Phys. Rev. Lett.117, 172503 (2016)
2016
-
[26]
Togashi, Y
T. Togashi, Y . Tsunoda, T. Otsuka, and N. Shimizu, Phys. Rev. Lett.117, 172502 (2016)
2016
-
[27]
B. A. Marshet al., Nature Physics14, 1163–1167 (2018)
2018
-
[28]
Togashi, Y
T. Togashi, Y . Tsunoda, T. Otsuka, N. Shimizu, and M. Honma, Phys. Rev. Lett.121, 062501 (2018)
2018
-
[29]
Tsunoda, N
Y . Tsunoda, N. Shimizu, and T. Otsuka, Phys. Rev. C108, L021302 (2023)
2023
-
[30]
Selset al., Phys
S. Selset al., Phys. Rev. C99, 044306 (2019)
2019
-
[31]
A. S. Davydov and G. F. Filippov, Nucl. Phys.8, 237 (1958)
1958
-
[32]
Evaluated Nuclear Structure Data File
National Nuclear Data Center. Evaluated Nuclear Structure Data File. https://www.nndc.bnl.gov/ensdf/
-
[33]
Cline, Ann
D. Cline, Ann. Rev. Nucl. Part. Sci.36, 683 (1986)
1986
-
[34]
A. S. Davydov and V . S. Rostovsky, Nucl. Phys.12, 58 (1959)
1959
-
[35]
Kotli ´nskiet al., Nucl
B. Kotli ´nskiet al., Nucl. Phys. A517, 365 (1990)
1990
-
[36]
Fahlanderet al., Nucl
C. Fahlanderet al., Nucl. Phys. A537, 183 (1992)
1992
-
[37]
Boutachkov, A
P. Boutachkov, A. Aprahamian, Y . Sun, J. A. Sheikh, and S. Frauendorf, Eur. Phys. J. A15, 455 (2002)
2002
-
[38]
Y . Sun, K. Hara, J. A. Sheikh, J. G. Hirsch, V . Vel ´azquez, and M. Guidry, Phys. Rev. C61, 064323 (2000)
2000
-
[39]
Z. P. Li, T. Nikˇsi´c, D. Vretenar, P. Ring, and J. Meng, Phys. Rev. C81, 064321 (2010)
2010
-
[40]
Delaroche, M
J.-P. Delaroche, M. Girod, J. Libert, H. Goutte, S. Hilaire, S. P´eru, N. Pillet, and G. F. Bertsch, Phys. Rev. C81, 014303 (2010)
2010
-
[41]
Y . L. Yang, Y . K. Wang, P. W. Zhao, and Z. P. Li, Phys. Rev. C104, 054312 (2021)
2021
-
[42]
J. F. Sharpey-Schafer, R. A. Bark, S. P. Bvumbi, T. R. S. Dinoko, and S. N. T. Majola, Eur. Phys. J. A55, 15 (2019)
2019
-
[43]
S. P. Rouoof, N. Nazir, S. Jehangir, G. H. Bhat, J. A. Sheikh, N. Rather, and S. Frauendorf, Phys. Rev. C111, 054309 (2025)
2025
-
[44]
S. P. Rouoof, N. Nazir, S. Jehangir, G. H. Bhat, J. A. Sheikh, N. Rather, and S. Frauendorf, Eur. Phys. J. A60, 40 (2024)
2024
-
[45]
P. E. Garrett, M. Kadi, Min Li, C. A. McGrath, V . Sorokin, Minfang Yeh, and S. W. Yates, Phys. Rev. Lett.78, 4545 (1997)
1997
-
[46]
Fahlander, A
C. Fahlander, A. Axelsson, M. Heinebrodt, T. Hartlein, and D. Schwalm, Phys. Lett. B388, 475 (1996)
1996
-
[47]
M ¨oller, J
P. M ¨oller, J. R. Nix, W. D. Myers, and W. J. Swiatecki, At. Data Nucl. Data Tables59, 185 (1995)
1995
-
[48]
P. E. Garrett, J. L. Wood, and S. W. Yates, Phys. Scr.93, 063001 (2018)
2018
-
[49]
Tsunoda, T
Y . Tsunoda, T. Otsuka, N. Shimizu, M. Honma, and Y . Ut- suno, Phys. Rev. C89, 031301(R) (2014)
2014
-
[50]
M ¨oller, R
P. M ¨oller, R. Bengtsson, B. G. Carlsson, P. Olivius, and T. Ichikawa, Phys. Rev. Lett.97, 162502 (2006)
2006
-
[51]
Utsuno, N
Y . Utsuno, N. Shimizu, T. Otsuka, T. Yoshida, and Y . Tsun- oda, Phys. Rev. Lett.114, 032501 (2015)
2015
-
[52]
Otsuka and Y
T. Otsuka and Y . Tsunoda, J. Phys. G43, 024009 (2016)
2016
-
[53]
D. J. Rowe, T. A. Welsh, and M. A. Caprio, Phys. Rev. C 79, 054304 (2009)
2009
-
[54]
Otsuka, N
T. Otsuka, N. Shimizu, and Y . Tsunoda, Phys. Rev. C105, 014319 (2022)
2022
-
[55]
Tsunoda and T
Y . Tsunoda and T. Otsuka, Phys. Rev. C103, L021303 (2021)
2021
-
[56]
D. J. Rowe and J. L. Wood,Fundamentals of Nuclear Models: Foundational Models(World Scientific, Singapore, 2010)
2010
-
[57]
States carrying largerJvalues are not shown for clarity
-
[58]
Aprahamian, C
A. Aprahamian, C. Casarella, S. R. Lesher, K. Lee, B. P. Crider, M. M. Meier, E. E. Peters, F. M. Prados-Est ´evez, 6 and Z. Tully, Eur. Phys. J. A60, 83 (2024)
2024
-
[59]
This constitutes the quantum mechanical equivalent of a classical particle at rest in the bottom of the well and a par- ticle oscillating in the well, respectively
-
[60]
circles) are lo- cated within this rectangle for all the eigenstates of present interest
Essentially all significant contributions (i.e. circles) are lo- cated within this rectangle for all the eigenstates of present interest
-
[62]
This is con- sistent with the behavior of the PES in theβ 2 direction
The distribution of weights being asymmetric around the node, the vibration is somewhat anharmonic. This is con- sistent with the behavior of the PES in theβ 2 direction
-
[140]
nuclei with even neutron (N) and proton (Z) num- bers [12, 13]. This was achieved using state-of-the- art ultra-large-scale Configuration Interaction (CI) calcu- lations performed within the frame of the Quasi-particle Vacua Shell Model (QVSM) [14] version of the Monte Carlo S...
2026 arXiv
Reviewed August 6, 2026 · model on record in the stance chip above.
Discussion (0). Continue with ORCID to comment.