REVIEW 4 major objections 4 minor 44 references
VizGenie: Toward Self-Refining, Domain-Aware Workflows for Next-Generation Scientific Visualization
T0 review · 4 major / 4 minor · reviewed 2026-08-06 · deepseek-v4-flash
Pith's one-line read An LLM-orchestrated visualization agent improves its feature-based isovalue picks as its image knowledge base grows.
desk verdict A genuinely new system integration with honest self-assessment, but the headline claim of reduced cognitive overhead is asserted, not measured; deserves a serious referee and major revision. read the letter →
The pith
A machine-rendered reading of the paper's core claim, the machinery that carries it, and where it could break.
The reading
What carries the argument
The central mechanism is an image-caption-parameter knowledge base. For each dataset, VizGenie renders a grid of images by varying isovalues and camera angles, captions them with a locally fine-tuned vision-language model, and stores the captions with their rendering parameters in a database; an orchestration LLM then converts a user's natural-language feature query into an isovalue by matching the query to stored captions. Two supporting loops make the system self-improving: dynamic generation of Visualization Toolkit (VTK) Python scripts with automated validation and caching, and asynchronous expansion of the image knowledge base. Fine-tuning uses parameter-efficient low-rank adaptation to align the vision model's vocabulary with the domain, which is what raises caption stability and domain-keyword frequency. Retrieval-augmented generation adds context from stored documents and prior interactions to the LLM's answers, and provenance logging records each query and generated module for reproducibility.
What would settle it
Take a held-out set of volumetric datasets with expert-marked ideal isovalue ranges, run VizGenie's full isovalue-selection pipeline on each, and count how often the recommended isovalue falls inside the expert range. Because the paper reports only 39% caption-sentence accuracy on held-out asteroid images, the same evaluation would show whether isovalue-selection accuracy tracks caption accuracy; if the pipeline still picks expert-range isovalues despite low caption fidelity, the caption premise is not load-bearing, and if it does not, the self-improvement claim collapses.
Extended reading notes
Core claim
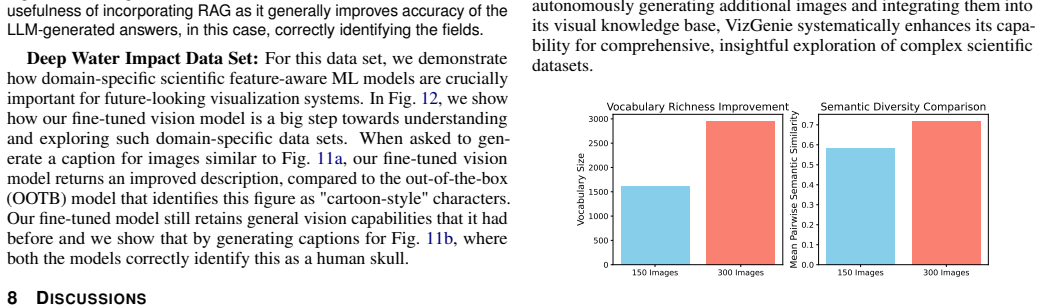
On its own terms, the paper establishes that a visualization system can be organized as a closed loop of rendering, captioning, and parameter retrieval. A fine-tuned vision model converts rendered images into domain-specific captions; those captions are stored together with the isovalues and camera angles that produced them; and an orchestration LLM answers 'show me the skull' by retrieving the stored caption that best matches the query and using its associated isovalue to render the image. The paper reports that this loop improves with scale and with fine-tuning: on the CT head dataset, vocabulary richness grew from 1606 unique words with 150 images to 2946 with 300 images, and predicted optimal isovalues for nose, skull, and teeth moved toward the ranges a visualization expert marked as ideal; on the deep-water asteroid impact dataset, fine-tuning raised mean inter-caption semantic similarity from 0.432 to 0.654 (Mann-Whitney U test, p < 0.00001) and sharply increased domain keywords such as 'crater,' 'asteroid,' and 'impact.' The qualitative, unmeasured part of the claim is that these mechanisms reduce cognitive overhead for iterative exploration, since users can name features instead of tuning transfer functions and isovalues by hand.
Load-bearing premise
The feature-query and isovalue-selection pipeline rests on the assumption that the captions produced by the fine-tuned vision model accurately describe what the rendered images show; the paper's own held-out evaluation found that only about 39% of the fine-tuned model's sentences on asteroid images were judged TRUE by a domain expert.
Editorial extensions
If this is right
- Users can issue feature-level queries such as 'visualize the skull' and receive a visualization with a concrete isovalue, without manually tuning transfer function parameters.
- Expanding the visual knowledge base from 150 to 300 images moved predicted isovalues closer to expert ranges for nose (455 to 585), skull (1365 to 1587), and teeth (2730 to 2925).
- Fine-tuning the vision model on domain images raised inter-caption stability from 0.432 to 0.654 and sharply increased domain vocabulary use, with 'crater' rising from 1 to 348 occurrences, 'asteroid' from 0 to 1112, and 'impact' from 38 to 1616.
- Newly generated VTK scripts are validated automatically and cached, so the system's capabilities can grow without user intervention.
- Retrieval-augmented generation produced more accurate answers about dataset fields than a direct LLM response in the turbulence case study.
Reading between the lines
- Because the paper never measures cognitive overhead directly, a controlled user study comparing task completion time, prompt count, and error rates against a manual visualization workflow is the natural test of the headline claim; the paper's own feedback section only reports qualitative impressions.
- The same image-caption-parameter loop should transfer from isovalues to other continuous visualization parameters such as colormap, opacity transfer function, and camera path, and a test on those parameters would show whether the self-improvement generalizes.
- Given that the fine-tuned model confused 'water jet,' 'water plume,' and 'water vapor plume' and was correct on only 39% of held-out sentences, caption fidelity is the likely bottleneck; tightening domain terminology and injecting domain-specific retrieval into the captioning step is a more direct improvement path than merely expanding the image library.
Editorial analysis
A structured set of objections, weighed in public.
Referee Report
Summary. VizGenie is an agentic framework for scientific visualization that combines pre-existing tools (filtering, slicing, histogram) with LLM-generated VTK Python modules, a fine-tuned Llama-3.2-Vision model for feature-based image captioning and visual question answering, retrieval-augmented generation over local documents, and a provenance/logging database. The workflow is orchestrated by GPT-4o, with code generation assigned to o3-mini and incremental code refinement to GPT-4o-mini. The paper reports quantitative evaluations: expanding the visual database from 150 to 300 images increased vocabulary richness and semantic similarity, shifted predicted optimal isovalues for anatomical features toward expert-defined ranges, and fine-tuning the vision model improved inter-caption stability from 0.432 to 0.654 (Mann-Whitney U, p < 0.00001). The authors present case studies on four public datasets (CT head, Hurricane Isabel, 2008 SciVis turbulence, 2018 Deep Water Asteroid Impact) and report timing/validity measurements for different LLMs. The abstract and introduction claim that VizGenie significantly reduces cognitive overhead for iterative visualization tasks, but the paper's user feedback section reports only the authors' own experiences and the limitations section states that extensive user studies are still needed.
Significance. If the mechanisms work as described, VizGenie addresses a real gap: enabling feature-based natural-language queries and iterative refinement for large-scale scientific volume visualization, which most prior LLM-visualization work (e.g., ChatVis, Chat2VIS) does not target. The paper's strengths include a concrete agentic architecture with automated backend validation, a reproducible evaluation on publicly available contest datasets, a real statistical test for caption stability, and unusually candid reporting of the fine-tuned model's remaining errors (39% sentence-level truthfulness on held-out asteroid images). The self-improvement loop of expanding the visual database and observing isovalue shifts toward expert-defined ranges is a plausible and falsifiable mechanism. However, the headline claim of reduced cognitive overhead is not operationalized or measured, and the evaluation loop is partly circular because the same author who curated the training data also supplies the ground truth and the LLM used as judge is also the workflow orchestrator. These issues are substantial but fixable by revising the claims and adding independent or user-based evaluation.
major comments (4)
- [Abstract; Section 1 (Introduction); Section 8.3; Section 9] The central claim that VizGenie 'significantly reduc[es] cognitive overhead for iterative visualization tasks' is not measured anywhere. Section 8.3 reports feedback only from the authors themselves, and Section 9 explicitly concedes that 'Extensive user studies are needed.' There are no independent participants, no task completion times, no error rates, no workload instrument (e.g., NASA-TLX), and no baseline comparison. The quantitative results in Section 8.1 validate system components (vocabulary, semantic similarity, isovalue shifts), not user cognitive load. The abstract and contribution list should either be revised to claim only component-level improvements, or the paper should include a user study that measures cognitive overhead against a reasonable baseline.
- [Section 5.2.6; Section 8.1.2] Section 5.2.6 builds a knowledge base from captions generated by the fine-tuned vision model, and GPT-4o uses those captions to select isovalues for feature-based queries. However, Section 8.1.2 reports that on held-out asteroid images only 39% of the fine-tuned model's sentences were rated TRUE by the expert, with systematic confusions such as water jet vs. water plume vs. water vapor plume, incorrect statements about color maps, and 'transient crater' followed by 'basin' even though 'basin' never appeared in training captions. If this caption fidelity is representative, the feature-query and VQA pipeline may be built on substantially unreliable captions. The paper should quantify how caption errors propagate to isovalue selection, or provide evidence that the isovalue retrieval step is robust to caption noise.
- [Section 8.1.1; Section 8.1.2] The evaluation of self-improvement and fine-tuning is partly circular. The 'ideal ranges' for nose, skull, and teeth isovalues in Section 8.1.1 were defined by 'a visualization expert' who is an author and was also the person who curated, generated, and reviewed the fine-tuning image-caption pairs (Section 5.2.6). Similarly, the ground-truth captions for the LLM-as-a-judge analysis in Section 8.1.2 were provided by the same author. Additionally, GPT-4o, which serves as the workflow orchestrator, is also used as the judge. This does not invalidate the caption-stability statistic, but it means the claims of improved isovalue prediction and semantic quality are not independent. The paper should either use independent expert judges or explicitly discuss the circularity and its potential impact.
- [Figure 10; Section 7] The RAG example in Figure 10 is claimed to show that RAG 'correctly identify[ies] the fields,' but the RAG answer lists only three scalar fields ('Temperature, Mass density, Chemical species') and one vector field ('Velocity'). Section 7 describes the 2008 SciVis contest data as containing 'measurements of the relative abundances of eight chemical species, along with temperature, density, and the velocity field.' Thus the RAG answer appears to mis-enumerate the fields by lumping eight distinct chemical-species fields into one and omitting the individual species. The example should be corrected or the claim about RAG's accuracy should be qualified; as presented, the figure undercuts rather than supports the RAG contribution.
minor comments (4)
- [Section 5.2.1] The tool list includes 'VisualizeHistogram' twice: 'e.g., FilterRuns, VisualizeHistogram, VisualizeHistogram'; the duplicate appears to be a typo.
- [Section 8.1.2] The sentence 'All color maps use were simple linear color palettes' contains a grammatical error; it should read 'All color maps used were simple linear color palettes.'
- [Table 1] The column header 'LLM Code Gen. Mod.' is ambiguous; consider splitting it into clearer headers such as 'Code Generation LLM' and 'Code Modification LLM' to match the rows.
- [Section 7, CT scan dataset] The CT scan description says the study is of a 'twelve year old male' but the volume rendering includes 'just above the eyes to just below the chin'; the text later refers to 'skull' and 'teeth' features. This is fine, but the caption of Figure 14 labels 'high-level feature areas' without explaining how the expert determined those areas; a brief note would improve reproducibility.
Circularity Check
Partial evaluative circularity: the author who wrote the fine-tuning captions also defines the 'ideal' isovalue ranges and rates caption truthfulness, so the reported accuracy and isovalue gains partly measure the system's self-agreement with its own training signal; the headline cognitive-overhead claim is asserted without measurement.
-
self definitional
[Section 5.2.6 (Dataset Generation) and Section 8.1.1 (Self-Improvement Through Expanded Visual Database)]
"One of the authors, a visualization scientist with domain relevant experience, curated, generated, reviewed and refined these image-caption pairs, ensuring their accuracy and relevance. ... the predicted optimal isovalues aligned more with the ideal isosurfaces as judged by a visualization expert: the nose isovalue moved from 455 to 585 (ideal range is 650-700), skull from 1365 to 1587 (ideal range is 1550-1600), and teeth from 2730 to 2925 (ideal range is 2800-2900)."
The self-improvement claim is that expanding the image database moves predicted optimal isovalues toward expert-defined 'ideal ranges.' But the ideal ranges are supplied by the same visualization expert who authored the fine-tuning captions (5.2.6), and the predicted isovalues are selected by GPT-4o from captions produced by the vision model fine-tuned on that expert's labels. The evaluation target is therefore defined by the same source that defined the training signal: the shift toward the 'ideal' measures how faithfully the system reproduces this one author's injected preferences, not an externally grounded truth about the data. The improvement is partly an echo of its own input rather than an independent prediction.
-
fitted input called prediction
[Section 8.1.2 (Human-in-the-loop Qualitative Analysis)]
"For a qualitative analysis of the captions from the fine-tuned model, each separate sentence or phrase in the overall caption was rated by the domain relevant author as TRUE or FALSE. Compared to the effectively 0% true statements about the images before tuning, the model improved to 39% accurate statements."
The vision model was fine-tuned with LoRA on image-caption pairs written by 'one of the authors, a visualization scientist with domain relevant experience' (5.2.6). The reported 'accuracy' is the fraction of sentences that same domain expert rates TRUE on held-out asteroid images. Thus the ground truth for the prediction is the same annotator whose caption style was the training target, and the 0% to 39% gain is in substantial part a direct consequence of fitting the model to that annotator's judgments. The genuinely held-out images prevent pure overfitting, but the annotator-identity confound means the metric largely measures imitation fidelity to the training label source rather than objective caption correctness.
full rationale
The paper's concrete quantitative results are of two kinds. The inter-caption stability gain (0.432 to 0.654, Mann-Whitney U, p < 0.00001), the vocabulary-size and semantic-similarity metrics, and the timing/validity table are computed on the system's own outputs and do not depend on any external ground truth; those are not circular. The circularity is confined to the ground-truth loop around the fine-tuned vision model: the expert who curated the fine-tuning captions (5.2.6) is also the person who defines the 'ideal' isovalue ranges used to judge the self-improvement claim (8.1.1) and who rates every fine-tuned sentence TRUE or FALSE in the human-in-the-loop analysis (8.1.2). Because the model was trained to imitate that expert's captioning, the reported 'accuracy' and the isovalue movement toward his or her stated ideals partly measure the system's agreement with its own training signal. This is not a full reduction by construction: the held-out visualizations are new, and the isovalue shifts could in principle have moved the wrong way, so the evaluation retains independent content. Separately, the abstract's headline claim of 'significant reductions in cognitive overhead' is never measured: Section 8.3 reports only feedback from the authors themselves, and Section 9 concedes that 'extensive user studies are needed.' That is an evidentiary gap rather than a circular derivation, so it does not further raise the circularity score. No load-bearing self-citation chain or imported uniqueness theorem is present.
Assumptions & free parameters
free parameters (3)
- Feature ideal isovalue ranges (nose 650-700; skull 1550-1600; teeth 2800-2900) =
Expert annotation, not fitted
- Image database sizes and capture grid =
150/300 images; 25/50 isovalues; 6 view angles
- LoRA fine-tuning hyperparameters (rank, alpha, epochs) =
Not reported in the paper (supplemental material)
assumptions (3)
- domain assumption A generated visualization script that executes without error and whose output matches the user prompt is 'valid' (Table 1 validity judgment).
- domain assumption Semantic embedding similarity is an adequate proxy for caption stability and knowledge-base quality.
- domain assumption The four public datasets and ten held-out visualizations are representative of HPC scientific visualization workloads.
Cite this review
Pith. "Pith review of VizGenie: Toward Self-Refining, Domain-Aware Workflows for Next-Generation Scientific Visualization." pith.science (2026). https://pith.science/paper/ZQOIOZBX
@misc{pith2026250721124,
  author       = {Pith},
  title        = {Pith review of: VizGenie: Toward Self-Refining, Domain-Aware Workflows for Next-Generation Scientific Visualization},
  year         = {2026},
  howpublished = {\url{https://pith.science/paper/ZQOIOZBX}},
  note         = {Machine review of arXiv:2507.21124}
}
read the original abstract
We present VizGenie, a self-improving, agentic framework that advances scientific visualization through large language model (LLM) by orchestrating of a collection of domain-specific and dynamically generated modules. Users initially access core functionalities--such as threshold-based filtering, slice extraction, and statistical analysis--through pre-existing tools. For tasks beyond this baseline, VizGenie autonomously employs LLMs to generate new visualization scripts (e.g., VTK Python code), expanding its capabilities on-demand. Each generated script undergoes automated backend validation and is seamlessly integrated upon successful testing, continuously enhancing the system's adaptability and robustness. A distinctive feature of VizGenie is its intuitive natural language interface, allowing users to issue high-level feature-based queries (e.g., ``visualize the skull"). The system leverages image-based analysis and visual question answering (VQA) via fine-tuned vision models to interpret these queries precisely, bridging domain expertise and technical implementation. Additionally, users can interactively query generated visualizations through VQA, facilitating deeper exploration. Reliability and reproducibility are further strengthened by Retrieval-Augmented Generation (RAG), providing context-driven responses while maintaining comprehensive provenance records. Evaluations on complex volumetric datasets demonstrate significant reductions in cognitive overhead for iterative visualization tasks. By integrating curated domain-specific tools with LLM-driven flexibility, VizGenie not only accelerates insight generation but also establishes a sustainable, continuously evolving visualization practice. The resulting platform dynamically learns from user interactions, consistently enhancing support for feature-centric exploration and reproducible research in scientific visualization.
Figures


Figures from the paper (10 more)




Reference graph
Works this paper leans on
-
[1]
J. Ahrens, B. Geveci, and C. Law. 36 - paraview: An end-user tool for large- data visualization. In C. D. Hansen and C. R. Johnson, eds., Visualization Handbook, pp. 717–731. Butterworth-Heinemann, Burlington, 2005. doi: 10.1016/B978-012387582-2/50038-1 2, 5
-
[2]
L. Battle and C. Scheidegger. A structured review of data management technology for interactive visualization and analysis. IEEE Transactions on Visualization and Computer Graphics, 27(2):1128–1138, 2021. doi: 10 .1109/TVCG.2020.3028891 2
arXiv 2021
-
[3]
J. Beyer, M. Hadwiger, and H. Pfister. State-of-the-art in gpu-based large- scale volume visualization. Comput. Graph. Forum, 34(8):13–37, 25 pages, Dec. 2015. doi: 10.1111/cgf.12605 2
-
[4]
S. Bruckner and T. Möller. Isosurface similarity maps.Computer Graphics Forum, 29(3):773–782, 2010. doi: 10.1111/j.1467-8659.2009.01689.x 7
arXiv 2010
-
[5]
L. Chen, P.-H. Lin, T. Vanderbruggen, C. Liao, M. Emani, and B. de Supin- ski. Lm4hpc: Towards effective language model application in high- performance computing. In OpenMP: Advanced Task-Based, Device and Compiler Programming: Proceedings of 19th International Workshop on OpenMP , IWOMP 2023, 16 pages, p. 18–33. Springer-Verlag, Berlin, Heidelberg, Sept...
-
[6]
H. Childs, E. Brugger, B. Whitlock, J. Meredith, S. Ahern, D. Pugmire, K. Biagas, M. Miller, C. Harrison, G. H. Weber, H. Krishnan, T. Fogal, A. Sanderson, C. Garth, E. W. Bethel, D. Camp, O. Rübel, M. Durant, J. M. Favre, and P. Navrátil. VisIt: An End-User Tool For Visualizing and Analyzing Very Large Data, pp. 357–372. Chapman and Hall/CRC, October 201...
doi:10.1201/b12985 2012
-
[7]
Data courtesy of Siemens Medical Systems, down- loaded as example data with ParaView
CT head scan, 1987. Data courtesy of Siemens Medical Systems, down- loaded as example data with ParaView. 5
work page 1987
-
[8]
FREYR: A Framework for Recognizing and Executing Your Requests
R. Gallotta, A. Liapis, and G. N. Yannakakis. Freyr: A framework for recognizing and executing your requests. https://arxiv.org/abs/2501.12423,
Show all 44 references
-
[9]
Goswami, P
K. Goswami, P. Mathur, R. Rossi, and F. Dernoncourt. Plotgen: Multi- agent llm-based scientific data visualization via multimodal retrieval feed- back. In Companion Proceedings of the ACM on Web Conference 2025, WWW ’25, 5 pages, p. 1672–1676. Association for Computing Machine...
2025
-
[10]
Harrison, M
C. Harrison, M. Larsen, B. S. Ryujin, A. Kunen, A. Capps, and J. Privitera. Conduit: A successful strategy for describing and sharing data in situ. In 2022 IEEE/ACM International Workshop on In Situ Infrastructures for En- abling Extreme-Scale Analysis and Visualization (ISAV)...
2022
-
[11]
Heer and M
J. Heer and M. Bostock. Protovis: A Graphical Toolkit for Visualization . IEEE Transactions on Visualization & Computer Graphics, 15(06):1121– 1128, Nov. 2009. doi: 10.1109/TVCG.2009.174 2
2009 doi
-
[12]
E. J. Hu, Y . Shen, P. Wallis, Z. Allen-Zhu, Y . Li, S. Wang, L. Wang, and W. Chen. Lora: Low-rank adaptation of large language models. https://arxiv.org/abs/2106.09685, 2021. 3, 5
2021 arXiv
-
[13]
J. Kim, S. Lee, H. Jeon, K.-J. Lee, H.-J. Bae, B. Kim, and J. Seo. Phe- noflow: A human-llm driven visual analytics system for exploring large and complex stroke datasets. IEEE Transactions on Visualization and Computer Graphics, 31(1):470–480, 2025. doi: 10.1109/TVCG.2024. 34...
2025 doi
-
[14]
Larsen, E
M. Larsen, E. Brugger, H. Childs, and C. Harrison. Ascent: A flyweight in situ library for exascale simulations. In H. Childs, J. C. Bennett, and C. Garth, eds., In Situ Visualization for Computational Science, pp. 255–
-
[15]
Leurent and O.-A
E. Leurent and O.-A. Maillard. Monte-carlo graph search: the value of merging similar states. In S. J. Pan and M. Sugiyama, eds., Proceedings of The 12th Asian Conference on Machine Learning, vol. 129 of Proceedings of Machine Learning Research, pp. 577–592. PMLR, 18–20 Nov 20...
2020
-
[16]
H. Liu, C. Li, Q. Wu, and Y . J. Lee. Visual instruction tuning. In A. Oh, T. Naumann, A. Globerson, K. Saenko, M. Hardt, and S. Levine, eds., Advances in Neural Information Processing Systems, vol. 36, pp. 34892– 34916. Curran Associates, Inc., 2023. Paper. 3
2023
-
[17]
Y . Luo, N. Tang, G. Li, C. Chai, W. Li, and X. Qin. Synthesizing natural language to visualization (nl2vis) benchmarks from nl2sql benchmarks. In Proceedings of the 2021 International Conference on Management of Data, SIGMOD ’21, 13 pages, p. 1235–1247. Association for Comput...
2021
-
[18]
Y . Luo, N. Tang, G. Li, J. Tang, C. Chai, and X. Qin. Natural language to visualization by neural machine translation. IEEE Transactions on Visualization and Computer Graphics , 28(1):217–226, 2021. doi: 10. 1109/TVCG.2021.3114848 1, 2
2021
-
[19]
Mackinlay
J. Mackinlay. Automating the design of graphical presentations of rela- tional information. ACM Trans. Graph., 5(2):110–141, 32 pages, Apr
-
[20]
Maddigan and T
P. Maddigan and T. Susnjak. Chat2vis: Generating data visualizations via natural language using chatgpt, codex and gpt-3 large language mod- els. IEEE Access, 11:45181–45193, 2023. doi: 10.1109/ACCESS.2023. 3274199 1, 2
2023 doi
-
[21]
Mallick, O
T. Mallick, O. Yildiz, D. Lenz, and T. Peterka. Chatvis: Automating scientific visualization with a large language model. In Proceedings of the SC ’24 Workshops of the International Conference on High Performance Computing, Network, Storage, and Analysis, SC-W ’24, 7 pages, p....
2025
-
[22]
D. P. Nguyen, J. P. Munoz, and A. Jannesari. Flora: Enhanc- ing vision-language models with parameter-efficient federated learning. https://arxiv.org/abs/2404.15182, 2024. 3
2024 arXiv
-
[23]
Norman and D
M. Norman and D. Whalen. 2008 IEEE Scientific Visualization Contest. https://sciviscontest.ieeevis.org/2008, 2008. 6, 7
2008
-
[24]
J. M. Patchett and G. R. Gisler. Deep water impact ensemble data set. Tech- nical Report LA-UR-17-21595, Los Alamos National Laboratory, 2017. Sponsor: USDOE National Nuclear Security Administration (NNSA). 5, 6, 8
2017
-
[25]
Rosenthal, T
P. Rosenthal, T. Van Long, and L. Linsen. Linking Multidimensional Feature Space Cluster Visualization to Multifield Surface Extraction . IEEE Computer Graphics and Applications, 29(03):85–89, 2009. doi: 10. 1109/MCG.2009.45 7
2009
-
[26]
S. Saha, N. Aryal, L. Battle, and A. Termehchy. Shiftscope: Adapting visualization recommendations to users’ dynamic data focus. In Compan- ion of the 2024 International Conference on Management of Data , pp. 536–539, 2024. doi: 10.1145/3626246.3654753 2
2024
-
[27]
Sarton et al
J. Sarton et al. State-of-the-art in large-scale volume visualization beyond structured data. Computer Graphics Forum, 42(3):491–515, 2023. doi: 10. 1111/cgf.14857 2
2023
-
[28]
Satyanarayan, D
A. Satyanarayan, D. Moritz, K. Wongsuphasawat, and J. Heer. Vega-lite: A grammar of interactive graphics. IEEE Transactions on Visualization and Computer Graphics, 23(1):341–350, 2017. doi: 10.1109/TVCG.2016. 2599030 2
2017 doi
-
[29]
Satyanarayan, R
A. Satyanarayan, R. Russell, J. Hoffswell, and J. Heer. Reactive vega: A streaming dataflow architecture for declarative interactive visualization. IEEE Transactions on Visualization and Computer Graphics, 22(1):659– 668, 2016. doi: 10.1109/TVCG.2015.2467091 2
2016
-
[30]
Schroeder, K
W. Schroeder, K. Martin, and B. Lorensen. The Visualization Toolkit (4th ed.). Kitware, 2006. doi: 10.1007/s10825-019-01313-7 2, 3
2006 doi
- [31]
-
[32]
W. Seo, S. Lee, D. Kang, Z. Yuan, and S. Lee. Vispath: Automated visualization code synthesis via multi-path reasoning and feedback-driven optimization. https://arxiv.org/abs/2502.11140, 2025. 1, 2
2025 arXiv
-
[33]
L. Shen, E. Shen, Y . Luo, X. Yang, X. Hu, X. Zhang, Z. Tai, and J. Wang. Towards natural language interfaces for data visualization: A survey.IEEE Transactions on Visualization and Computer Graphics, 29(6):3121–3144,
-
[34]
P. Wang, S. Bai, S. Tan, S. Wang, Z. Fan, J. Bai, K. Chen, X. Liu, J. Wang, W. Ge, Y . Fan, K. Dang, M. Du, X. Ren, R. Men, D. Liu, C. Zhou, J. Zhou, and J. Lin. Qwen2-vl: Enhancing vision-language model’s perception of the world at any resolution. https://arxiv.org/abs/2409.1...
2024 arXiv
-
[35]
W. Wang, C. Bruyere, B. Kuo, and T. Scheitlin. 2004 IEEE Scientific 10 © 2025 IEEE. This is the author’s version of the article that has been published in IEEE Transactions on Visualization and Computer Graphics. The final version of this record is available at: xx.xxxx/TVCG.2...
2004
-
[36]
Wiesinger, P
J. Wiesinger, P. Marlow, and V . Vuskovic. Agents, 2024. 3
2024
-
[37]
Y . Xie, Y . Luo, G. Li, and N. Tang. Haichart: Human and ai paired visualization system. Proc. VLDB Endow., 17(11):3178–3191, 14 pages, July 2024. doi: 10.14778/3681954.3681992 2
2024
-
[38]
C. Xu, G. Sun, and R. Liang. A survey of volume visualization techniques for feature enhancement. Visual Informatics, 5(3):70–81, 2021. doi: 10. 1016/j.visinf.2021.08.001 2
2021
-
[39]
Z. Yang, Z. Zhou, S. Wang, X. Cong, X. Han, Y . Yan, Z. Liu, Z. Tan, P. Liu, D. Yu, Z. Liu, X. Shi, and M. Sun. MatPlotAgent: Method and evaluation for LLM-based agentic scientific data visualization. In L.-W. Ku, A. Martins, and V . Srikumar, eds., Findings of the Association...
2024
-
[40]
S. Yao, J. Zhao, D. Yu, N. Du, I. Shafran, K. Narasimhan, and Y . Cao. React: Synergizing reasoning and acting in language models, 2023. 3
2023
-
[41]
Y . Zhao, J. Wang, L. Xiang, X. Zhang, Z. Guo, C. Turkay, Y . Zhang, and S. Chen. Lightva: Lightweight visual analytics with llm agent-based task planning and execution. IEEE Transactions on Visualization and Computer Graphics, pp. 1–13, 2024. doi: 10.1109/TVCG.2024.3496112 1, 2 11
2024
-
[279]
doi: 10.1007/978-3 -030-81627-8_12 2
Springer International Publishing, Cham, 2022. doi: 10.1007/978-3 -030-81627-8_12 2
2022 doi
-
[1986]
doi: 10.1145/22949.22950 2
-
[2023]
doi: 10.1109/TVCG.2022.3148007 2
2022
Reviewed August 6, 2026 · model on record in the stance chip above.
Discussion (0). Sign in to comment.