REVIEW 4 major objections 5 minor 2 cited by
ChartMark: A Structured Grammar for Chart Annotation
T0 review · 4 major / 5 minor · reviewed 2026-08-06 · deepseek-v4-flash
Pith's one-line read ChartMark claims that chart annotations reduce to five semantic dimensions plus a hierarchical grammar, so the same annotation can render on any platform.
desk verdict A useful annotation grammar with a real internal inconsistency: the taxonomy in Table 1 includes task types the formal grammar cannot encode. read the letter →
The pith
A machine-rendered reading of the paper's core claim, the machinery that carries it, and where it could break.
The reading
What carries the argument
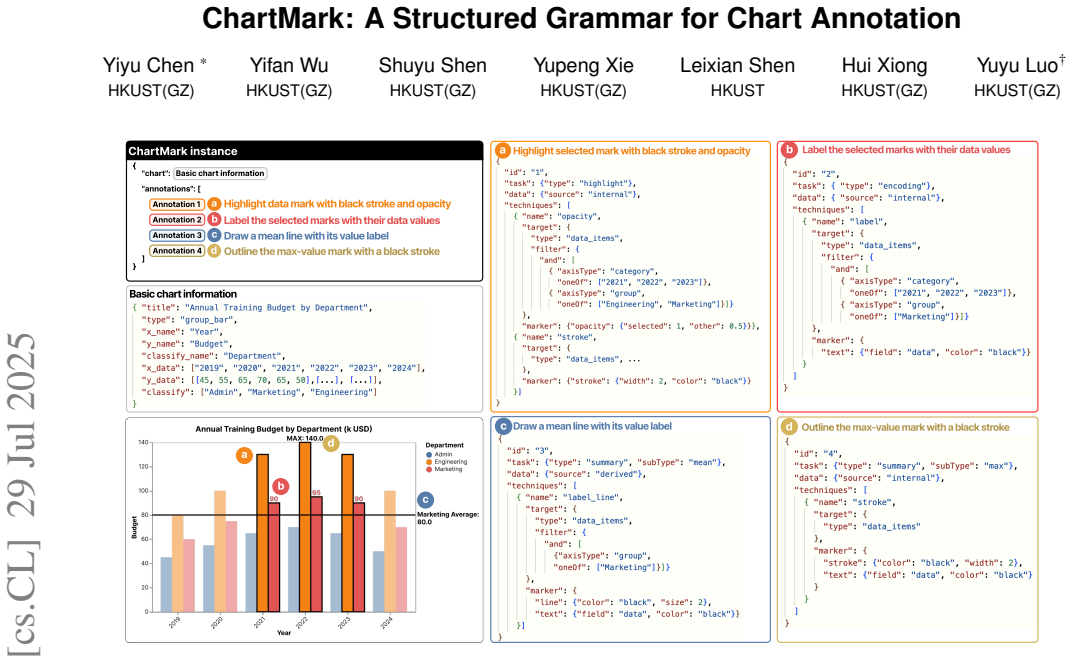
The load-bearing object is the ChartMark grammar itself, expressed as a hierarchical JSON structure. Its outer layer separates the base chart from a pluggable list of annotations; its middle layer groups each annotation's Task, Data, and Operation lists; its inner layer pins each operation to a Target and the Marker parameters it sets. The grammar's power comes from two design choices: a taxonomy of annotation dimensions synthesized from prior design-space work, and atomic Marker and Operation components (such as color, opacity, and dashed lines) that can be reused and combined into composite annotations. Custom annotations are added by registering new nodes in an abstract syntax tree and writing transformation logic to a target language.
What would settle it
Take a sample of annotated charts from published sources and attempt to encode every annotation as (id, task, data, operations) using only the six task types reference, highlight, description, summary, trend, and encoding; any annotation that cannot be classified, or that changes meaning when round-tripped through the Vega-Lite converter, would falsify the exhaustiveness claim.
Extended reading notes
Core claim
The central claim is that the space of chart annotations is finite enough to be captured by a structured grammar. Every annotated chart is written as annotatedChart := (chart, annotations), where the base chart is separated from a list of annotation units, and each annotation is a tuple (id, task, data, operations). Task takes one of six types, reference, highlight, description, summary, trend, and encoding, with optional subtypes; Data specifies where the annotation's information comes from, external, derived, internal, or none; each Operation names a behavior, a Target (data items, coordinate, chart element, or annotation), and the Marker visual elements it adds or modifies. Because the representation is hierarchical and modular, high-level intent and low-level visual detail live in the same specification yet remain separable. The paper's demonstration converts ChartMark JSON into working Vega-Lite charts, including highlight, label, mean-line, reference-region, and grid-line annotations.
Load-bearing premise
The grammar is only as comprehensive as its five dimensions and its six task types; if a real chart annotation does not fit one of those task categories, the central claim that ChartMark covers the annotation space starts to give way.
Editorial extensions
If this is right
- An annotation specified once in ChartMark can be ported to another charting system by swapping only the converter, not the annotation's meaning.
- Because annotations are separate modules outside the base chart, adding or deleting one annotation leaves the chart structure unchanged.
- The enumerated task types give downstream tools a stable vocabulary for searching, filtering, or automatically generating annotations by intent.
- New annotation types can be assembled from existing atomic components plus a custom node, reducing the work of extending the grammar.
Reading between the lines
- If the exhaustiveness claim holds, ChartMark could serve as a target schema for natural-language annotation generators, letting models output semantics instead of tool-specific code.
- The same decoupling would make annotations shareable as data objects, enabling libraries of reusable annotation templates and cross-paper comparison of annotation practices.
- A natural test is to take a diverse corpus of annotated charts from real publications and check whether every annotation maps cleanly onto the grammar; the paper itself does not report such a coverage study.
Editorial analysis
A structured set of objections, weighed in public.
Referee Report
Summary. The paper introduces ChartMark, a JSON-based structured grammar for chart annotations intended to separate annotation semantics from visualization implementations. It defines six annotation dimensions, a formal grammar with production rules for tasks, data, operations, targets, and markers, and a Python toolkit that converts ChartMark specifications into Vega-Lite visualizations. The central claims are comprehensiveness and extensibility (DC1), language independence (DC2), modularity (DC3), multi-level semantics (DC4), and atomic element design (DC5).
Significance. If its central claims are substantiated, ChartMark would provide a valuable abstraction layer for porting chart annotations across visualization platforms. The paper's decoupling idea is timely, and the open-source toolkit makes the approach concrete and reproducible. However, the comprehensiveness claim is currently asserted rather than demonstrated, and the formal grammar is incomplete in places, so the contribution is promising but not yet fully supported.
major comments (4)
- [Section 4.2.2, Eq. (6); Table 1] The formal grammar is internally inconsistent with the paper's own task taxonomy. Table 1 lists 'highlight, compare, explain' as example task goals, but Eq. (6) restricts task type to reference | highlight | description | summary | trend | encoding, omitting compare and explain. There is no subtype mechanism that recovers these goals: the subType field in Eq. (5) is only defined for particular types (e.g., summary with max/min) and Eq. (6) has no extension slot. Section 5.2's extensibility mechanism requires registering a new node in the AST and writing converter logic, which is an implementation-level extension rather than a grammar-level construct. Consequently, a 'compare A and B' annotation cannot be expressed without mislabeling it or modifying the grammar, directly undermining the DC1 comprehensiveness claim and the portability guarantee for such annotations.
- [Section 3 (DC1), Section 4.2.2] The claim that the enumerated dimensions and task types are comprehensive is not validated. The paper does not report a user study, a systematic survey, a corpus analysis, or a formal argument for exhaustiveness. The task type set in Eq. (6) is presented as an axiom, and the dimensions in Table 1 are attributed to prior taxonomies without showing that the union is complete. Since DC1 is the central contribution, the authors should provide evidence, such as a mapping of existing annotation taxonomies onto ChartMark or an evaluation over a corpus of annotated charts, or alternatively soften the claim to coverage of the surveyed design space.
- [Section 4.2, Eqs. (2), (13), (15)-(17)] The formal grammar is incomplete as specified. Eq. (2) uses ellipses after x_name, y_name; Eq. (13) leaves target parameters unspecified after type; Eq. (15) and Eq. (17) define marker and text with ellipses and an undefined production (text := . . .). Because the grammar is the paper's main formal artifact, these omissions make it difficult to assess which annotations are actually representable and whether the portability claim holds. A complete BNF/EBNF or a precise statement that the grammar is an abbreviated sketch is needed.
- [Section 5.1, Figure 2] The language-independence claim (DC2) is only partially supported. The toolkit converts ChartMark to Vega-Lite, but Figure 2 shows converters for ECharts and D3.js as well, and no implementation or evaluation for these is provided. The portability claim would be considerably strengthened by demonstrating at least one additional converter, or by explicitly framing the current toolkit as a Vega-Lite proof-of-concept.
minor comments (5)
- [Section 4] 'CharMark' appears to be a typo for 'ChartMark' in the sentence 'Please see the homepage of CharMark (chartmark.github.io).'
- [Figure 2] The figure implies full converter support for Vega-Lite, ECharts, and D3.js, but only the Vega-Lite converter is described in Section 5; please clarify in the caption.
- [Section 4.2.2, Eq. (5)] The subtype semantics would benefit from a complete list of valid subtype values for each task type; the summary/max-min example is helpful but not sufficient for reproducible grammar use.
- [Section 4.1] The capitalization of 'Annotation list' in the bullet points is inconsistent with the lowercase 'annotations' used in the JSON examples; please align terminology.
- [References] Reference [17] appears to duplicate the Draco paper title with inconsistent capitalization ('draco' vs. 'Draco'); please verify the citation formatting.
Circularity Check
No circular derivation: ChartMark's grammar is definitional, and its internal Table 1/Eq. 6 mismatch is a completeness gap, not circularity.
full rationale
The paper's derivation chain is a design proposal rather than a predictive or first-principles result. The grammar components in Section 4.1 are defined directly, and the formal productions in Eqs. 1-17 fix the vocabulary (task types, targets, markers); no parameter is fitted to a subset of data and then used to predict a closely related quantity, and no uniqueness theorem from the authors' prior work is invoked. The taxonomy in Table 1 is attributed to prior design-space studies [17,18,31,30,14,9,19,12,8], and the authors' own earlier papers appear only as related work or future-work pointers, not as load-bearing evidence. The 'comprehensive' claim (DC1, Section 3) is an asserted design goal rather than a result derived from the grammar, so its lack of external validation is an evidence/completeness concern, not circularity. One internal inconsistency is worth flagging: Table 1 lists example task goals 'highlight, compare, explain', while Eq. 6 enumerates task types as reference | highlight | description | summary | trend | encoding, with no grammar-level extension slot; 'compare' and 'explain' are therefore not formally expressible as task types without the code-level AST extension described in Section 5.2. This is a completeness/consistency limitation, not a circular step, because the grammar does not derive those terms from itself. The Vega-Lite converter demonstration is self-contained implementation code, not a renamed version of the grammar's definitions. The score of 1 reflects only the presence of many self-citations in the reference list; none are load-bearing.
Assumptions & free parameters
assumptions (3)
- domain assumption The five annotation dimensions (Data, Task, Marker, Target, Operation) are exhaustive for chart annotations.
- ad hoc to paper The task type set {reference, highlight, description, summary, trend, encoding} is exhaustive.
- domain assumption A hierarchical JSON layout is a faithful representation of annotation semantics.
invented entities (1)
-
ChartMark grammar
independent evidence
Cite this review
Pith. "Pith review of ChartMark: A Structured Grammar for Chart Annotation." pith.science (2026). https://pith.science/paper/Q4XXGT6R
@misc{pith2026250721810,
  author       = {Pith},
  title        = {Pith review of: ChartMark: A Structured Grammar for Chart Annotation},
  year         = {2026},
  howpublished = {\url{https://pith.science/paper/Q4XXGT6R}},
  note         = {Machine review of arXiv:2507.21810}
}
read the original abstract
Chart annotations enhance visualization accessibility but suffer from fragmented, non-standardized representations that limit cross-platform reuse. We propose ChartMark, a structured grammar that separates annotation semantics from visualization implementations. ChartMark features a hierarchical framework mapping onto annotation dimensions (e.g., task, chart context), supporting both abstract intents and precise visual details. Our toolkit demonstrates converting ChartMark specifications into Vega-Lite visualizations, highlighting its flexibility, expressiveness, and practical applicability.
Figures


Figures from the paper (2 more)


Forward citations
Cited by 2 Pith papers
-
AnnoBench: A Benchmark for Visualization Annotation Generation
A benchmark for chart annotation generation with a five-dimensional rubric shows current LLMs annotate code-based charts well but distort raster charts and over-rely on explicit instructions.
-
Demonstrating chart-plot: Closing the Last Mile of Academic Chart Generation
chart-plot is an agentic harness using style-aware code generation from venue figures, a LaTeX-aware render-and-revise loop, and structured edit handles to produce top-venue-ready academic charts.
Reference graph
Works this paper leans on
-
[1]
https://www.adobe.com/products/ illustrator, 2025
Adobe illustrator. https://www.adobe.com/products/ illustrator, 2025. 2
work page 2025
- [2]
- [3]
-
[4]
S. Bateman, R. L. Mandryk, C. Gutwin, A. Genest, D. McDine, and C. Brooks. Useful junk? the effects of visual embellishment on com- prehension and memorability of charts. In Proceedings of the SIGCHI conference on human factors in computing systems , pp. 2573–2582,
-
[5]
M. Bostock, V . Ogievetsky, and J. Heer. D3: Data-Driven Docu- ments. IEEE Transactions on Visualization and Computer Graphics, 17(12):2301–2309, 2011. 2
work page 2011
-
[6]
M. Bostock, V . Ogievetsky, and J. Heer. D ³ data-driven docu- ments. IEEE Transactions on Visualization and Computer Graphics, 17(12):2301–2309, 2011. doi: 10.1109/TVCG.2011.185 2
-
[7]
M. Brehmer, B. Lee, N. H. Riche, D. Tittsworth, K. Lytvynets, D. Edge, and C. White. Timeline storyteller. InProceedings of the Computation+ Journalism Symposium, Miami, FL, USA, vol. 6, 2019. 2
work page 2019
-
[8]
C. Bryan, K.-L. Ma, and J. Woodring. Temporal summary images: An approach to narrative visualization via interactive annotation generation and placement. IEEE transactions on visualization and computer graphics, 23(1):511–520, 2016. 3
work page 2016
Show all 42 references
-
[9]
Q. Chen, Z. Liu, C. Wang, X. Lan, Y . Chen, S. Chen, and N. Cao. Vizbelle: A design space of embellishments for data visualization. arXiv preprint arXiv:2209.03642, 2022. 1, 2, 3, 4
2022 arXiv
-
[10]
Eccles, T
R. Eccles, T. Kapler, R. Harper, and W. Wright. Stories in geotime. Information Visualization, 7(1):3–17, 2008. 2
2008
-
[11]
J. Hao, M. Yang, Q. Shi, Y . Jiang, G. Zhang, and W. Zeng. Fin- flier: Automating graphical overlays for financial visualizations with knowledge-grounding large language model. IEEE Transactions on Visualization and Computer Graphics, pp. 1–17, 2024. 2
2024
-
[12]
Hullman, N
J. Hullman, N. Diakopoulos, and E. Adar. Contextifier: automatic generation of annotated stock visualizations. In Proceedings of the SIGCHI Conference on human factors in computing systems, pp. 2707– 2716, 2013. 2, 3
2013
-
[13]
J. D. Hunter. Matplotlib: A 2d graphics environment. Computing in Science & Engineering, 9(3):90–95, 2007. 2
2007
-
[14]
Kong and M
N. Kong and M. Agrawala. Graphical overlays: Using layered elements to aid chart reading. IEEE transactions on visualization and computer graphics, 18(12):2631–2638, 2012. 3
2012
-
[15]
C. Li, J. Zhao, B. Lee, Q. Yuan, and X. Luo. Echarts: A declarative framework for rapid construction of web-based visualization. Visual Informatics, 2(1):1–12, 2018. 2
2018
-
[16]
Y . Luo, X. Qin, N. Tang, and G. Li. Deepeye: Towards automatic data visualization. In ICDE, pp. 101–112. IEEE Computer Society, 2018. 1
2018
-
[17]
Moritz, C
D. Moritz, C. Wang, G. L. Nelson, H. Lin, A. M. Smith, B. Howe, and J. Heer. Formalizing visualization design knowledge as constraints: Actionable and extensible models in draco. IEEE transactions on visualization and computer graphics, 25(1):438–448, 2018. 1, 3
2018
-
[18]
M. D. Rahman, G. J. Quadri, B. Doppalapudi, D. A. Szafir, and P. Rosen. A qualitative analysis of common practices in annotations: A taxonomy and design space. IEEE Transactions on Visualization and Computer Graphics, pp. 360 – 370, 2024. 1, 2, 3, 4
2024
-
[19]
D. Ren, M. Brehmer, B. Lee, T. Höllerer, and E. K. Choe. Chartac- cent: Annotation for data-driven storytelling. In 2017 IEEE Pacific Visualization Symposium (PacificVis), pp. 230–239. Ieee, 2017. 1, 2, 3, 4
2017
-
[20]
D. Ren, B. Lee, and M. Brehmer. Charticulator: Interactive construc- tion of bespoke chart layouts. IEEE transactions on visualization and computer graphics, 25(1):789–799, 2018. 1
2018
-
[21]
Satyanarayan, D
A. Satyanarayan, D. Moritz, K. Wongsuphasawat, and J. Heer. Vega- Lite: A Grammar of Interactive Graphics. IEEE Transactions on Visualization and Computer Graphics, 23(1):341–350, 2017. 1, 2, 4
2017
-
[22]
Satyanarayan, K
A. Satyanarayan, K. Wongsuphasawat, and J. Heer. Declarative inter- action design for data visualization. In Proceedings of the 27th Annual ACM Symposium on User Interface Software and Technology (UIST), pp. 669–678. ACM, 2014. doi: 10.1145/2642918.2647360 2
2014
-
[23]
L. Shen, H. Li, Y . Wang, and H. Qu. Reflecting on Design Paradigms of Animated Data Video Tools. In Proceedings of the 2025 CHI Conference on Human Factors in Computing Systems, pp. 1–21. ACM,
2025
-
[24]
L. Shen, H. Li, Y . Wang, X. Xie, and H. Qu. Prompting Generative AI with Interaction-Augmented Instructions. In Extended Abstracts of the CHI Conference on Human Factors in Computing Systems, CHI EA ’25, pp. 1–9. ACM, 2025. 4
2025
-
[25]
L. Shen, E. Shen, Y . Luo, X. Yang, X. Hu, X. Zhang, Z. Tai, and J. Wang. Towards Natural Language Interfaces for Data Visualization: A Survey. IEEE Transactions on Visualization and Computer Graphics, 29(6):3121–3144, 2023. 4
2023
-
[26]
L. Shen, E. Shen, Z. Tai, Y . Song, and J. Wang. TaskVis: Task- oriented Visualization Recommendation. In Proceedings of the 23th Eurographics Conference on Visualization, EuroVis’21 , pp. 91–95. Eurographics, 2021. 2
2021
-
[27]
L. Shen, E. Shen, Z. Tai, Y . Wang, Y . Luo, and J. Wang. GALVIS: Visualization Construction through Example-Powered Declarative Pro- gramming. In Proceedings of the 31st ACM International Conference on Information & Knowledge Management, CIKM’22, pp. 4975–4979. ACM, 2022. 2
2022
-
[28]
L. Shen, E. Shen, Z. Tai, Y . Xu, J. Dong, and J. Wang. Visual Data Analysis with Task-Based Recommendations. Data Science and Engi- neering, 7(4):354–369, 2022. 2
2022
-
[29]
L. Shen, Z. Tai, E. Shen, and J. Wang. Graph Exploration With Embedding-Guided Layouts. IEEE Transactions on Visualization and Computer Graphics, 30(7):3693–3708, 2024. 4
2024
-
[30]
S. Shen, S. Lu, L. Shen, Z. Sheng, N. Tang, and Y . Luo. Ask humans or ai? exploring their roles in visualization troubleshooting. arXiv preprint arXiv:2412.07673, 2024. 3
2024
-
[31]
Y . Shi, B. Li, Y . Luo, L. Chen, and N. Tang. Augmenting realistic charts with virtual overlays. In Proceedings of the 2025 CHI Conference on Human Factors in Computing Systems, pp. 1–23, 2025. 1, 3
2025
-
[32]
Siddiqui, A
T. Siddiqui, A. Kim, J. Lee, K. Karahalios, and A. Parameswaran. Effortless data exploration with zenvisage: An expressive and interac- tive visual analytics system. Proceedings of the VLDB Endowment, 10(4):457–468, 2016. 2
2016
-
[33]
Stolte, D
C. Stolte, D. Tang, and P. Hanrahan. Polaris: a system for query, analysis, and visualization of multidimensional relational databases. IEEE Transactions on Visualization and Computer Graphics, 8(1):52– 65, 2002. 1, 2
2002
-
[34]
H. Wickham. A Layered Grammar of Graphics. Journal of Computa- tional and Graphical Statistics, 19(1):3–28, 2010. 1, 2
2010
-
[35]
H. Wickham. ggplot2: Elegant Graphics for Data Analysis. Springer International Publishing, 2 ed., 2016. 2
2016
-
[36]
Wilkinson
L. Wilkinson. The grammar of graphics, in ‘handbook of computational statistics’, 2012. 2
2012
-
[37]
Y . Wu, L. Yan, L. Shen, Y . Mei, J. Wang, and Y . Luo. Chartcards: A chart-metadata generation framework for multi-task chart understand- ing. arXiv preprint arXiv:2505.15046, 2025. 1
2025
-
[38]
Y . Wu, L. Yan, L. Shen, Y . Wang, N. Tang, and Y . Luo. ChartInsights: Evaluating Multimodal Large Language Models for Low-Level Chart Question Answering. In Findings of the Association for Computational Linguistics: EMNLP 2024, pp. 12174–12200. ACL, Stroudsburg, PA, USA, 2024. 1
2024
-
[39]
Y . Wu, L. Yan, Y . Zhu, Y . Mei, J. Wang, N. Tang, and Y . Luo. Boost- ing text-to-chart retrieval through training with synthesized semantic insights. arXiv preprint arXiv:2505.10043, 2025. 1
2025
-
[40]
Y . Xie, Y . Luo, G. Li, and N. Tang. Haichart: Human and ai paired visu- alization system. Proceedings of the VLDB Endowment, 17(11):3178– 3191, 2024. 2
2024
-
[41]
X. Yang, Y . Wu, Y . Zhu, N. Tang, and Y . Luo. Askchart: Univer- sal chart understanding through textual enhancement. arXiv preprint arXiv:2412.19146, 2024. 1
2024 arXiv
-
[42]
Y . Yu, L. Shen, F. Long, H. Qu, and H. Chen. PyGWalker: On-the-fly Assistant for Exploratory Visual Data Analysis. In Proceedings of IEEE Visualization and Visual Analytics, IEEE VIS’24, pp. 1–5, 2024. 2
2024
Reviewed August 6, 2026 · model on record in the stance chip above.
Discussion (0). Sign in to comment.