REVIEW 3 major objections 4 minor 43 references
GeoOutageKG: A Multimodal Geospatiotemporal Knowledge Graph for Multiresolution Power Outage Analysis
T0 review · 3 major / 4 minor · reviewed 2026-08-06 · deepseek-v4-flash
Pith's one-line read The paper builds GeoOutageKG, a queryable knowledge graph that links county-level power outage reports, nightly satellite imagery, and derived outage maps so outage severity can be analyzed jointly at multiple spatial and temporal…
desk verdict Solid KG construction with a genuine integration artifact, but the unvalidated OutageMap modality and overbroad claims need revision before the resource is trusted. read the letter →
The pith
A machine-rendered reading of the paper's core claim, the machinery that carries it, and where it could break.
The reading
What carries the argument
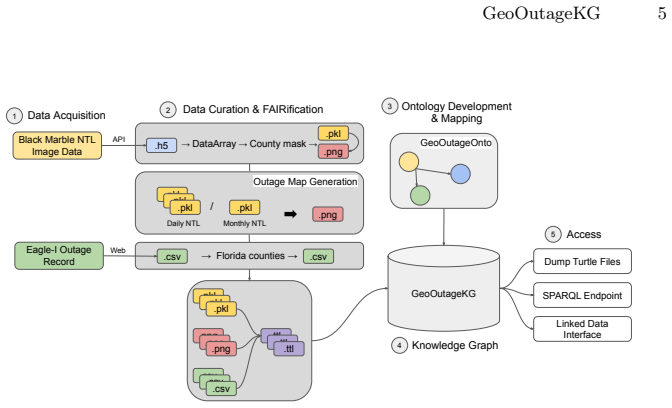
The object that carries the argument is GeoOutageOnto, an OWL2 ontology whose three subontologies correspond to the three data modalities: OutageRecord, NTLImage, and OutageMap. Each instance is tied to a county through a representsCounty relation, the images and maps are typed as Image resources, and satellite and sensor information is linked through fromSatellite and fromSensor relations. This shared spatial and temporal grounding is what lets a single query retrieve, for a specified county and date range, the raw nightly image, the derived outage map, and the corresponding outage records. The knowledge graph is stored as RDF/Turtle and exposed through a SPARQL endpoint.
What would settle it
For a set of county-date pairs in GeoOutageKG, count how often large dark areas in an OutageMap occur while the corresponding OutageRecord shows few or no customers out; if the mismatch is frequent and systematic, for example during moonlit or cloudy nights with no reported outages, the derived maps cannot anchor the analysis.
Extended reading notes
Core claim
The discovery is that heterogeneous outage datasets can be semantically unified into a single RDF knowledge graph without forcing them into one spatial or temporal grid. GeoOutageKG represents each modality as its own ontology class: OutageRecord for the time series, NTLImage for nightly county-masked satellite imagery, and OutageMap for derived outage severity maps. Each instance is tied to a county and date, so a query about a specific place and time window can return reported customer outages, raw imagery, and derived maps together. The authors demonstrate this with a SPARQL query for Lee County around Hurricane Ian that retrieves all three modalities and filters for outage surges above 100 customers.
Load-bearing premise
The outage maps come out of a model that compares nightly satellite brightness to the average of the previous three months, and they are stored as real outage observations even though the paper reports no check of those maps against ground truth.
Editorial extensions
If this is right
- A single SPARQL query can join the three modalities for a county and storm window, so severity can be assessed jointly from imagery and reported outages rather than from one source.
- The resource currently covers all 67 Florida counties over roughly a decade, with outage records from 2014 to 2024 and imagery from 2012 to 2025, giving enough breadth for historical multiresolution analyses.
- Because the schema reuses existing linked-data vocabularies for administrative regions, satellites, sensors, and image media, adding new data types such as weather, infrastructure, or demographics does not require redesigning the graph.
- The same construction pipeline can be applied to other states or national subdivisions, since the ontology is not Florida-specific.
Reading between the lines
- Given the 15-minute cadence of the outage records and the daily cadence of the imagery, one extension the paper does not develop is using the graph to interpolate sub-county outage extent between satellite overpasses.
- A natural next test would be to compute the overlap between dark regions in OutageMap instances and county-level outage counts across all hurricane windows; a strong correlation would validate the maps, while a null result would suggest treating that modality as provisional.
- If the maps do hold up, the same ontology could be repurposed for non-hurricane outage causes, such as winter storms or heat-driven grid failures, since the schema separates event context from the three data modalities.
- The paper floats a large-language-model retrieval interface as future work; nothing in the design blocks building a natural-language query layer over the SPARQL endpoint and testing it against direct SPARQL answers.
Editorial analysis
A structured set of objections, weighed in public.
Referee Report
Summary. This paper describes the construction of GeoOutageKG, a knowledge graph for Florida power outage analysis that integrates three data modalities: county-level EAGLE-I outage time series (about 10.6 million records, 2014-2024), NASA Black Marble nighttime-light images (about 314,000 county-night images, 2012-2025), and derived outage maps (about 15,500) generated by a VST-GNN baseline-difference method. The authors present GeoOutageOnto, an OWL2 ontology reusing DBpedia, GEOSatDB, and W3C Media Resources, report instance and triple statistics, and illustrate querying with a SPARQL example for Hurricane Ian. The resource is publicly available with code and ontology documentation.
Significance. The main contribution is the semantic integration and public release of disparate outage datasets, with substantial curation effort visible in the statistics and in the reuse of established vocabularies. Reproducibility is supported by the GitHub and OSF repositories. However, the headline claims of improved outage analysis and multiresolution reasoning are not yet demonstrated: no evaluation against single-modality baselines is provided, and the derived OutageMap modality is unvalidated. The resource is potentially valuable, but its central value proposition requires additional validation and, in places, more modest or better-supported claims.
major comments (3)
- [§3.2, §4.2] The OutageMap class is a primary modality but is generated without validation. Section 3.2 states that outage maps come from 'Aparcedo et al.'s VST-GNN model ground-truth visualizations' by comparing daily radiance with the three-month mean. No error analysis or comparison with EAGLE-I records (already present in the same knowledge graph) is given, and the Limitations section does not acknowledge this. Because the severity use case in Section 5.1 treats these maps as valid outage representations, the 'robust multimodal data integration' claim is unsupported at a load-bearing point. I request either a direct validation of a sample of OutageMap instances against EAGLE-I records or a clearly stated uncertainty and limitation discussion, together with an assessment of what the integration adds beyond the raw NTL data.
- [Abstract; §5] The abstract and introduction state that integrating these sources 'can substantially improve power outage detection, analysis, and predictive reasoning,' but Section 5 only shows a SPARQL query that returns records, images, and maps for Lee County. There is no experiment, baseline, or quantitative metric demonstrating improvement over single-modality analysis. Either add such an evaluation or revise the claims to describe the resource as enabling queries rather than as demonstrated to improve detection, analysis, or prediction.
- [§3.2, §3.3, §5.1] The claimed 'multiresolution' capability is not implemented as queryable sub-county knowledge: NTLImage and OutageMap instances are county-level image objects with only frame metadata and a locator, and the example query in Figure 4 binds counties, not pixels or sub-county geometries. The text says satellite data can reveal 'sub-county outage patterns,' but the graph's SPARQL interface is not shown to expose such granularity. Please clarify whether pixel-level or geometry-based querying (for example via GeoSPARQL) is supported, and demonstrate it with a concrete query; otherwise adjust the multiresolution claim to what the knowledge graph actually provides.
minor comments (4)
- [Various] There are several typographical errors, including 'Inthispaper' in the Abstract, 'Natural Langauge Processing' in Section 2.1, and 'maintencance' in Section 2.1.
- [§4.2, footnote 3] The text says the outage maps cover the 'five most recent major hurricanes' but footnote 3 groups Helene and Milton as one data campaign, implying about four event groups; please clarify how the 58 maps per county per hurricane figure is computed.
- [Figure 4, §3.3] The SPARQL query uses `goo:hasNTLImage` and `goo:hasOutageMap`, but these properties are not defined or described in Section 3.3; please define them in the ontology description or modify the query to use only documented predicates.
- [§2.3, §5.1] GeoSPARQL is described in Related Work, but the provided SPARQL example does not use GeoSPARQL and no geospatial query is shown; please state explicitly whether the GeoOutageKG endpoint supports GeoSPARQL and, if so, illustrate it.
Circularity Check
GeoOutageKG is a data-integration construction with no derivation that reduces to its inputs; self-citations are not load-bearing.
full rationale
GeoOutageKG's central contribution is the construction of a semantic resource, not a fitted prediction. The pipeline retrieves external datasets (EAGLE-I outage records and NASA Black Marble NTL imagery), filters them, maps them to GeoOutageOnto, and exposes them as RDF triples. The derived OutageMap class is generated by comparing daily NTL radiance to a three-month baseline, following Aparcedo et al. and external references [10,12,19]; this is a data-processing step with no free parameter that is subsequently renamed as a prediction, and it is not defined in terms of the knowledge graph's own outputs. The demonstrated use cases are SPARQL queries over the assembled graph, not empirical claims whose outcome is fixed by construction. The only self-citations are the VST-GNN model (co-authored by Li) used as a tool for map generation and the MDS-Onto project affiliation; neither supplies an unverified premise that makes the construction equivalent to its inputs. The absence of validation or error analysis for the OutageMap modality is a correctness and robustness limitation, not a circularity: a biased data source would make the KG less reliable, but would not make the KG's derivation reduce to its inputs. No equation is shown to equal another by construction, and no fitted parameter is relabeled as a discovery. The ontology reuses established vocabularies (DBpedia, GEOSatDB, Ontology for Media Resources), and the data sources are external and independently documented. The paper is therefore self-contained as a resource-construction paper, and the circularity score is 0.
Assumptions & free parameters
assumptions (4)
- domain assumption EAGLE-I county-level outage counts accurately reflect actual power outages.
- domain assumption Changes in VIIRS nighttime light radiance, relative to a three-month baseline, indicate power outage extent and severity.
- ad hoc to paper VST-GNN model visualizations provide correct 'ground-truth' outage maps.
- domain assumption Reused ontologies (DBpedia, GEOSatDB, Ontology for Media Resources) are accurate and appropriate for linking.
Cite this review
Pith. "Pith review of GeoOutageKG: A Multimodal Geospatiotemporal Knowledge Graph for Multiresolution Power Outage Analysis." pith.science (2026). https://pith.science/paper/4Z3DXENB
@misc{pith2026250722878,
  author       = {Pith},
  title        = {Pith review of: GeoOutageKG: A Multimodal Geospatiotemporal Knowledge Graph for Multiresolution Power Outage Analysis},
  year         = {2026},
  howpublished = {\url{https://pith.science/paper/4Z3DXENB}},
  note         = {Machine review of arXiv:2507.22878}
}
read the original abstract
Detecting, analyzing, and predicting power outages is crucial for grid risk assessment and disaster mitigation. Numerous outages occur each year, exacerbated by extreme weather events such as hurricanes. Existing outage data are typically reported at the county level, limiting their spatial resolution and making it difficult to capture localized patterns. However, it offers excellent temporal granularity. In contrast, nighttime light satellite image data provides significantly higher spatial resolution and enables a more comprehensive spatial depiction of outages, enhancing the accuracy of assessing the geographic extent and severity of power loss after disaster events. However, these satellite data are only available on a daily basis. Integrating spatiotemporal visual and time-series data sources into a unified knowledge representation can substantially improve power outage detection, analysis, and predictive reasoning. In this paper, we propose GeoOutageKG, a multimodal knowledge graph that integrates diverse data sources, including nighttime light satellite image data, high-resolution spatiotemporal power outage maps, and county-level timeseries outage reports in the U.S. We describe our method for constructing GeoOutageKG by aligning source data with a developed ontology, GeoOutageOnto. Currently, GeoOutageKG includes over 10.6 million individual outage records spanning from 2014 to 2024, 300,000 NTL images spanning from 2012 to 2024, and 15,000 outage maps. GeoOutageKG is a novel, modular and reusable semantic resource that enables robust multimodal data integration. We demonstrate its use through multiresolution analysis of geospatiotemporal power outages.
Figures


Figures from the paper (1 more)

Reference graph
Works this paper leans on
-
[1]
IEEE Access 11, 7682–7697 (2023).https://doi.org/10.1109/ACCESS.2023.3235615
Abdelmalak, M., Cox, J., Ericson, S., Hotchkiss, E., Benidris, M.: Quantitative resilience-based assessment framework using EAGLE-I power outage data. IEEE Access 11, 7682–7697 (2023).https://doi.org/10.1109/ACCESS.2023.3235615
arXiv 2023
-
[2]
Multimodal Power Outage Prediction for Rapid Disaster Response and Resource Allocation
Aparcedo, A., Lopez, C., Kotta, A., Li, M.: Multimodal power outage prediction for rapid disaster response and resource allocation (2024).https://doi.org/10. 48550/arXiv.2410.00017
work page Pith review arXiv doi:10.48550/arxiv.2410.00017 2024
-
[3]
Auer, S., Bizer, C., Kobilarov, G., Lehmann, J., Cyganiak, R., Ives, Z.: DBpedia: a nucleus for a web of open data. In: Proceedings of the 6th International The Semantic Web and 2nd Asian Conference on Asian Semantic Web Conference. p. 722–735. ISWC’07/ASWC’07, Springer-Verlag, Berlin, Heidelberg (2007)
work page 2007
-
[4]
Semantic Web3, 355–370 (Oct 2012).https://doi.org/10.3233/ SW-2012-0065
Battle, R., Kolas, D.: Enabling the geospatial semantic web with parliament and GeoSPARQL. Semantic Web3, 355–370 (Oct 2012).https://doi.org/10.3233/ SW-2012-0065
work page 2012
-
[5]
Beckett, D., Berners-Lee, T., Prud’hommeaux, E., Carothers, G.: RDF 1.1 turtle (Feb 2014),https://www.w3.org/TR/turtle/
work page 2014
-
[6]
In: Proceedings of the 2008 ACM SIGMOD International Conference on Management of Data
Bollacker, K., Evans, C., Paritosh, P., Sturge, T., Taylor, J.: Freebase: a collabo- ratively created graph database for structuring human knowledge. In: Proceedings of the 2008 ACM SIGMOD International Conference on Management of Data. p. 1247–1250. SIGMOD ’08, Association for Computing Machinery, New York, NY, USA (2008). https://doi.org/10.1145/1376616.1376746
arXiv 2008
-
[7]
In: Burges, C., Bottou, L., Welling, M., Ghahramani, Z., Weinberger, K
Bordes, A., Usunier, N., Garcia-Duran, A., Weston, J., Yakhnenko, O.: Translating embeddings for modeling multi-relational data. In: Burges, C., Bottou, L., Welling, M., Ghahramani, Z., Weinberger, K. (eds.) Advances in Neural Information Processing Systems. vol. 26. Curran Associates, Inc. (2013), https://proceedings.neurips.cc/paper_files/paper/2013/fil...
work page 2013
-
[8]
Scientific Data11(1), 271 (2024)
Brelsford, C., Tennille, S., Myers, A., Chinthavali, S., Tansakul, V., Denman, M., Coletti, M., Grant, J., Lee, S., Allen, K., et al.: A dataset of recorded electricity outages by United States county 2014–2022. Scientific Data11(1), 271 (2024)
work page 2024
Show all 43 references
-
[9]
Bucci, L., Alaka, L., Hagen, A., Delgado, S., Beven, J.: National Hurricane Center tropical cyclone report - Hurricane Ian (Apr 2023),https://www.nhc.noaa.gov/ data/tcr/AL092022_Ian.pdf
2023
-
[10]
Remote Sens- ing 9(3) (2017)
Cole, T.A., Wanik, D.W., Molthan, A.L., Román, M.O., Griffin, R.E.: Syner- gistic use of nighttime satellite data, electric utility infrastructure, and ambient population to improve power outage detections in urban areas. Remote Sens- ing 9(3) (2017). https://doi.org/10.3390/r...
2017 doi
-
[11]
In: WSP/WOMoCoE@ ISWC
Cuenca, J., Larrinaga, F., Curry, E.: A unified semantic ontology for energy man- agement applications. In: WSP/WOMoCoE@ ISWC. pp. 86–97 (2017)
2017
-
[12]
Remote Sensing 15(3) (2023)
Cui, H., Qiu, S., Wang, Y., Zhang, Y., Liu, Z., Karila, K., Jia, J., Chen, Y.: Disaster-caused power outage detection at night using VIIRS DNB images. Remote Sensing 15(3) (2023). https://doi.org/10.3390/rs15030640, https: //www.mdpi.com/2072-4292/15/3/640
2023 doi
-
[13]
NOAA National Centers for Environmental Information (2019)
GOES-R Series Program: NOAA GOES-R Series Advanced Baseline Imager (ABI) Level 0 Data. NOAA National Centers for Environmental Information (2019). https://doi.org/10.25921/tvws-w071
2019 doi
-
[14]
Hagen, A.B., Cangialosi, J.P., Chenard, M., Alaka, L., Delgado, S.: National Hurricane Center tropical cyclone report - Hurricane Helene (Apr 2025),https: //www.nhc.noaa.gov/data/tcr/AL092024_Helene.pdf
2025
-
[15]
w3.org/TR/sparql11-query/
Harris, S., Seaborne, A.: SPARQL 1.1 query language (Mar 2013),https://www. w3.org/TR/sparql11-query/
2013
-
[16]
In revision, J
Hoyer, S., Hamman, J.: xarray: N-D labeled arrays and datasets in Python. In revision, J. Open Res. Software (2017)
2017
-
[17]
In: 2022 IEEE 21st Mediterranean Elec- trotechnical Conference (MELECON)
Huang, T., Baiocchi, M., Lei, X.: An ontological approach for automatic tracking causes of blackouts in power systems. In: 2022 IEEE 21st Mediterranean Elec- trotechnical Conference (MELECON). pp. 813–818 (2022).https://doi.org/10. 1109/MELECON53508.2022.9843078
2022
-
[18]
Data Intelligence 2(1-2), 10–29 (Jan 2020).https://doi.org/10.1162/dint_r_00024
Jacobsen, A., de Miranda Azevedo, R., Juty, N., Batista, D., Coles, S., Cornet, R., Courtot, M., Crosas, M., Dumontier, M., Evelo, C.T., Goble, C., Guizzardi, G., Hansen, K.K., Hasnain, A., Hettne, K., Heringa, J., Hooft, R.W., Imming, M., Jeffery, K.G., Kaliyaperumal, R., Ker...
2020
-
[19]
ISPRS - International Archives of the Photogrammetry, Remote Sens- ing and Spatial Information Sciences XLII-3, 1853–1856 (Apr 2018)
Kalb, V., Wang, Z., Román, M., Sun, Q., Molthan, A., Schultz, L.: Monitor- ing disaster-related power outages using NASA Black Marble nighttime light product. ISPRS - International Archives of the Photogrammetry, Remote Sens- ing and Spatial Information Sciences XLII-3, 1853–1...
2018 doi
-
[20]
Kefalidis, S., Plas, K., Koubarakis, M.: TerraQ: Spatiotemporal question-answering on satellite image archives (Feb 2025).https://doi.org/10.48550/arXiv.2502. 04415
2025 doi
-
[21]
Lee, W., Bailer, W., Bürger, T., Champin, P.A., Evain, J.P., Malaisé, V., Michel, T., Sasaki, F., Söderberg, J., Stegmaier, F., Strassner, J.: Ontology for media resources 1.0 (Feb 2012),https://www.w3.org/TR/mediaont-10/
2012
-
[22]
Big Earth Data 8, 1–18 (Mar 2024)
Lin, M., Jin, M., Li, J., Bai, Y.: GEOSatDB: global civil earth observation satellite semantic database. Big Earth Data 8, 1–18 (Mar 2024). https://doi.org/10. 1080/20964471.2024.2331992
2024
-
[23]
In: Hitzler, P., Fernández, M., Janowicz, K., Zaveri, A., Gray, A.J., Lopez, V., Haller, A., Hammar, K
Liu, Y., Li, H., Garcia-Duran, A., Niepert, M., Onoro-Rubio, D., Rosenblum, D.S.: Mmkg: Multi-modal knowledge graphs. In: Hitzler, P., Fernández, M., Janowicz, K., Zaveri, A., Gray, A.J., Lopez, V., Haller, A., Hammar, K. (eds.) The Semantic Web. pp. 459–474. Springer Internat...
2019
-
[24]
Frakes et al
Mahmoud, M.A., Tang, A.Y., Kumar, K., Law, N.L.L.M.F., Gurunathan, M., Ra- machandran, D.: An ontology-based predictive maintenance tool for power substa- 18 E. Frakes et al. tion faults in distribution grid. International Journal of Advanced Computer Sci- ence and Application...
2020 doi
-
[25]
In: Villazón- Terrazas, B., Ortiz-Rodríguez, F., Tiwari, S.M., Shandilya, S.K
Mederos,A.L.,García-Duarte,D.,Lio,D.G.,Hidalgo-Delgado,Y.,Ruíz,J.A.S.:An ontological model for the failure detection in power electric systems. In: Villazón- Terrazas, B., Ortiz-Rodríguez, F., Tiwari, S.M., Shandilya, S.K. (eds.) Knowledge Graphs and Semantic Web. pp. 130–146....
2020
-
[26]
NASA Earth Science Data and Information System Standards Coordination Office (2023)
Newman, D.J., (ESCO), E.S.C.O.: SpatioTemporal Asset Catalogs (STAC). NASA Earth Science Data and Information System Standards Coordination Office (2023). https://doi.org/10.5067/DOC/ESCO/ESDS-RFC-044v1
2023 doi
-
[27]
ontotext.com/documentation/11.0/
Ontotext: GraphDB: GraphDB 11.0 documentation (Jul 2025),https://graphdb. ontotext.com/documentation/11.0/
2025
-
[28]
In: IGARSS 2023 - 2023 IEEE International Geoscience and Remote Sensing Symposium
Punjani, D., Koubarakis, M., Tsalapati, E.: EarthQA: A question answering engine for earth observation data archives *. In: IGARSS 2023 - 2023 IEEE International Geoscience and Remote Sensing Symposium. pp. 1396–1399 (2023).https://doi. org/10.1109/IGARSS52108.2023.10282475
2023
-
[29]
Scientific Data 12, 628 (2025)
Rajamohan, B.P., Bradley, A.C.H., Tran, V.D., Gordon, J.E., Caldwell, H.W., Mehdi, R., Ponon, G., Tran, Q.D., Dernek, O., Kaltenbaugh, J., Pierce, B.G., Wieser, R., Yue, W., Lin, K., Kambo, J., Lopez, C., Nihar, A., Savage, D.J., Brown, D.W., Sharma, H., Giera, B., Tripathi, P...
2025
-
[30]
Remote Sensing of Environment210, 113–143 (2018).https://doi.org/10.1016/ j.rse.2018.03.017
Román, M.O., Wang, Z., Sun, Q., Kalb, V., Miller, S.D., Molthan, A., Schultz, L., Bell, J., Stokes, E.C., Pandey, B., Seto, K.C., Hall, D., Oda, T., Wolfe, R.E., Lin, G., Golpayegani, N., Devadiga, S., Davidson, C., Sarkar, S., Praderas, C., Schmaltz, J., Boller, R., Stevens, ...
2018
-
[31]
Earth Science Informatics (Dec 2017)
Rovetto, R.J.: An ontology for satellite databases. Earth Science Informatics (Dec 2017). https://doi.org/10.1007/s12145-017-0290-x
2017 doi
-
[32]
Sharma, K., Kumar, P., Li, Y.: OG-RAG: Ontology-grounded retrieval-augmented generation for large language models (2024),https://arxiv.org/abs/2412.15235
2024 arXiv
-
[33]
https://doi
Stefanini Vicente, G., Marty, R.: BlackMarblePy: Georeferenced Rasters and Statistics of Nighttime Lights from NASA Black Marble (2023). https://doi. org/10.5281/zenodo.10667907, https://worldbank.github.io/blackmarblepy
2023 doi
-
[34]
In: Proceedings of the 16th International Conference on World Wide Web
Suchanek, F.M., Kasneci, G., Weikum, G.: Yago: a core of semantic knowledge. In: Proceedings of the 16th International Conference on World Wide Web. p. 697–706. WWW ’07, Association for Computing Machinery, New York, NY, USA (2007). https://doi.org/10.1145/1242572.1242667
2007
-
[35]
Tansakul, V., Myers, A., Tennille, S., Denman, M., Hamaker, A., Huihui, J., Medlen, K., Allen, K., Redmon, D., Chinthavali, S., et al.: EAGLE-I power outage data 2014 - 2022 (May 2023).https://doi.org/10.13139/ORNLNCCS/1975202
2014
-
[36]
Future Generation Computer Systems160, 505–521 (2024)
Troumpoukis, A., Klampanos, I., Pantazi, D.A., Albughdadi, M., Baousis, V., Barrilero, O., Bojor, A., Branco, P., Bruzzone, L., Chietera, A., Fournand, P., Hall, R., Lazzarini, M., Luna, A., Nousias, A., Perentis, C., Petrakis, G., Pun- jani, D., Röbl, D., Stamoulis, G., Tsala...
2024
-
[37]
ucs.org/resources/satellite-database
Union of Concerned Scientists: UCS satellite database (May 2023),https://www. ucs.org/resources/satellite-database
2023
-
[38]
W3C: OWL 2 Web Ontology Language Document Overview (Second Edition) (Dec 2012), https://www.w3.org/TR/owl2-overview/
2012
-
[39]
W3C: RDF 1.2 Schema (Apr 2024),https://www.w3.org/TR/rdf12-schema/
2024
-
[40]
Big Data Research 22, 100159 (2020)
Wang, M., Wang, H., Qi, G., Zheng, Q.: Richpedia: A large-scale, comprehensive multi-modal knowledge graph. Big Data Research 22, 100159 (2020). https:// doi.org/https://doi.org/10.1016/j.bdr.2020.100159
2020
-
[41]
https://www.wikidata.org/wiki/Wikidata: Main_Page (2025)
Wikimedia Foundation: Wikidata. https://www.wikidata.org/wiki/Wikidata: Main_Page (2025)
2025
-
[42]
G., Groth, P., Goble, C., Grethe, J.S., Heringa, J., ’t Hoen, Peter A
Wilkinson, M.D., Dumontier, M., Aalbersberg, I.J., Appleton, G., Axton, M., Baak, A., Blomberg, N., Boiten, J.W., da Silva Santos, L.B., Bourne, P.E., Bouw- man, J., Brookes, A.J., Clark, T., Crosas, M., Dillo, I., Dumon, O., Edmunds, S., Evelo, C.T., Finkers, R., Gonzalez-Bel...
2016
-
[43]
WMO: Observing systems capability analysis and review tool (2023),https:// space.oscar.wmo.int/
2023
Reviewed August 6, 2026 · model on record in the stance chip above.
Discussion (0). Continue with ORCID to comment.