REVIEW 3 major objections 5 minor 5 references
Data-Driven Discovery of Mobility Periodicity for Understanding Urban Systems
T0 review · 3 major / 5 minor · reviewed 2026-08-06 · deepseek-v4-flash
Pith's one-line read An autoregressive coefficient at lag 168 quantifies and compares weekly mobility periodicity across stations, years, and travel modes.
desk verdict The COVID periodicity drop is likely a level-shift artifact; the method itself is worth engaging with but needs a robustness fix. read the letter →
The pith
A machine-rendered reading of the paper's core claim, the machinery that carries it, and where it could break.
The reading
What carries the argument
The central object is the optimization problem in Eq. (1): minimize the summed squared autoregressive error over all N locations and δ variables, subject to |Ω| ≤ τ sparsity on the lag set, non-negative coefficients, and Σ_{k∈Ω} w_{n,γ,k} = 1 per series. Because the full joint estimate is expensive, the paper first solves a global sparse autoregression to fix Ω, then fits each series' coefficients by quadratic programming; the coefficient at k = 168 (the weekly lag) is the periodicity measure.
What would settle it
Compute the weekly coefficient w_{·,168} and, for the same series, a frequency-domain periodicity measure such as the normalized power at the weekly frequency; if the two rankings of stations disagree on which are more periodic, the claimed comparability of the autoregressive coefficient fails. Also, refit with τ = 4 versus τ = 6 and check whether the ordering across modes changes materially.
Extended reading notes
Core claim
The central claim is that multidimensional sparse autoregression provides a valid, comparable metric of periodicity: for hourly mobility time series arranged as a tensor over spatial locations and variables, the coefficient w_{n,γ,168} in a non-negative, sum-to-one, sparsity-constrained autoregressive model measures the strength of weekly periodicity at location n for variable γ. The shared support set Ω is first estimated globally with mixed-integer optimization, then individual coefficients are fit by quadratic programming. On real data, the coefficient reproduces what scatter plots and weekly-overlap visuals show, tracks the COVID-19 disruption and post-pandemic recovery in ridesharing, and separates Manhattan travel modes by their regularity.
Load-bearing premise
One global set of time lags is assumed to describe every station and every travel mode, so the same coefficient at lag 168 can be compared across all of them.
Editorial extensions
If this is right
- Weekly periodicity strength becomes a comparable, interpretable number across stations, years, and modes, so regularity differences can be mapped spatially and tracked over time without re-fitting per series.
- COVID-19's disruption to mobility regularity is quantifiable: ridesharing periodicity in NYC and Chicago fell in 2020 and returned to pre-pandemic levels by 2022–2024, with NYC recovering faster.
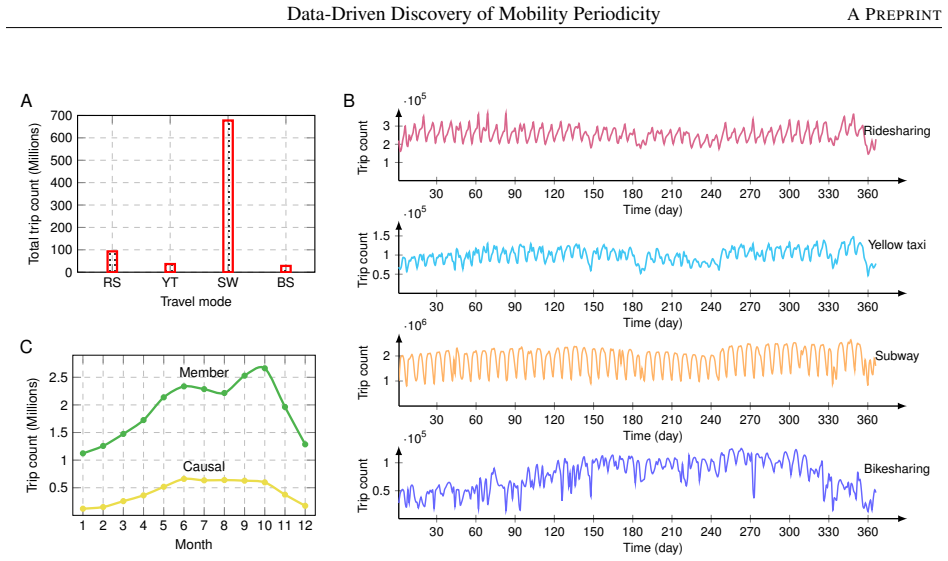
- Travel modes have distinct rhythms: in Manhattan 2024, subway trips are the most weekly-periodic, membership bikesharing more periodic than causal, and ridesharing and taxi the least periodic.
- The same framework yields daily periodicity on weekday data, and the support set itself reveals dominant lags (hourly, daily, six-day, weekly) that can guide differencing for non-stationarity.
Reading between the lines
- A testable extension: the same coefficient at other lags (e.g., k = 24) could serve as a comparable daily-periodicity metric, and the ratio w_{168}/(w_{24} + w_{168}) might separate weekly-anchored from daily-anchored mobility regimes.
- The global-support two-step is the load-bearing simplification; a direct comparison against per-series support estimation on a handful of stations would tell whether the shared-yardstick property holds or is an artifact of the shared Ω.
- Because the method is domain-agnostic, the identical coefficient could quantify periodicity in web traffic, energy demand, or epidemic case counts, with the weekly lag replaced by the relevant cycle length.
Editorial analysis
A structured set of objections, weighed in public.
Referee Report
Summary. The paper proposes a multidimensional sparse non-negative autoregression (Eq. 1) in which the coefficient at lag 168, estimated under sparsity and sum-to-one constraints, is used as a quantitative and comparable measure of weekly periodicity in human mobility time series. The framework is applied to Hangzhou metro passenger flows, NYC and Chicago ridesharing trip data from 2019 to 2024, and Manhattan multi-modal trip data for 2024. The main empirical claims are that the Hangzhou metro exhibits strong weekly periodicity across stations, that COVID-19 severely reduced weekly periodicity in both NYC and Chicago ridesharing in 2020 with recovery by 2022-2024, and that in Manhattan subway trips are the most periodic mode while bikesharing member trips are more periodic than casual trips. The paper also reports daily periodicity, bimonthly variations, and robustness checks at different sparsity levels.
Significance. If the proposed metric is valid, it offers a useful, interpretable, and comparable measure of periodicity across spatial locations, travel modes, and time periods, and the empirical results on pandemic disruption and recovery are of broad interest to urban and transportation research. Strengths include the use of publicly available datasets, an explicit optimization formulation, external validation through scatter plots and weekly overlap plots, and robustness checks for one hyperparameter in the appendix. However, the central COVID-19 finding is currently confounded by the non-stationarity of raw trip levels, and the estimation procedure in Appendix B is an unproven approximation of the joint optimization stated in Eq. (1); these issues must be addressed before the results can be taken as established.
major comments (3)
- [Section 4, Eq. (1)] The headline COVID-19 result is confounded by level non-stationarity. The model fits raw trip counts with no intercept, non-negative coefficients, and a sum-to-one constraint, so during an abrupt level drop such as the one in 2020, short lags like k=1,23,24 become highly predictive of the current level, and the optimized weight at k=168 can decline even if the within-week shape is unchanged. The Discussion (Section 6) mentions differencing only as a future remedy, after the periodicity values have already been computed on non-differenced data. To support the claim that 2020 was a genuine loss of regularity rather than a level-shift artifact, the authors should report a detrended or differenced version of the analysis, or a counterfactual experiment that imposes the 2020 level trajectory onto the 2019 weekly shape.
- [Appendix B] The estimation procedure is not the joint optimization of Eq. (1). Appendix B first estimates a global coefficient vector and support set across all N and δ, then fixes that support and fits per-series coefficients by quadratic programming. No argument or numerical bound shows that this two-step procedure is close to the joint optimum of Eq. (1). If the globally selected support excludes a lag that is dominant for a particular station or mode, the per-series coefficient at k=168 is not a comparable measure of that series' periodicity. The authors should either prove closeness, provide evidence from the exact mixed-integer solution on a subset of the data, or include a sensitivity analysis with per-series support selection.
- [Sections 4-5, Figs. 4 and 6, Table 2] Periodicity values are reported as point estimates without confidence intervals or significance tests. Claims such as the recovery trajectory in NYC and Chicago (Fig. 4A-B), the ordering of travel modes by weekly periodicity (Fig. 6C), and the bimonthly differences in Table 2 rest on differences that may be within estimation noise. The authors should provide bootstrap or subsampling intervals, at least for the yearly and mode-level averages.
minor comments (5)
- [Section 2, Fig. 1D] The text repeatedly refers to points aligning along the 'anti-diagonal' in scatter plots of x_t versus x_{t-k}; positive autocorrelation aligns points along the diagonal (the y=x line), not the anti-diagonal. This should be corrected throughout.
- [Appendix B] In the second optimization problem, the constraint 'w_k ≥ 0, ∀k ∉ Ω' is inconsistent with the immediately following constraint 'w_k = 0, ∀k ∉ Ω'; the non-negativity constraint should be restricted to k∈Ω.
- [Section 3] The sentence beginning 'The source emphasizes that time series with high weekly periodicity values...' appears to be a leftover from an earlier draft and should be rewritten in the authors' own voice.
- [Appendix D.1] The robustness claim about sparsity level is demonstrated only for NYC ridesharing data with τ=4 versus τ=6; the Hangzhou and Manhattan analyses use a single sparsity level, so the robustness of those particular results is not established.
- [Fig. 4E-F] The legend labels such as '2024 (94%)' and '2020 (55%)' are not defined in the caption; the text should state clearly that these percentages are recovery ratios relative to 2019 trip counts.
Circularity Check
No significant circularity: the periodicity metric is data-driven and the derivation chain is self-contained.
full rationale
The paper's derivation chain is self-contained. Section 2 defines a sparse non-negative autoregression with a sum-to-one constraint in Eq. (1), and the periodicity metric is the estimated coefficient at lag k=168. The coefficient is obtained by least-squares fitting on the observed time series, so its value is determined by the data rather than imposed by the model. The support set is optimized from the same objective, and while setting d=168 makes a weekly lag eligible for selection, it does not force any particular coefficient value; the reported support sets such as Omega={1,23,24,143,167,168} are data-driven outcomes. The validation in Fig. 3D compares the fitted metric to direct scatter plots of x_t versus x_{t-168}, which is a consistency check on the same data but not a circular reduction. The pandemic interpretation in Section 4 is a substantive statistical conclusion from estimated coefficients; the concern that raw-level fitting may confound level shifts with regularity changes is a validity threat or identifiability issue, not a definitional circularity. The only self-citations (Chen et al. 2025a, 2025b, 2025c) are motivational or forward-looking: the method is re-derived in Section 2 from standard autoregression and sparse-regression references, and the cited works do not supply a load-bearing uniqueness theorem or a fitted parameter relabeled as a prediction. No equation in the paper is equivalent to its own input by construction, and no fitted parameter is called a prediction. Therefore no significant circularity is found.
Assumptions & free parameters
free parameters (3)
- sparsity level tau =
4 or 6 depending on experiment
- autoregressive order d =
168 (hourly), 336 (30-minute), 24 (weekday daily)
- sum-to-one normalization of coefficients =
1
assumptions (6)
- domain assumption Mobility time series are well approximated by a linear autoregression with a small number of lags.
- domain assumption A single shared support set Omega across all locations and variables is adequate.
- ad hoc to paper The two-step estimation (global support then individual coefficients) is a close proxy for the joint optimum of Eq. (1).
- domain assumption Non-negative coefficients and sum-to-one normalization are appropriate for interpreting periodicity strength.
- domain assumption The pre-specified order d=168 (or 336) is sufficient to capture periodicity and does not truncate important longer lags.
- domain assumption Missing data (e.g., January 2019 ridesharing) and spatial projections of station data do not bias periodicity comparisons.
Cite this review
Pith. "Pith review of Data-Driven Discovery of Mobility Periodicity for Understanding Urban Systems." pith.science (2026). https://pith.science/paper/54TZ2OTL
@misc{pith2026250803747,
  author       = {Pith},
  title        = {Pith review of: Data-Driven Discovery of Mobility Periodicity for Understanding Urban Systems},
  year         = {2026},
  howpublished = {\url{https://pith.science/paper/54TZ2OTL}},
  note         = {Machine review of arXiv:2508.03747}
}
read the original abstract
Human mobility regularity is crucial for understanding urban dynamics and informing decision-making processes. This study first quantifies the periodicity in complex human mobility data as a sparse identification of dominant positive auto-correlations in time series autoregression and then discovers periodic patterns. We apply the framework to large-scale metro passenger flow data in Hangzhou, China and multi-modal mobility data in New York City and Chicago, USA, revealing the interpretable weekly periodicity across different spatial locations over past several years. The analysis of ridesharing data from 2019 to 2024 demonstrates the disruptive impact of the pandemic on mobility regularity and the subsequent recovery trends. In 2024, the periodic mobility patterns of ridesharing, taxi, subway, and bikesharing in Manhattan uncover the regularity and variability of these travel modes. Our findings highlight the potential of interpretable machine learning to discover spatiotemporal mobility patterns and offer a valuable tool for understanding urban systems.
Figures


Figures from the paper (6 more)



Reference graph
Works this paper leans on
-
[4]
• The support set with sparsity levelτ= 4isΩ ={1,23,167,168}
D.2 Weekly periodicity of ridesharing dropoff trips with different sparsity levels In terms of dropoff trips, we set the sparsity levels of the proposed model asτ= 4,6as follows. • The support set with sparsity levelτ= 4isΩ ={1,23,167,168}. • The support set with sparsity levelτ= 6isΩ ={1,23,24,143,167,168}. As shown in Fig. 9, the dropoff trips of NYC ri...
work page 2020
-
[2016]
Xinyu Chen, Vassilis Digalakis Jr, Lijun Ding, Dingyi Zhuang, and Jinhua Zhao. Interpretable time series autoregression for periodicity quantification.arXiv preprint arXiv:2506.22895, 2025a. Hugo Barbosa, Marc Barthelemy, Gourab Ghoshal, Charlotte R James, Maxime Lenormand, Thomas Louail, Ronaldo Menezes, José J Ramasco, Filippo Simini, and Marcello Tomas...
-
[2018]
Alejandro Tirachini. Ride-hailing, travel behaviour and sustainable mobility: an international review.Transportation, 47(4):2011–2047,
work page 2011
-
[2022]
Periodicity in Movement Patterns Shapes Epidemic Risk in Urban Environments
Zhanwei Du, Spencer J Fox, Petter Holme, Jiming Liu, Alison P Galvani, and Lauren Ancel Meyers. Periodicity in movement patterns shapes epidemic risk in urban environments.arXiv preprint arXiv:1809.05203,
-
[2025]
Xinyu Chen, HanQin Cai, Fuqiang Liu, and Jinhua Zhao. Correlating time series with interpretable convolutional kernels.IEEE Transactions on Knowledge and Data Engineering, 37(6):3272–3283, 2025b. Xinyu Chen, Chengyuan Zhang, Xi-Le Zhao, Nicolas Saunier, and Lijun Sun. Forecasting sparse movement speed of urban road networks with nonstationary temporal mat...
work page 2020
Reviewed August 6, 2026 · model on record in the stance chip above.
Discussion (0). Continue with ORCID to comment.