REVIEW 5 major objections 5 minor 15 references
Event-Aware Sentiment Factors from LLM-Augmented Financial Tweets: A Transparent Framework for Interpretable Quant Trading
T0 review · 5 major / 5 minor · reviewed 2026-08-05 · deepseek-v4-flash
Pith's one-line read LLM-assigned event labels on tweets, such as 'speculation/rumor' and 'retail investor buzz', produce statistically significant contrarian return signals with negative Sharpe ratios across one-to-seven-day horizons.
desk verdict The LLM event-labeling idea is a fine extension of SESTM, but the results are untrustworthy: the sentiment model is fit to forward returns and then backtested on the same data, and the p-values don't add up. read the letter →
The pith
A machine-rendered reading of the paper's core claim, the machinery that carries it, and where it could break.
The reading
What carries the argument
The central object is the event-conditioned factor exposure $F_{i,t,e} = \sum_{j\in S_{i,t,e}} \mathrm{tone}_j$: the sum of a tweet's net-tone score over all tweets about stock $i$ tagged with event label $e$ on day $t$. Net tone comes from a stacked LDA topic model followed by logistic regression trained to predict forward returns, a la SESTM; the novelty is that an LLM supplies the multi-label event tags, so each factor is interpretable ("rumor," "boycott"). The factor is what maps raw text into a tradable cross-sectional signal.
What would settle it
Run the same event-factor pipeline with the sentiment model trained only on 2017 data and evaluated on tweets from 2018 onward; if the negative Sharpe ratios and |IC|>0.05 vanish out of sample, the claim of predictive alpha collapses. A simpler check: permute the event labels while holding tone and returns fixed; if shuffled labels reproduce the Sharpe ratios, the effect is not tied to event semantics.
Extended reading notes
Core claim
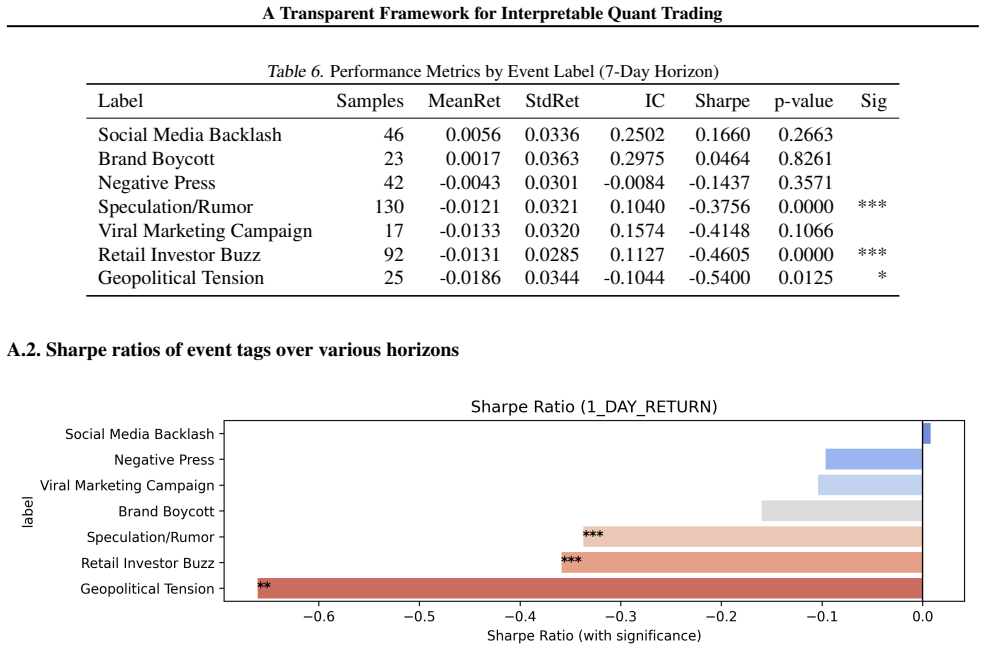
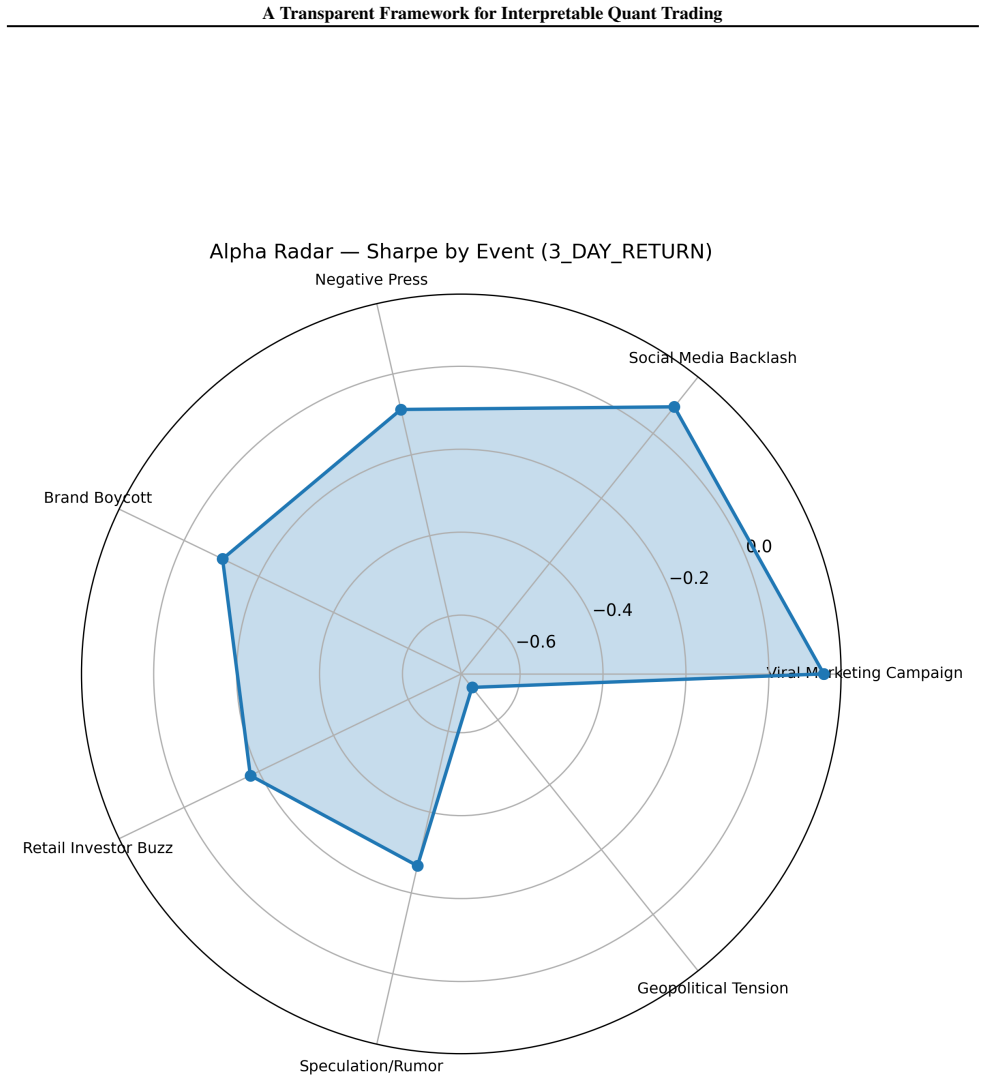
For a cleaned set of 85,176 ticker-linked tweets, the paper assigns each tweet a net-tone sentiment score and, via zero-shot LLM prompting against a dictionary of 70+ event types, one or more event labels. It then forms daily long-short portfolios: stocks in the top decile of factor exposure $F_{i,t,e}$ (sum of net tone of tweets tagged with event $e$ for stock $i$ on day $t$) go long, the bottom decile go short. The finding is that several event labels act as contrarian indicators: portfolios with high exposure to Speculation/Rumor, Retail Investor Buzz, and Geopolitical Tension earn negative forward returns at 1-, 2-, 3-, and 7-day horizons, with Sharpe ratios as low as -0.38 and informati
Load-bearing premise
The net-tone scores are generated by a model trained to predict forward returns, and the paper does not document a strict out-of-sample split; if that model only memorized its training period, the negative Sharpe ratios would be fitting artifacts rather than tradable alpha.
Editorial extensions
If this is right
- Rumor/speculation and geopolitical-tension factors can be used as short signals or as overlays that reduce exposure when these narratives spike.
- Because the paper reports orthogonality to market beta, the event factors can be combined with market-neutral portfolios without adding measured systematic risk.
- The 7-day sign flip for retail investor buzz implies a horizon-dependent rule: the same label supports a near-term short and a later reversal.
- The framework converts tweet text into a structured panel of multi-label factor exposures, allowing narrative-level backtests rather than polarity-only strategies.
Reading between the lines
- If the effect is real, high exposure to rumor/speculation is plausibly a proxy for attention-driven overpricing, not information; a testable extension would scale the factor by tweet volume to see whether negative returns concentrate in high-volume days.
- The paper does not test label disagreement across LLMs; since zero-shot labels are the key input, measuring label agreement between two LLMs or against human annotation would show how much of the signal depends on the particular model.
- The sign flip of the retail-buzz factor at the 7-day horizon suggests a reversal strategy that the paper does not backtest: short stocks with heavy retail-buzz tweets in the first days, then close or reverse in week two.
Editorial analysis
A structured set of objections, weighed in public.
Referee Report
Summary. The paper proposes an LLM-based multi-label event tagging pipeline for financial tweets, constructs cross-sectional factors from the product of event tags and a 'net tone' sentiment score, and evaluates long-short portfolios across 1-7 day horizons. The authors report that several event labels (Speculation/Rumor, Retail Investor Buzz, Geopolitical Tension) yield statistically significant negative Sharpe ratios and ICs, interpreting these as contrarian alpha signals. The paper also presents a lexicon-based sentiment strategy with an annualized return of 8% and Sharpe of 5.0. The stated contributions are a novel LLM-based factor framework, discovery of interpretable alpha signals, orthogonality to market beta, and open-source reproducibility.
Significance. If the empirical claims were valid, the framework would offer a useful way to move beyond aggregate sentiment polarity toward interpretable, event-conditioned trading signals. The transparency and modularity of the pipeline are commendable in principle, and the use of a public dataset is a strength. However, the central finding—that LLM-assigned event labels have predictive power—is not established by the current evidence because the evaluation is potentially circular, the reported statistics are internally inconsistent or ambiguous, and key methodological details are missing. The paper is better viewed as a preliminary framework description than a validated empirical discovery.
major comments (5)
- [§3.2, §3.3, §4] The evaluation is circular as presented. The net-tone score tone_j used in Eq. (1) is produced by an LDA + logistic regression model that, per §3.2, is 'trained to predict forward returns.' Tables 3–6 then test factors built from these tone scores against forward returns in what appears to be the same 2017 sample (§4.1: 'dictionary trained on 2017 data'). No out-of-sample split, walk-forward scheme, or validation period is documented. Under these conditions, negative Sharpe ratios and ICs are expected even for irrelevant event labels because the tone component was itself fitted to forecast those returns. The paper must demonstrate that the tone model is estimated strictly out-of-sample or on a separate training period before any predictive claim can be supported.
- [Abstract, Tables 3–6] The p-values are statistically inconsistent with the reported IC values if they are intended to test the IC. For example, Table 3 reports N=92, IC=0.0955, p=0.0009; a Spearman correlation t-test gives p≈0.36. The p-values match t-tests for the Sharpe ratio instead (e.g., N=92, Sharpe=-0.359 gives two-sided p≈0.001). The abstract's claim that 'information coefficients exceeding 0.05, all statistically significant' is unsupported: Table 3 lists Social Media Backlash with IC=0.3672, p=0.9564, and Brand Boycott with IC=0.6123, p=0.4515. The paper must clarify which statistic each p-value refers to and correct the abstract and any statements about IC significance.
- [§3.2 vs. §3.3] There is a direct contradiction in how multi-label tweets are handled. §3.2 states 'Tweets with multiple tags have their net tone duplicated across tags,' while §3.3 says 'If a tweet has multiple labels, its tone is proportionally assigned to each.' This changes the value of Fi,t,e in Eq. (1) materially for overlapping event types. The authors must specify the exact aggregation rule and justify it.
- [Tables 3–6, §4.2] The results are selectively reported. Only 7 of the 70+ event types defined in §3.2 appear in any table, and no selection rule is stated. If the rows were chosen on the basis of significance or Sharpe magnitude, the p-values are invalid without a multiple-testing correction, and the reported 'top predictive event labels' may be extreme draws from a large set. A complete table of all event labels, or a pre-registered selection rule, is needed.
- [§4.1] The economic claim is not credible without frictions. The lexicon strategy reports an annualized return of 8%, a Sharpe ratio of 5.0, and a maximum drawdown of -15.2% using daily rebalancing in a top/bottom decile long-short portfolio. No transaction costs, shorting costs, borrow constraints, or capacity analysis are considered. At daily rebalancing, costs of a few basis points per trade would likely eliminate such a Sharpe ratio. The paper must include a net-of-cost analysis and turnover statistics to support the tradability claim.
minor comments (5)
- [§1] The text contains the placeholder 'Section ?? discusses the implications and limitations' which should be fixed.
- [Appendix A] The appendix states 'The LLM we use in all our experiments is Gemini-2.5-pro' but gives no prompt template, temperature, number of runs, or consistency checks for the LLM labels. These details are essential for reproducibility.
- [§3.4 Remark] The paper promises a comparison of event-tagged factors against 'baseline polarity-only signals' but Section 4 does not provide a head-to-head comparison; Section 4.1 describes a different lexicon-based strategy rather than the polarity-only baseline from the same pipeline.
- [§3.1] The filtering from 862,231 tweets to 85,176 is described only as 'for higher signal-to-noise ratio.' The inclusion criteria should be explicit, otherwise the sample selection could drive the results.
- [References] Several references are informal (e.g., Coibion et al. is a VoxEU column; Orekhov is a blog). The authors should cite peer-reviewed sources for methodological claims where available.
Circularity Check
Event-factor backtest is partially circular: net-tone is fit to forward returns and no out-of-sample split is documented
-
fitted input called prediction
[Sect. 3.2 (Sentiment Polarity), Sect. 3.3 Eq. (1), Sect. 3.4 and 4.1; Table 1]
"Sentiment Polarity (Net Tone). Each tweet is assigned a continuous sentiment score... We adopt the approach of Sowinska et al., where a stacked LDA topic model followed by logistic regression is trained to predict forward returns, thereby generating polarity scores aligned with market response. ... For each label e and each stock i on day t, the factor exposure Fi,t,e is defined as: Fi,t,e = sum_{j in S_{i,t,e}} tone_j ... The portfolio was rebalanced daily based on sentiment scores derived from a dictionary trained on 2017 data."
Eq. (1) defines every factor exposure as a sum of net-tone scores. Those scores, per Sect. 3.2, come from a supervised LDA+logistic-regression model 'trained to predict forward returns.' The evaluation then correlates and ranks the resulting factors against forward returns (Sect. 3.4/4.1), using a dictionary 'trained on 2017 data' with no documented out-of-sample split or walk-forward scheme. Thus the nonzero IC and negative Sharpe ratios are expected even for uninformative LLM event labels, because the tone component was itself optimized against the evaluation target. The paper's central claim that 'certain event categories ... consistently yield negative alpha' therefore cannot be separated from the in-sample fit of the sentiment model; the event labels alone are never tested independent
full rationale
The central alpha claim is only partially circular: the zero-shot LLM event labels are not fitted to returns, so they are an independent input. However, the factor exposures that carry those labels are weighted sums of a net-tone score that was itself trained to predict forward returns, and the paper reports no out-of-sample split. Table 1 and Sect. 4.1 place both the corpus and the trained dictionary in 2017, so the reported ICs, Sharpe ratios, and p-values are, on the face of the text, in-sample fits of the sentiment model. A non-informative event label would still produce statistically significant factor performance if the fitted tone correlates with the same returns used for evaluation. This is a partial reduction of the 'prediction' to the training target, not a full equivalence, so I assign 6 rather than 8. No self-citation chain is involved; the cited sentiment model comes from Sowinska et al., not from the present authors. Additionally, per the reviewing rule, the manuscript itself promises a limitations discussion at 'Section ??' (Sect. 1) that does not exist in the provided text, so there is no self-reported caveat acknowledging the in-sample fitting issue.
Assumptions & free parameters
free parameters (5)
- LDA/logistic regression sentiment model weights =
unspecified
- Event label dictionary (70+ types) =
hand-curated
- Tweet inclusion criteria (85,176 of 862,231) =
unspecified
- Holding periods and quantile thresholds =
1,2,3,7 days; decile/quintile
- LLM prompt and sampling parameters =
unspecified (Gemini-2.5-pro)
assumptions (5)
- domain assumption LLM event annotations are accurate and unbiased zero-shot classifications
- domain assumption Daily rebalancing at closing prices is tradable without costs or slippage
- domain assumption Tweet timestamps align with forward returns without lookahead
- standard math Standard Spearman IC p-values are valid
- domain assumption Sowinska dataset is suitable and randomly split
Cite this review
Pith. "Pith review of Event-Aware Sentiment Factors from LLM-Augmented Financial Tweets: A Transparent Framework for Interpretable Quant Trading." pith.science (2026). https://pith.science/paper/2NZE3HYZ
@misc{pith2026250807408,
  author       = {Pith},
  title        = {Pith review of: Event-Aware Sentiment Factors from LLM-Augmented Financial Tweets: A Transparent Framework for Interpretable Quant Trading},
  year         = {2026},
  howpublished = {\url{https://pith.science/paper/2NZE3HYZ}},
  note         = {Machine review of arXiv:2508.07408}
}
read the original abstract
In this study, we wish to showcase the unique utility of large language models (LLMs) in financial semantic annotation and alpha signal discovery. Leveraging a corpus of company-related tweets, we use an LLM to automatically assign multi-label event categories to high-sentiment-intensity tweets. We align these labeled sentiment signals with forward returns over 1-to-7-day horizons to evaluate their statistical efficacy and market tradability. Our experiments reveal that certain event labels consistently yield negative alpha, with Sharpe ratios as low as -0.38 and information coefficients exceeding 0.05, all statistically significant at the 95\% confidence level. This study establishes the feasibility of transforming unstructured social media text into structured, multi-label event variables. A key contribution of this work is its commitment to transparency and reproducibility; all code and methodologies are made publicly available. Our results provide compelling evidence that social media sentiment is a valuable, albeit noisy, signal in financial forecasting and underscore the potential of open-source frameworks to democratize algorithmic trading research.
Figures


Figures from the paper (9 more)




Reference graph
Works this paper leans on
-
[1]
Antweiler, W. and Frank, M. Z. Is all that talk just noise? the information content of internet stock message boards. The Journal of Finance, 59 0 (3): 0 1259--1294, 2004. doi:10.1111/j.1540-6261.2004.00662.x
arXiv 2004
-
[2]
Twitter mood predicts the stock market
Bollen, J., Mao, H., and Zeng, X.-J. Twitter mood predicts the stock market. Journal of Computational Science, 2 0 (1): 0 1--8, 2011. doi:10.1016/j.jocs.2010.12.007
-
[3]
Twitter sentiment and stock returns
Coibion, O., Gorodnichenko, Y., and Weber, M. Twitter sentiment and stock returns. CEPR VoxEU, 10 2020
work page 2020
-
[4]
Deodhar, H. and Rao, M. Stock market prediction using twitter sentiment analysis. International Journal of Engineering Research & Technology (IJERT), 10 0 (08), 8 2021
work page 2021
-
[5]
Greyling, T. and Rossouw, S. The impact of online sentiment on stock market movements. Applied Economics, 54 0 (44): 0 5110--5124, 2022. doi:10.1080/00036846.2022.2045231
-
[6]
Gu, G. and Kurov, A. What's in a tweet? the information content of stock microblogs. Financial Management, 49 0 (4): 0 925--955, 2020. doi:10.1111/fima.12282
-
[7]
Ke, Z. T., Kelly, B. T., and Xiu, D. Predicting returns with text data. Technical report, National Bureau of Economic Research, 2019
work page 2019
-
[8]
How to maximize sharpe ratio in trading strategies
Orekhov, A. How to maximize sharpe ratio in trading strategies. LuxAlgo Blog, 9 2023
work page 2023
Show all 15 references
-
[9]
The effects of social media on stock market behaviour
Ranco, G., Aleksovski, D., Caldarelli, G., Gr c ar, M., and Mozeti c , I. The effects of social media on stock market behaviour. Journal of Computational Science, 11: 0 95--102, 2015. doi:10.1016/j.jocs.2015.07.009
2015 doi
-
[10]
and Madhyastha, P
Sowinska, K. and Madhyastha, P. A tweet-based dataset for company-level stock return prediction. arXiv preprint arXiv:2006.09723, 2020
2006 arXiv
-
[11]
O., Tumasjan, A., Sandner, P
Sprenger, T. O., Tumasjan, A., Sandner, P. G., and Welpe, I. M. The effects of twitter sentiment on stock price returns. In Procedia - Social and Behavioral Sciences, volume 149, pp.\ 946--954, 2014. doi:10.1016/j.sbspro.2014.08.314
2014 doi
-
[12]
and Tas, O
Tan, S. and Tas, O. The impact of twitter sentiment on stock returns. International Journal of Finance & Economics, 26 0 (3): 0 3828--3841, 2021. doi:10.1002/ijfe.1993
2021 doi
-
[13]
What is alternative data? https://www.investopedia.com/what-is-alternative-data-6889002, 5 2024
Velasquez, V. What is alternative data? https://www.investopedia.com/what-is-alternative-data-6889002, 5 2024. Accessed: 2025-06-07
2024
-
[14]
Z., Cambria, E., and Zhang, Y
Xing, F. Z., Cambria, E., and Zhang, Y. Pre-trained large language models for financial sentiment analysis. arXiv preprint arXiv:2401.05215, 1 2024. URL https://arxiv.org/abs/2401.05215
2024 arXiv
-
[15]
write newline
" write newline "" before.all 'output.state := FUNCTION n.dashify 't := "" t empty not t #1 #1 substring "-" = t #1 #2 substring "--" = not "--" * t #2 global.max substring 't := t #1 #1 substring "-" = "-" * t #2 global.max substring 't := while if t #1 #1 substring * t #2 gl...
Reviewed August 5, 2026 · model on record in the stance chip above.
Discussion (0). Continue with ORCID to comment.