REVIEW 3 major objections 5 minor 1 cited by
Anomaly Detection for IoT Global Connectivity
T0 review · 3 major / 5 minor · reviewed 2026-08-05 · deepseek-v4-flash
Pith's one-line read This paper claims that an unsupervised pipeline built on expert-engineered features and per-context Isolation Forest models can detect IoT client-level roaming incidents—4 of 5 known clients at best, none falsely on a control—that the opera
desk verdict Useful deployment case study, but the headline 4-of-5 result is compromised by an unstated training/validation time overlap and a shaky significance test. read the letter →
The pith
A machine-rendered reading of the paper's core claim, the machinery that carries it, and where it could break.
The reading
What carries the argument
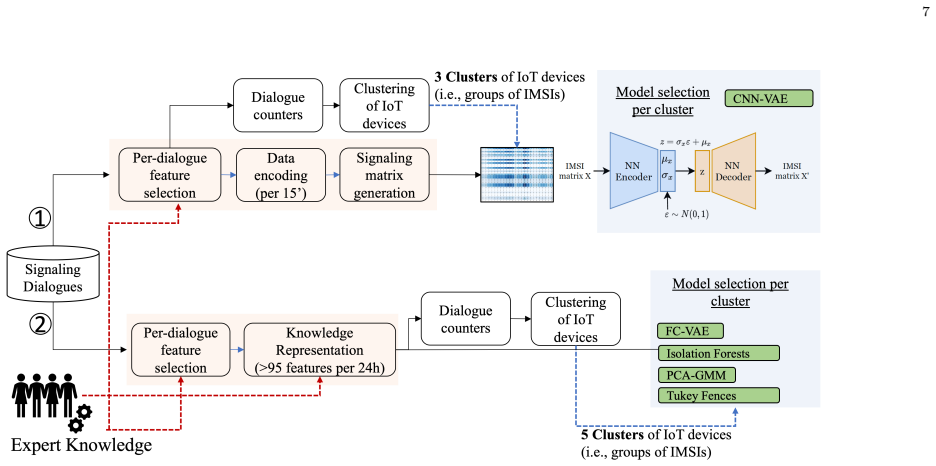
The load-bearing mechanism is a two-step 'context, then anomaly' pipeline. A Gaussian Mixture Model clusters devices into behavioral contexts (stationary 2G/3G low volume, stationary 4G medium volume, mildly mobile 2G/3G high volume, highly mobile mixed, and patchy-connectivity devices) from one month of daily signaling statistics; a separate Isolation Forest is then trained per cluster on 95 expert-engineered features. The step that turns device scores into client alarms is the z-score $Z_i = (D-E)/\sqrt{E \cdot C_i}$, which compares the observed anomalous-device count $D$ with the count $E$ expected if anomalies were uniformly distributed across clients, judged at the 99% confidence level.
What would settle it
Run ANCHOR's Isolation Forest branch on another month with known incidents, or on the October ground truth with a null that weights anomaly probability by fleet size or signaling volume. If detection drops below 4 of 5 known clients at the 99% threshold, or the control client becomes flagged, the uniform-null assumption—not the detector—is carrying the reported result.
Extended reading notes
Core claim
ANCHOR's discovery is that client-level connectivity incidents in a global IoT roaming service leave a detectable trace in the control plane even when they are invisible to existing threshold alarms. By reconstructing MAP and Diameter signaling dialogues at the roaming hub and compiling 95 per-device features—traffic volume, message types, activity, mobility, and longitudinal statistics—the pipeline groups devices into behavioral contexts with GMM clustering (e.g., stationary 4G devices, highly mobile mixed devices) and then applies a separate Isolation Forest per cluster. At inference, the per-cluster model's anomaly scores are converted into client-level alarms through a z-score test again
Load-bearing premise
The load-bearing premise is that anomalies are uniformly distributed across clients, so a z-score against that uniform null is a valid significance test; the paper's ground truth covers only five anomalous clients and one control, and if larger or more active fleets are inherently more prone to issues, the headline 4-of-5 detection could be an artifact of that null model.
Editorial extensions
If this is right
- IoT connectivity providers can run ANCHOR daily on signaling data and catch incidents before clients file tickets, since the system already detects what threshold-based alarms miss.
- Clustering by device context is a prerequisite for usable detection; per-cluster models detect 4 of 5 clients, while a single global model detects 1 of 5 and can raise false alarms.
- Explainable models built on engineered features are viable at operational scale, with isolation forest training times of 50–400 minutes versus up to two days for VAEs, making daily retraining practical.
- The same MAP and Diameter signaling is used by any roaming-hub-based IoT provider, so the ANCHOR method can be transplanted to other providers.
- Aggressive-signaling devices that endanger roaming agreements can be singled out as a flag and handled before the agreement is threatened.
Reading between the lines
- Beyond the paper's claims: if the uniform null were replaced by a fleet-size-weighted null, I would expect the large-fleet detections to survive but the small-fleet cases (Client #4, tens of devices) to become marginal or fall below the 99% threshold.
- Neighboring problem: clustering alarms by country and time could turn ANCHOR from a client-level flag into a roaming-partner health probe, since a country where many unrelated clients' devices go anomalous simultaneously points to the visited network or roaming hub rather than any single client.
- Testable extension: once more ticket labels accumulate, the cluster assignments and anomaly scores could seed a semi-supervised model trained on historical anomaly rates per client, potentially recovering recall on small-fleet incidents without losing explainability.
- Operational extension the paper leaves implicit: feeding rejected-dialogue and Cancel Location features into a per-roaming-partner baseline would let ANCHOR distinguish configuration faults (e.g., a misconfigured roaming agreement) from device-side storms.
Editorial analysis
A structured set of objections, weighed in public.
Referee Report
Summary. The paper presents ANCHOR, an unsupervised anomaly-detection pipeline for IoT connectivity in global roaming. The system collects signaling data from a roaming hub, transforms it either into raw signaling matrices (branch 1, CNN-VAE) or into engineered features based on expert knowledge (branch 2, with clustering followed by isolation forest, GMM, or FC-VAE), and flags IoT clients whose device fleets behave abnormally. The authors validate on ground-truth incidents from the IoT provider's ticketing system, involving five anomalous clients and one control client during October 2022. They report that isolation forest detects anomalies in four of five clients at best and two of five at worst, with no false positives on the control client, and describe a live trial in February 2023. The paper's central empirical claim is currently compromised by a training/evaluation temporal overlap and by a fragile statistical-significance framework.
Significance. If the evaluation were clean, this would be a valuable industry-scale study: it uses a unique 10-billion-dialogue signaling dataset from a production roaming hub, compares two data-representation strategies, and reports a live deployment with operational validation. The paper gives useful evidence that expert-engineered features plus isolation forest can surface client-level connectivity incidents that escape threshold-based alarms, and it makes the feature list publicly available. However, the reported recall numbers and the '4 out of 5 clients' headline are not currently interpretable because the model may have been trained on the very October days used for validation, and because the significance test used to color Table II is statistically ill-founded. The design experience and dataset remain valuable, but the central claim needs a clean re-analysis.
major comments (3)
- [Section V, 'Statistical significance'] Training and evaluation overlap. The manuscript states 'We collect our training dataset during September-October 2022' (Section II-D) and that 'we executed a proof-of-concept for ANCHOR in October 2022' (Section V), with validation dates in Table II spanning 5-28 October 2022. If any part of the October data that appears in the validation days was used for feature statistics, clustering, or model fitting, the anomaly-detection model has already seen the anomalies it is asked to detect, and the recall values in Table II reflect memorization rather than generalization. The paper never states that a strict temporal split (e.g., train on data through 30 September only, validate on October) was enforced. The February 2023 live test uses a model trained in September 2022, which is reassuring, but that test does not reproduce the 4/5/no-FP headline. This is the most load-bearing weakness: the e
- [Section V] The z-score test is not statistically valid. The formula Z_i = (D - E) / sqrt(E * C_i) uses a quantity called 'confidence interval' in the denominator rather than a standard error; as written, it is dimensionally and conceptually undefined. The null model assumes anomalies are uniformly distributed across clients, which is not justified given only five anomalous clients and one control, and it ignores fleet size and client heterogeneity. There is also no multiple-testing correction across the many model variants, dates, and clients in Table II. Since the colored cells and the '4 out of 5 clients' claim are selected against this 99% threshold, the results could be an artifact of the null model. The authors should use a proper per-client null (e.g., a binomial or permutation test based on each client's fleet size), a correct variance expression, and a multiple-comparison control.
- [Section IV-B] The headline recall range is parameter-dependent and no sensitivity analysis is reported. The contamination parameter of isolation forest is set to 5% based on operator experience, and the significance test itself treats the number of potential anomalies as a tunable parameter. The claimed '4 out of 5 clients at best, 2 out of 5 at worst' is therefore conditional on a fixed contamination value and a fixed z-score threshold. Because the number of flagged devices is essentially set by the contamination parameter, the authors should at least report how the client-level detection and false-positive outcomes vary with contamination (e.g., 1-10%) and with the alarm threshold, or justify why the chosen values are uniquely appropriate.
minor comments (5)
- [Section V, 'Isolation Forest (IF) results'] The text states that 'Isolation Forest successfully triggers alarms for over 60% of devices for Client#2 and 30% for Client#5,' but Table II shows no isolation-forest configuration reaching 60% for Client#2 and no value above 34.15% for Client#5; the 66% and 71% entries belong to GMM per cluster. Please correct the text/table mismatch.
- [Table I] Client#1 is listed with date '5-6.10.2024'; the rest of the paper and the ground truth discussion indicate October 2022. Please fix the year.
- [Section II-A] 'Point of Presences' should be 'Points of Presence' (PoPs).
- [Section IV-B] The paper says 'for each feature, we analyze the timeseries of daily records over a one-month period,' but the training data span September-October 2022. Please specify which month is used for feature statistics and how this relates to the validation window.
- [Section V] The z-score example with expected count 50 and detected count 80 yielding z=±4.24 implies C_i=1 in the denominator, but this is never stated. Please clarify the meaning of C_i and avoid using 'confidence interval' as a variance term.
Circularity Check
Training and evaluation windows overlap, and the 5% contamination parameter drives the z-score counts; the 4-of-5 detection claim is in-sample by construction.
-
fitted input called prediction
[Section II-D ('Dataset') and Section V ('Evaluation Results', Table II)]
"We collect our training dataset during September-October 2022. ... Specifically, we executed a proof-of-concept for ANCHOR in October 2022, which we discuss next. [Table II:] percentage of anomalous devices classified as anomalous and present in tickets (i.e., recall), reported per IoT vertical client and day of validation in October."
The evaluation window (all Table II dates are in October 2022) is a subset of the stated training interval (September-October 2022). The Isolation Forest and clustering models are fit on this same interval, so 'anomalies detected' on 5/10, 6/10, 20/10, etc. are in-sample outliers of the training distribution, not out-of-sample predictions. The paper never states a strict temporal split (e.g., train on September only, test on October); the February 2023 live test uses a model 'trained in September 2022' but does not reproduce the 4/5 recall claim. High recall therefore reflects the model having seen the test days, not generalization.
-
fitted input called prediction
[Section IV-B ('Anomaly Detection Models') and Section V ('Statistical significance')]
"In ANCHOR, we set this value to 0.05 (i.e., 5%). This is of course a tunnable parameter: we set it up to 5%, based on the operators’ experience. ... Since the number of potential anomalies is a tunable parameter (e.g., the contamination factor in Isolation Forest), we compare whether the number of detected anomalies is statistically significantly larger than those from a uniform distribution. ... Zi = D−E√E×Ci"
The number D of 'detected' devices that enters the z-score is not an independent observation: for Isolation Forest it is the top 5% of the cluster by construction. E is derived from a uniform distribution over clients. The z-score therefore compares a parameter-chosen count (D ≈ 0.05 × cluster size) against a uniform expected count; a client with a large fleet in a cluster will cross the 99% threshold regardless of whether the flagged devices match any real incident. The '4 out of 5 clients' headline is thus largely a property of the chosen contamination fraction and client fleet sizes, not of ground-truth anomalies. The paper itself admits the count is 'a tunable parameter.'
full rationale
The paper's branch-2 feature engineering and the clustering context are self-contained and not circular; the model comparison is a legitimate empirical exercise. The circularity is concentrated in the evaluation protocol. First, the stated training dataset spans September-October 2022, while the proof-of-concept and all Table II validation dates are in October 2022, so the central 4-of-5 recall claim is evaluated on the same period used for training unless an unstated split was enforced. Second, the z-score significance test uses D, which for Isolation Forest is the 5% contamination output, and compares it to E from a uniform client distribution; this makes the 'statistically significant' flags largely an artifact of the tuned contamination fraction and client fleet size rather than an independent confirmation of the ground-truth incidents. The self-citation to [20] in Section VI-C is not load-bearing for the main detection result; it supports a speculative generalization claim only. If the authors had documented a clean September-only training split and a proper null model that accounts for fleet size, the circularity score would be much lower. As written, the headline result reduces to in-sample fitting and a tunable-count significance test, so a score of 6 is appropriate.
Assumptions & free parameters
free parameters (6)
- Isolation Forest contamination =
0.05
- VAE beta weight =
1
- Number of clusters (branch 1) =
3
- Number of clusters (branch 2) =
5
- z-score alarm threshold =
2.576 (99% CI)
- Signaling matrix time interval =
15 minutes
assumptions (5)
- domain assumption IoT connectivity anomalies manifest as observable deviations in roaming signaling traffic (MAP/Diameter procedures).
- domain assumption Customer tickets in the ticketing system are a valid ground truth for real anomalies.
- ad hoc to paper Expected anomalous devices E follow a uniform distribution across clients under the null hypothesis.
- ad hoc to paper Training on September-October 2022 data still yields a valid baseline for evaluating October 2022 days.
- domain assumption GMM clustering (with BIC) produces device contexts that make per-cluster anomaly models valid.
Cite this review
Pith. "Pith review of Anomaly Detection for IoT Global Connectivity." pith.science (2026). https://pith.science/paper/WQNMQQ5B
@misc{pith2026250809660,
  author       = {Pith},
  title        = {Pith review of: Anomaly Detection for IoT Global Connectivity},
  year         = {2026},
  howpublished = {\url{https://pith.science/paper/WQNMQQ5B}},
  note         = {Machine review of arXiv:2508.09660}
}
read the original abstract
Internet of Things (IoT) application providers rely on Mobile Network Operators (MNOs) and roaming infrastructures to deliver their services globally. In this complex ecosystem, where the end-to-end communication path traverses multiple entities, it has become increasingly challenging to guarantee communication availability and reliability. Further, most platform operators use a reactive approach to communication issues, responding to user complaints only after incidents have become severe, compromising service quality. This paper presents our experience in the design and deployment of ANCHOR -- an unsupervised anomaly detection solution for the IoT connectivity service of a large global roaming platform. ANCHOR assists engineers by filtering vast amounts of data to identify potential problematic clients (i.e., those with connectivity issues affecting several of their IoT devices), enabling proactive issue resolution before the service is critically impacted. We first describe the IoT service, infrastructure, and network visibility of the IoT connectivity provider we operate. Second, we describe the main challenges and operational requirements for designing an unsupervised anomaly detection solution on this platform. Following these guidelines, we propose different statistical rules, and machine- and deep-learning models for IoT verticals anomaly detection based on passive signaling traffic. We describe the steps we followed working with the operational teams on the design and evaluation of our solution on the operational platform, and report an evaluation on operational IoT customers.
Figures


Figures from the paper (2 more)

Forward citations
Cited by 1 Pith paper
-
Multimodal Fusion And Sparse Attention-based Alignment Model for Long Sequential Recommendation
Proposes MUFASA, a multimodal fusion plus sparse attention model for long sequential recommendation, reporting state-of-the-art and online A/B gains.
Reference graph
Works this paper leans on
-
[19]
Signaling traffic in internet- of-things mobile networks
Geissler, S., Wamser, F., Bauer, W., Krolikowski, M., Gebert, S., and Hoßfeld, T. Signaling traffic in internet- of-things mobile networks. In 2021 IFIP/IEEE International Symposium on Integrated Network Management (IM)(2021), pp. 452–458
work page 2021
-
[20]
Geißler, S., Lutu, A., Wamser, F., Favale, T., Vomhoff, V., Krolikowski, M., Mellia, M., Perino, D., and Hoßfeld, T. Untangling iot global connectivity: The impor- tance of mobile signaling traffic.IEEETransactionsonNetwork and Service Management 21, 4 (2024), 4435–4449
work page 2024
-
[40]
Characterizing mobile signaling anomalies in the internet-of-things
Vomhoff, V., Geissler, S., Loh, F., Bauer, W., and Hoss- feld, T. Characterizing mobile signaling anomalies in the internet-of-things. In NOMS 2022-2022 IEEE/IFIP Network Operations and Management Symposium(2022), pp. 1–6
work page 2022
-
[1]
https://hologram.io, Accessed: June 13, 2024
Hologram. https://hologram.io, Accessed: June 13, 2024
work page 2024
-
[2]
A new look at the statistical model identification
Akaike, H. A new look at the statistical model identification. IEEETransactionsonAutomaticControl19 ,6(1974),716–723
work page 1974
-
[3]
Global Mobile Network Aggregators: Taxonomy, Roaming Performance and Optimization
Alcalá-Marín, S., Raman, A., Wu, W., Lutu, A., Bag- nulo, M., Alay, O., and Bustamante, F. Global Mobile Network Aggregators: Taxonomy, Roaming Performance and Optimization. In Proceedings of the 20th Annual International Conference on Mobile Systems, Applications and Services(New York, NY, USA, 2022), MobiSys ’22, Association for Computing Machinery, p. 183–195
work page 2022
-
[4]
Andrade, C. E., Byers, S. D., Gopalakrishnan, V., Hale- povic, E., Poole, D. J., Tran, L. K., and Volinsky, C. T.Connected cars in cellular network: a measurement study. In Proceedings of the 2017 Internet Measurement Conference (2017), ACM, pp. 235–241
work page 2017
-
[5]
End-to-end attention-based large vocabulary speech recognition
Bahdanau, D., Chorowski, J., Serdyuk, D., Brakel, P., and Bengio, Y. End-to-end attention-based large vocabulary speech recognition. In 2016 IEEE international conference on acoustics, speech and signal processing (ICASSP)(2016), IEEE, pp. 4945–4949
work page 2016
Show all 45 references
-
[6]
In 2020 IEEE Inter- national Conference on Smart Computing (SMARTCOMP) (2020), IEEE, pp
Bellini, P., Cenni, D., Nesi, P., and Soderi, M.Anomaly detection on iot data for smart city. In 2020 IEEE Inter- national Conference on Smart Computing (SMARTCOMP) (2020), IEEE, pp. 416–421
2020
-
[7]
arXiv preprint arXiv:2004.00433 (2020)
Braei, M., and Wagner, S.Anomaly detection in univariate time-series: A survey on the state-of-the-art. arXiv preprint arXiv:2004.00433 (2020)
2004 arXiv
-
[8]
Random forests
Breiman, L. Random forests. Machine learning 45, 1 (2001), 5–32
2001
-
[9]
Britz, D., Goldie, A., Luong, M.-T., and Le, Q.Massive exploration of neural machine translation architectures.arXiv preprint arXiv:1703.03906(2017)
2017 arXiv
-
[10]
Chalapathy, R., and Chawla, S.Deep learning for anomaly detection: A survey.arXiv preprint arXiv:1901.03407(2019)
1901 arXiv
-
[11]
Anomaly detection: A survey
Chandola, V., Banerjee, A., and Kumar, V. Anomaly detection: A survey. ACM computing surveys (CSUR) 41, 3 (2009), 1–58
2009
-
[12]
Chatterjee, A., and Ahmed, B. S. Iot anomaly detection methods and applications: A survey. Internet of Things 19 (2022), 100568
2022
-
[13]
A., Mısırlı, G., and Fan, Z
Cook, A. A., Mısırlı, G., and Fan, Z. Anomaly detection for IoT time-series data: A survey. IEEE Internet of Things Journal 7, 7 (2019), 6481–6494
2019
-
[14]
Nearest neighbor pattern classifi- cation
Cover, T., and Hart, P. Nearest neighbor pattern classifi- cation. IEEE transactions on information theory 13, 1 (1967), 21–27
1967
-
[15]
A comprehensive study of anomaly detection schemes in IoT networks using machine learning algorithms
Diro, A., Chilamkurti, N., Nguyen, V.-D., and Heyne, W. A comprehensive study of anomaly detection schemes in IoT networks using machine learning algorithms. Sensors 21, 24 (2021), 8320
2021
-
[16]
Machine learning techniques for network anomaly detection: A survey
Eltanbouly, S., Bashendy, M., AlNaimi, N., Chkirbene, Z., and Erbad, A. Machine learning techniques for network anomaly detection: A survey. In 2020 IEEE International Conference on Informatics, IoT, and Enabling Technologies (ICIoT) (2020), IEEE, pp. 156–162
2020
-
[17]
Global cellular connectivity platform for IoT
Emnify. Global cellular connectivity platform for IoT. https: //www.emnify.com/es/, Accessed: June 13, 2024
2024
-
[18]
Anomaly detection, analysis and prediction techniques in IoT environment: A systematic literature review
Fahim, M., and Sillitti, A. Anomaly detection, analysis and prediction techniques in IoT environment: A systematic literature review. IEEE Access 7(2019), 81664–81681
2019
-
[21]
B., Azorin, R., Gallo, M., Finamore, A., and Rossi, D
Houidi, Z. B., Azorin, R., Gallo, M., Finamore, A., and Rossi, D. Towards a systematic multi-modal representation learning for network data. InACM HotNets(Nov. 2022)
2022
-
[22]
arXiv preprint arXiv:1502.03167(2015)
Ioffe, S., and Szegedy, C.Batch normalization: Accelerating deepnetworktrainingbyreducinginternalcovariateshift. arXiv preprint arXiv:1502.03167(2015)
2015 arXiv
-
[23]
InCEUR workshop proceedings (2014), vol
Kalinichenko, L., Shanin, I., and Taraban, I.Methods for anomaly detection: A survey. InCEUR workshop proceedings (2014), vol. 1297, p. 2025
2014
-
[24]
P., and Welling, M.Auto-encoding variational bayes
Kingma, D. P., and Welling, M.Auto-encoding variational bayes. arXiv preprint arXiv:1312.6114(2013)
2013 arXiv
-
[25]
InIMC’18 (2018)
Kolamunna, H., Leontiadis, I., Perino, D., Seneviratne, S., Thilakarathna, K., and Seneviratne, A.A First Look at SIM-Enabled Wearables in the Wild. InIMC’18 (2018)
2018
-
[26]
Kullback, S., and Leibler, R. A. On information and sufficiency. Annals of Mathematical Statistics 22, 1 (1951), 79– 86
1951
-
[27]
T., Ting, K
Liu, F. T., Ting, K. M., and Zhou, Z.-H. Isolation-based anomaly detection.ACM Transactions on Knowledge Discovery from Data (TKDD) 6, 1 (2012), 3
2012
-
[28]
E., Perino, D., Bagnulo, M., and Bontje, C
Lutu, A., Jun, B., Bustamante, F. E., Perino, D., Bagnulo, M., and Bontje, C. G. A first look at the ip exchange ecosystem. SIGCOMM Comput. Commun. Rev. 50, 4 (Oct. 2020), 25–34
2020
-
[29]
E., and Perino, D
Lutu, A., Jun, B., Finamore, A., Bustamante, F. E., and Perino, D. Where things roam: Uncovering cellular iot/m2m connectivity. InProceedings of the ACM Internet Measurement Conference (New York, NY, USA, 2020), IMC ’20, Association for Computing Machinery, p. 147–161. 13
2020
-
[30]
Lutu, A., Perino, D., Bagnulo, M., and Bustamante, F. E. Insights from Operating an IP Exchange Provider. In Proceedings of the 2021 ACM SIGCOMM 2021 Conference (2021), SIGCOMM ’21, Association for Computing Machinery, p. 718–730
2021
-
[31]
M., Huet, A., and Rossi, D.Human readable network troubleshooting based on anomaly detection and fea- ture scoring
Navarro, J. M., Huet, A., and Rossi, D.Human readable network troubleshooting based on anomaly detection and fea- ture scoring. Computer Networks 219(2022), 109447
2022
-
[32]
J., Mohamed, S., and Wierstra, D.Stochastic backpropagation and approximate inference in deep generative models
Rezende, D. J., Mohamed, S., and Wierstra, D.Stochastic backpropagation and approximate inference in deep generative models. arXiv preprint arXiv:1401.4082(2014)
2014 arXiv
-
[33]
everyone wants to do the modelwork,notthedatawork
Sambasivan, N., Kapania, S., Highfill, H., Akrong, D., Paritosh, P., and Aroyo, L. M.“everyone wants to do the modelwork,notthedatawork”:Datacascadesinhigh-stakesai. In Proceedings of the 2021 CHI Conference on Human Factors in Computing Systems(2021), pp. 1–15
2021
-
[34]
Finding a "kneedle" in a haystack: Detecting knee points in system behavior
Satopaa, V., Albrecht, J., Irwin, D., and Raghavan, B. Finding a "kneedle" in a haystack: Detecting knee points in system behavior. In 2011 31st International Conference on DistributedComputingSystemsWorkshops (2011),pp.166–171
2011
-
[35]
Schwarz, G.Estimating the dimension of a model.The Annals of Statistics 6, 2 (1978), 461–464
1978
-
[36]
Sutskever, I., Vinyals, O., and Le, Q. V. Sequence to sequence learning with neural networks. arXiv preprint arXiv:1409.3215 (2014)
2014 arXiv
-
[37]
KITE platform, Accessed: June 13, 2024
Telefonica. KITE platform, Accessed: June 13, 2024. https: //iot.telefonica.com/en/solutions/connect/kite-platform/
2024
-
[38]
W.Exploratorydataanalysis
Tukey, J. W.Exploratorydataanalysis . Addison-Wesley, 1977
1977
-
[39]
Cloud communications platform for building SMS, voice & messaging applications, Accessed: June 13, 2024
Twilio. Cloud communications platform for building SMS, voice & messaging applications, Accessed: June 13, 2024
2024
-
[41]
A Shortcut through the IPX: Measuring Latencies in Global Mobile Roaming with Regional Breakouts
Vomhoff, V., Sichermann, M., Geißler, S., Lutu, A., Giess, M., and Hoßfeld, T. A Shortcut through the IPX: Measuring Latencies in Global Mobile Roaming with Regional Breakouts. In 8th Network Traffic Measurement and Analysis Conference (TMA)(2024), pp. 1–10
2024
-
[42]
F., Kandeepan, S., Al-Hourani, A., Chavez, K
Wang, S., Balarezo, J. F., Kandeepan, S., Al-Hourani, A., Chavez, K. G., and Rubinstein, B.Machine learning in network anomaly detection: A survey.IEEE Access 9(2021), 152379–152396
2021
-
[43]
V., Norouzi, M., Macherey, W., Krikun, M., Cao, Y., Gao, Q., Macherey, K., et al.Google’sneuralmachinetranslationsystem:Bridging thegapbetweenhumanandmachinetranslation
Wu, Y., Schuster, M., Chen, Z., Le, Q. V., Norouzi, M., Macherey, W., Krikun, M., Cao, Y., Gao, Q., Macherey, K., et al.Google’sneuralmachinetranslationsystem:Bridging thegapbetweenhumanandmachinetranslation. arXivpreprint arXiv:1609.08144 (2016)
2016 arXiv
-
[44]
A., Mustafa, E
Yang, Z., Abbasi, I. A., Mustafa, E. E., Ali, S., and Zhang, M. An anomaly detection algorithm selection service for iot stream data based on tsfresh tool and genetic algorithm. Security and Communication Networks 2021(2021), 1–10
2021
-
[45]
E., Wu, D., and Boulet, B.Time series anomaly detection for smart grids: A survey
Zhang, J. E., Wu, D., and Boulet, B.Time series anomaly detection for smart grids: A survey. In2021 IEEE Electrical Power and Energy Conference (EPEC)(2021), IEEE, pp. 125– 130
2021
Reviewed August 5, 2026 · model on record in the stance chip above.
Discussion (0). Sign in to comment.