REVIEW 3 major objections 4 minor 18 references
Exploring Multimodal AI Reasoning for Meteorological Forecasting from Skew-T Diagrams
T0 review · 3 major / 4 minor · reviewed 2026-08-05 · deepseek-v4-flash
Pith's one-line read A 250-million-parameter vision-language model, fine-tuned to read Skew-T diagrams, predicts three-hour precipitation with accuracy comparable to an operational numerical weather prediction model, despite seeing only a static atmospheric pro
desk verdict A useful proof-of-concept that a small VLM can read Skew-T diagrams, but the headline 'comparable to NWP' is an in-family distillation result, not independent skill. read the letter →
The pith
A machine-rendered reading of the paper's core claim, the machinery that carries it, and where it could break.
The reading
What carries the argument
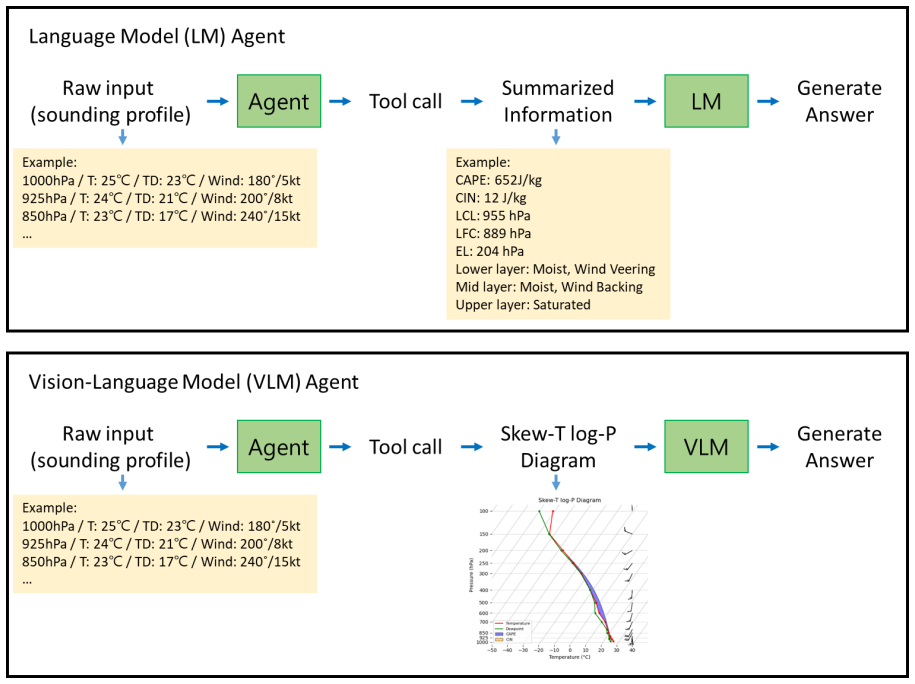
The central mechanism is a two-stage curriculum: Stage I trains visual grounding using VQA samples that label humidity, wind profile, CAPE, CIN, LFC, and EL from hand-set threshold criteria; Stage II trains chain-of-thought reasoning that concludes with a four-level precipitation probability (low, moderate, high, very high). The input is either a textual summary of the sounding or a rendered Skew-T log-P diagram, both derived from IFS-HRES forecast profiles and paired with AWS rain-gauge observations. Fine-tuning uses LoRA on the SmolVLM / SmolLM2 backbones. The claim-carrying output is the four-category precipitation classification, evaluated with CSI, POD, SR, and frequency bias against th
What would settle it
Run the fine-tuned VLM on an independent season (e.g., winter) or a different region using observed rawinsonde profiles, and compute block-bootstrap confidence intervals on CSI; if the skill relative to IFS-HRES drops to noise or reverses, the claim of comparable skill is falsified.
Extended reading notes
Core claim
The central claim is that fine-tuned small vision-language models can extract usable precipitation signal from a Skew-T log-P diagram. The paper reports that SmolVLM-250M, fine-tuned with visual-question-answering grounding followed by chain-of-thought reasoning supervision, achieves a Critical Success Index of 39.3% at the ��0.1 mm/3h threshold versus 33.8% for IFS-HRES; at ��1 mm/3h it scores 38.7% versus 41.2%, and at ��5 mm/3h 28.7% versus 34.3%. The ablation experiments show that removing chain-of-thought supervision collapses performance (CSI drops to about 10% at light-rain thresholds), and attention-map visualization indicates the fine-tuned model focuses on the temperature and dew-p
Load-bearing premise
The evaluation assumes that a single summer of 2024 data over ten South Korean cities is representative enough to make the reported score differences meaningful, and that it is a fair comparison to benchmark a model fed IFS-HRES profiles against IFS-HRES's own precipitation forecast.
Editorial extensions
If this is right
- A lightweight VLM operating on a single static profile could be deployed as a real-time decision-support tool, producing objective, reproducible precipitation-probability estimates at low computational cost.
- The two-stage curriculum—grounding first, reasoning second—appears to be the load-bearing training recipe; without the chain-of-thought stage, skill drops to near-zero, suggesting that reasoning supervision, not just visual recognition, is what makes the diagram-to-forecast mapping work.
- The attention-map results imply the model has learned to use the same visual anchors human forecasters use, which makes the forecast more interpretable to an operator who can inspect where the model is looking.
- The comparison suggests that a meaningful fraction of short-term precipitation predictability is contained in the local vertical profile; if the result holds, it would justify building small profile-reading models as a complement to, or a cheap sanity check on, full NWP output.
Reading between the lines
- The reported parity with IFS-HRES is, at least partly, an in-family distillation result: the VLM sees IFS-HRES profiles, so its skill is bounded by the NWP model that generated its training inputs. A more independent test would train on observed rawinsonde profiles or downgraded reanalysis and benchmark against observations.
- Because the validation is a single summer over ten South Korean cities with no confidence intervals, the skill difference between the 250M and 2.2B models, and even between the VLM and IFS-HRES, may be within sampling noise; a block-bootstrap or an extended multi-season evaluation would settle whether the 'comparable skill' claim is stable.
- The hand-set thresholds in Table 2 (dew-point depression, CAPE/CIN ranges, LFC/EL heights, wind rotation) are presented as faithful proxies for forecaster judgment. A testable extension would be to replace these rule-based labels with labels elicited from operational forecasters and see whether the VLM's grounding stage still transfers.
Editorial analysis
A structured set of objections, weighed in public.
Referee Report
Summary. The paper presents a curriculum-trained small language model (SmolLM2-360M) and small vision-language model (SmolVLM-250M/2.2B) that interpret Skew-T log-P diagrams and predict categorical three-hour precipitation probabilities (thresholds 0.1/1/5 mm per 3 h). Training and validation inputs are IFS-HRES atmospheric profiles, converted into textual summaries or generated Skew-T diagrams, paired with AWS rain-gauge observations. The model is evaluated on summer 2024 data not used in training, with VQA accuracy/F1 for diagnostic tasks and F.BIAS/CSI/POD/SR for precipitation reasoning, benchmarked against IFS-HRES precipitation forecasts. The central claim is that a fine-tuned small VLM achieves skill comparable to an operational NWP model despite using only static profile information.
Significance. The study targets a timely and practical problem: whether compact, interpretable multimodal models can support operational forecasting. The design has genuine strengths: a temporal holdout (summer 2024) independent of training years, an ablation isolating chain-of-thought supervision and multimodal fusion, standard verification metrics, and publicly available code and data. If the central claim were established with proper uncertainty quantification and an appropriate framing of the benchmark, the result would be a useful contribution to AI-assisted meteorology, particularly for low-resource settings. However, the current evidence is weakened by the absence of confidence intervals and by the in-family nature of the NWP comparison, as detailed below.
major comments (3)
- [§3.2, Tables 7–9] The headline 'comparable to IFS-HRES' claim rests entirely on point estimates of CSI, POD, and SR. No confidence intervals or significance tests are reported, and the 3-hourly samples from 10 cities are strongly autocorrelated in space and time, so the effective sample size is far below the raw count. The direction of the comparison changes by threshold: at ≥0.1 mm/3h model (b) has CSI 39.3% versus IFS-HRES 33.8%, while at ≥1 and ≥5 mm/3h IFS-HRES leads (41.2% vs 38.7% and 34.3% vs 28.7%). Without interval estimates or a test that accounts for dependence (e.g., block bootstrap by city/event), these differences cannot be distinguished from sampling noise. This is load-bearing because the paper's core assertion is specifically about comparability.
- [§2.4 and Abstract] The comparison to IFS-HRES is in-family: the VLM consumes Skew-T diagrams generated from IFS-HRES forecast output, while the reference model (g) is IFS-HRES's own precipitation forecast. The VLM is therefore learning to map a subset of IFS-HRES's atmospheric state to observed rainfall, which is better characterized as statistical post-processing or distillation of NWP information than as an independent forecast from atmospheric soundings. The abstract's phrase 'despite relying solely on static atmospheric profiles' invites the reader to infer observational soundings, but the profiles are NWP forecasts. To support the 'alternative to large-scale systems' claim, the authors should either reframe the contribution as NWP-profile post-processing or evaluate on independent observed soundings (e.g., radiosondes) or another model's output, and report how performance changes.
- [§2.2, Table 2] The VQA training labels are deterministic rule-based classifications computed from the same IFS-HRES profiles (humidity by dew-point depression, wind by rotation, CAPE/CIN/LFC/EL by thresholds). This is legitimate supervised labeling, but it means the 'emulate human forecasters' claim is not tested against human expert annotations. The curriculum may simply teach the model to reproduce these thresholds from visual features. The attention-map analysis in §2.3 and Figures 2–3 is qualitative and does not close this gap. The precipitation reasoning claim is not circular, since labels come from AWS observations, but the interpretability/emulation aspect is weaker than presented.
minor comments (4)
- [Table 6] The EL row is misaligned: 'Low Moderate High - 127 2,355' likely indicates a missing count for the Low category or a formatting error. Please correct so that sample sizes are unambiguous.
- [§2.4] Please state explicitly whether validation data use the same lead-time range (0–9 h) and 00/12 UTC cycling as training, and whether any deduplication was applied to reduce temporal overlap across lead times. Also clarify how AWS stations are matched to the 10 cities (e.g., nearest station, station average).
- [Figures 2–3] The attention maps are presented qualitatively. Consider adding a quantitative metric (e.g., intersection with expert-defined regions or change in attention mass before/after fine-tuning) to substantiate the claim that the model learns to focus on relevant features.
- [Abstract and Introduction] There are minor typographical artifacts in the provided text, e.g., 'V ision-Language' and irregular spacing. A careful copyedit is recommended.
Circularity Check
No significant circularity: the central evaluation is anchored to independent AWS rain-gauge observations, not to the model's own inputs or outputs.
full rationale
The paper's core claim is that a fine-tuned VLM, given a Skew-T diagram generated from IFS-HRES profiles, can predict next-3-hour precipitation with skill comparable to IFS-HRES itself. The precipitation target is AWS rain-gauge observations (Section 2.4), which are external to both the VLM and IFS-HRES. The VLM is trained on profiles from IFS-HRES but labeled by AWS observations, so its prediction is not a fitted renaming of IFS-HRES output. Benchmarking against IFS-HRES is an in-family comparison because the VLM consumes IFS-HRES atmospheric state, but this is a limitation on external validity rather than a circular derivation: the VLM does not use IFS-HRES precipitation as a training label or as an input. The rule-based VQA labels (Table 2) are deterministic functions of the same profiles, but they are supervised classification targets, not predictions claimed to be derived from first principles. The only self-citation (Zhang et al. 2025, which includes co-author H. Yang) supports a general statement about LLMs and is not load-bearing. No equation or fitted parameter is shown to reduce to the benchmark target by construction, so no circular step is demonstrated.
Assumptions & free parameters
free parameters (4)
- precipitation probability thresholds =
0.1, 1.0, 5.0 mm/3h
- VQA diagnostic thresholds =
dew point: >3/1°C; CAPE: 500/1000; CIN: 75/150; LFC: 900/700 hPa; EL: 400/250 hPa; wind: ±30°
- vertical layer partitions =
1000-850, 850-500, 500-250 hPa
- LoRA rank and learning rate =
r=16, alpha=64, lr=1e-4, dropout=0.05-0.1
assumptions (5)
- standard math Validation samples are treated as independent for scoring
- domain assumption A static atmospheric column (Skew-T profile) contains sufficient information to estimate 3-hour precipitation probability
- domain assumption Rule-based thresholds in Table 2 are valid proxies for the visual features forecasters use
- domain assumption AWS rain-gauge observations are accurate ground truth for 3-hour precipitation
- domain assumption The generated Skew-T diagrams faithfully preserve the visual information needed for grounding
Cite this review
Pith. "Pith review of Exploring Multimodal AI Reasoning for Meteorological Forecasting from Skew-T Diagrams." pith.science (2026). https://pith.science/paper/MLLA7REP
@misc{pith2026250812198,
  author       = {Pith},
  title        = {Pith review of: Exploring Multimodal AI Reasoning for Meteorological Forecasting from Skew-T Diagrams},
  year         = {2026},
  howpublished = {\url{https://pith.science/paper/MLLA7REP}},
  note         = {Machine review of arXiv:2508.12198}
}
read the original abstract
Forecasting from atmospheric soundings is a fundamental task in operational meteorology, often requiring structured visual reasoning over Skew-T log-P diagrams by human forecasters. While recent advances in Vision-Language Models (VLMs) have shown promise in other scientific domains, their application to meteorological diagram interpretation remains largely unexplored. In this study, we present a lightweight AI assistant that interprets Skew-T diagrams using a small language model (LM) and a small VLM fine-tuned to emulate human forecasters. Using a curriculum learning framework, we first train the models to identify key atmospheric features from diagrams through visual question answering, followed by chain-of-thought reasoning tasks that estimate precipitation probability based on the derived visual groundings. Model inputs include either textual summaries or generated Skew-T diagrams derived from operational Numerical Weather Prediction (NWP) forecasts, paired with three-hour precipitation observations from South Korea's Auto Weather Stations network. Evaluation results demonstrate that the fine-tuned VLM achieves skill comparable to an operational NWP model, despite relying solely on static atmospheric profiles. Ablation studies reveal that visual grounding and reasoning supervision are critical for performance, while attention map analysis confirms that the model learns to focus on relevant meteorological features. These findings highlight the potential of compact, interpretable multimodal models to support weather forecasting tasks. The approach offers a computationally efficient alternative to large-scale systems, and future work could extend it to more complex applications.
Figures

Reference graph
Works this paper leans on
-
[1]
Agrawal, A., J. Lu, S. Antol, M. Mitchell, C. L. Zitnick, D. Batra, and D. Parikh, 2016: VQA: Visual question answering. arXiv, https://arxiv.org/abs/1505.00468
arXiv 2016
-
[2]
Fourrier, B. Burtenshaw, H. Larcher, H. Zhao, C. Zakka, M. Morlon, C. Raffel, L. v. Werra, and T. Wolf, 2025: SmolLM2: When Smol goes big -- Data-centric training of a small language model. arXiv, https://arxiv.org/abs/2502.02737
arXiv 2025
-
[3]
Belcak, P., G. Heinrich, S. Diao, Y. Fu, X. Dong, S. Muralidharan, Y. C. Lin, and P. Molchanov, 2025: Small language models are the future of agentic AI. arXiv, https://arxiv.org/abs/2506.02153
arXiv 2025
-
[4]
Bengio, Y., J. Louradour, R. Collobert, and J. Weston, 2009: Curriculum learning. Proc. 26th Annual International Conference on Machine Learning, 41–48, https://doi.org/10.1145/1553374.1553380
-
[5]
M., 2006: Pattern Recognition and Machine Learning
Bishop, C. M., 2006: Pattern Recognition and Machine Learning. Springer, 738 pp
work page 2006
-
[6]
Human Attention in Visual Question Answering: Do Humans and Deep Networks Look at the Same Regions?
Das, A., H. Agrawal, C. L. Zitnick, D. Parikh, and D. Batra, 2016: Human Attention in Visual Question Answering: Do Humans and Deep Networks Look at the Same Regions? arXiv, https://arxiv.org/abs/1606.03556
work page Pith review arXiv 2016
-
[7]
L., 1959: Introduction to Theoretical Meteorology
Hess, S. L., 1959: Introduction to Theoretical Meteorology. Holt, Rinehart and Winston, 364 pp
work page 1959
-
[8]
Hu, E. J., Y. Shen, P. Wallis, Z. Allen-Zhu, Y. Li, S. Wang, L. Wang, and W. Chen, 2021: LoRA: Low-Rank Adaptation of Large Language Models. arXiv, https://arxiv.org/abs/2106.09685
arXiv 2021
Show all 18 references
-
[9]
Perez, A
Lewis, P., E. Perez, A. Piktus, F. Petroni, V. Karpukhin, N. Goyal, H. Küttler, M. Lewis, W.- t. Yih, T. Rocktäschel, S. Riedel, and D. Kiela, 2021: Retrieval-Augmented Generation for Knowledge-Intensive NLP Tasks. arXiv, https://arxiv.org/abs/2005.11401
2021 arXiv
-
[10]
Zohar, M
Marafioti, A., O. Zohar, M. Farré, M. Noyan, E. Bakouch, P. Cuenca, C. Zakka, L. B. Allal, A. Lozhkov, N. Tazi, V. Srivastav, J. Lochner, H. Larcher, M. Morlon, L. Tunstall, L. v. 24 This Work has not yet been peer-reviewed and is provided by the contributing Authors as a mean...
2025 arXiv
-
[11]
B., Jr., 1962: The serial position effect of free recall
Murdock, B. B., Jr., 1962: The serial position effect of free recall. J. Exp. Psychol., 64, 482– 488, https://doi.org/10.1037/h0045106
1962 doi
-
[12]
Colas, L
Portelas, R., C. Colas, L. Weng, K. Hofmann, and P.-Y. Oudeyer, 2020: Automatic Curriculum Learning For Deep RL: A Short Survey. arXiv, https://arxiv.org/abs/2003.04664
2020 arXiv
-
[13]
Bromberg, J. Sisk, L. Barrington, A. Bell, and F. Sha, 2023: WeatherBench 2: A benchmark for the next generation of data-driven global weather models. J. Adv. Model. Earth Syst., 16, https://doi.org/10.1029/2023MS004019
2023 doi
-
[14]
Caballero, F
Shi, W., J. Caballero, F. Huszár, J. Totz, A. P. Aitken, R. Bishop, D. Rueckert, and Z. Wang, 2016: Real-Time Single Image and Video Super-Resolution Using an Efficient Sub-Pixel Convolutional Neural Network. arXiv, https://arxiv.org/abs/1609.05158
2016 arXiv
-
[15]
Shazeer, N
Vaswani, A., N. Shazeer, N. Parmar, J. Uszkoreit, L. Jones, A. N. Gomez, L. Kaiser, and I. Polosukhin, 2023: Attention is all you need. arXiv, https://arxiv.org/abs/1706.03762
2023 arXiv
-
[16]
Wei, J., X. Wang, D. Schuurmans, M. Bosma, B. Ichter, F. Xia, E. Chi, Q. Le, and D. Zhou, 2023: Chain-of-Thought Prompting Elicits Reasoning in Large Language Models. arXiv, https://arxiv.org/abs/2201.11903
2023 arXiv
-
[17]
S., 1995: Statistical Methods in the Atmospheric Sciences: An Introduction
Wilks, D. S., 1995: Statistical Methods in the Atmospheric Sciences: An Introduction. Academic Press
1995
-
[18]
Bundy, S
Evans, A. Bundy, S. Dzeroski, J. Tegner, and H. Zenil, 2025: Exploring the role of large language models in the scientific method: From hypothesis to discovery. npj Artificial Intelligence, 1, 14, https://doi.org/10.1038/s44387-025-00019-5
2025 doi
Reviewed August 5, 2026 · model on record in the stance chip above.
Discussion (0). Sign in to comment.