REVIEW 3 major objections 5 minor 39 references
Locally Pareto-Optimal Interpretations for Black-Box Machine Learning Models
T0 review · 3 major / 5 minor · reviewed 2026-08-05 · deepseek-v4-flash
Pith's one-line read This paper shows that decision-tree interpretations of black-box models can be certified Pareto-optimal within a user-chosen neighborhood, and that this local certificate is attainable on benchmarks where computing the global Pareto-optimal
desk verdict A useful local-Pareto relaxation with a clean two-phase design, but the printed SAT encoding is unsatisfiable by construction, so the certificate is vacuous as written. read the letter →
The pith
A machine-rendered reading of the paper's core claim, the machinery that carries it, and where it could break.
The reading
What carries the argument
The central mechanism is the local Pareto-optimality window: given an interpretation with goodness tuple (c,e), a tree is LPO if no other tree in the same grammar dominates (c,e) while keeping correctness within δc and explainability within δe. Verification is carried by a Boolean formula Φ = Φsyntax ∧ Φcorr ∧ Φexp ∧ Φdom: the first conjunct restricts the syntax to decision trees, the next two bound correctness and explainability within the slack window using cardinality constraints, and the last enforces strict Pareto dominance. A SAT solver evaluates this formula for each candidate; unsatisfiability certifies local optimality, while a satisfying assignment yields a dominating tree that rep
What would settle it
On a small benchmark such as Balance Scale with the stated node budget, exhaustively enumerate all semantically distinct decision trees, compute their correctness exactly on the full dataset, and check whether any tree inside the claimed slack window Pareto-dominates one of ALPO's certified trees; finding one would refute the certificate's transfer from sample to data.
Extended reading notes
Core claim
The central claim is Theorem 1: whenever the two-phase procedure terminates, every decision tree in the confirmed output set is locally Pareto-optimal with respect to the user-provided correctness slack δc and explainability slack δe, and every best-effort tree is no worse, under the dominance order, than some tree produced by the search phase. The local check is exact relative to the empirical correctness and explainability measures: the Boolean formula Φ(c,e,c+δc,e+δe) is satisfiable iff a decision tree in the grammar dominates (c,e) and stays within the window. Empirically, the paper reports that the certified points found by ALPO coincide with or closely approximate the global Pareto fro
Load-bearing premise
The guarantee's strength depends on treating the measured accuracy on a sample as the true accuracy; with a 25-percent tolerance and slack windows of about two percent, a tree can be certified as locally optimal on the sample while a genuinely better tree exists on the true distribution.
Editorial extensions
If this is right
- Users can stop ALPO at any time and still receive a set of certified locally Pareto-optimal interpretations; with more time, the best-effort set monotonically improves under the Pareto order and approaches the global front.
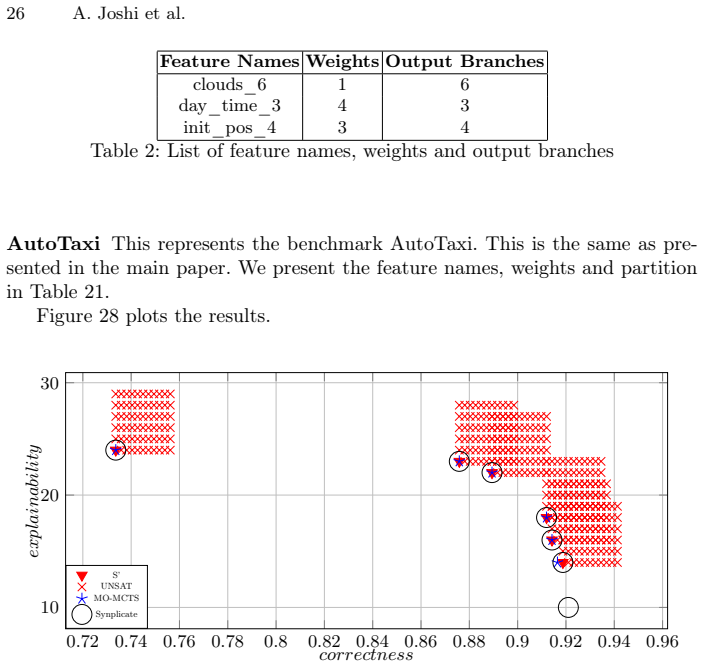
- Because every globally Pareto-optimal interpretation is also locally Pareto-optimal for any slack, the local certificates coincide with global ones whenever the full front is found; the experiments exhibit this coincidence on AutoTaxi and Balance Scale.
- If the slack windows are set large enough, a local certificate becomes a global Pareto-optimality certificate, so the framework can recover global guarantees given sufficient slack and timeout.
- The verification phase is compatible with any explainability measure that can be encoded symbolically, not just the size-and-feature-weight score used in the experiments.
- On benchmarks with larger feature spaces (Car Evaluation, Yeast), ALPO outputs certified locally Pareto-optimal trees where the global synthesis method produces nothing at all.
- The anytime property means the approach degrades gracefully under tighter time budgets, still yielding non-empty LPO sets at the 5-minute timeout.
- The local Pareto-optimality notion captures interpretations that cannot be perturbed into a strictly better one within a small neighborhood, which is a useful robustness property for explanations.
Reading between the lines
- The certificate's force is limited by the correctness estimate: with PAC tolerance ε = 0.25 and slack windows δc around 0.02, the SAT check proves local optimality only with respect to the sampled counts, not the underlying distribution. A quick test would be to re-verify the same certified trees using exact counts on a fixed dataset and compare.
- Any candidate generator — not just multi-objective Monte-Carlo tree search — could feed the SAT verification phase, so the local certificate could be combined with other search heuristics such as beam search or local search to scale even further.
- Because the SAT encoding's correctness constraints grow with the number of samples, the practical bottleneck will shift to sample count; sample compression or incremental SAT solving could extend the method to larger datasets, an effect not evaluated in the paper.
- The paper's own future-work suggestion — feeding SAT-discovered dominating trees back into the search as new seeds — would turn the verifier into a search-improvement operator, potentially accelerating convergence toward the global Pareto front.
Signed reviews
Editorial analysis
A structured set of objections, weighed in public.
Referee Report
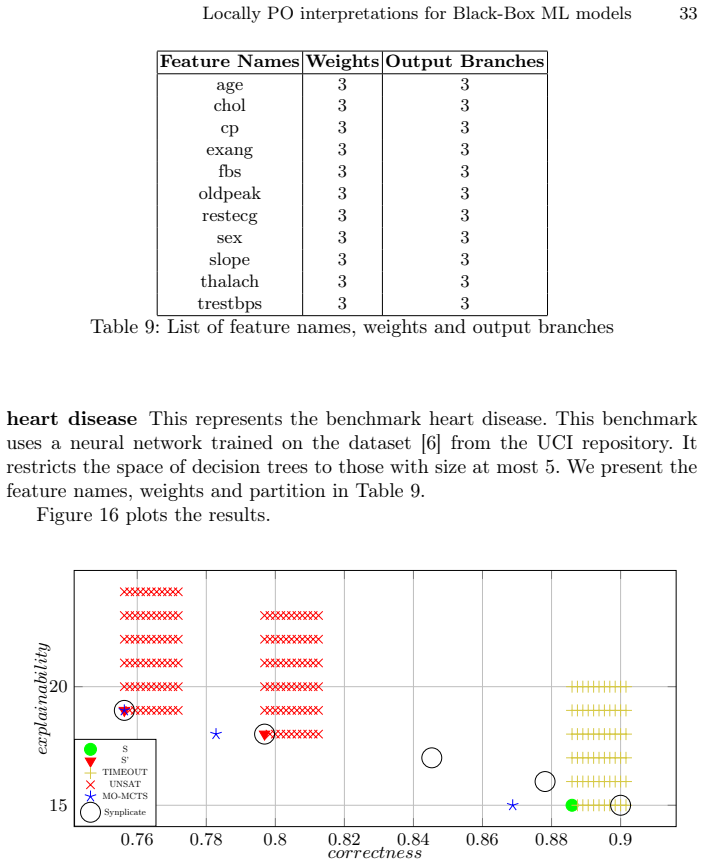
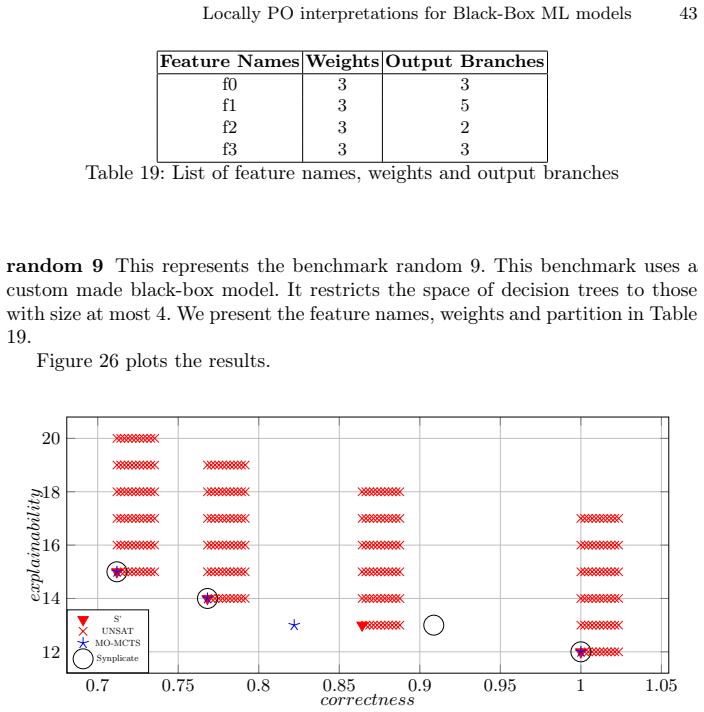
Summary. The paper introduces a notion of locally Pareto-optimal (LPO) interpretations for black-box ML models: an interpretation D is LPO w.r.t. slacks (δc, δe) if no other decision tree in the class GB has correctness and explainability measures that dominate D while staying within the slacks. The authors propose a two-phase algorithm (ALPO): first, MO-MCTS generates a best-effort Pareto front; second, each candidate is checked by a SAT solver against the LPO condition, replacing the candidate whenever a dominating tree is found and moving verified candidates to the output set S'. Theorem 1 states that every tree in S' is LPO. The experiments compare ALPO with the global-synthesis tool Synplicate on four main benchmarks; on AutoTaxi and Balance Scale the ALPO front closely matches the global front, and on Car Evaluation and Yeast ALPO still produces certified trees where Synplicate times out. The appendix gives a SAT encoding for the verification step.
Significance. If the technical issues are resolved, the LPO approach is a useful middle ground between heuristic multi-objective search and expensive global MaxSAT-based synthesis: it permits anytime guarantees and scales to instances where global certification fails. The paper's separation of search and verification is clean, the problem definition is precise, and the authors provide an open-source implementation (ALPO) and experiments on multiple benchmarks. The empirical comparison is directly relevant, though it is limited to two benchmarks where the global tool terminates. The central proof, however, is undermined by a likely typographical error in the published SAT encoding, and the statistical setting makes the distribution-level interpretation of the certificates questionable. These issues are fixable in revision.
major comments (3)
- [Appendix A, F6] Appendix A defines F6 := ∧_{1≤i≤B}(¬u_i ↔ u_i). Each conjunct is equivalent to false, so F6 — and hence the full formula Φ(c,e,c+δc,e+δe) — is unsatisfiable for every candidate tree. Consequently Check_SAT in Algorithm 1 always returns UNSAT, every MO-MCTS output is moved to S′, and Lemma 2 as stated is false: the formula does not encode existence of a dominating tree. Theorem 1 then holds vacuously. If the intended variable is a different one (e.g., an overline{u}_i encoding 'not used'), the text and the proof of Lemma 2 must be corrected; as printed, the LPO certificate is not established.
- [Section 5 (PAC settings, Figure 6a)] The paper sets ε=0.25 and δ=0.1 for the PAC correctness estimates, while choosing δc≈0.02 (10/K) and reporting differences such as correctness 0.916 vs 0.918 (Figure 6a) as meaningful improvements. The SAT check is exact only with respect to the empirical correctness values; with a PAC tolerance of ±0.25, the certificate 'D is LPO' does not transfer to the true distribution ∆(I×O). To support the claim that ALPO's results 'closely match' global guarantees, either set ε comparable to δc, provide a confidence-interval-aware certificate, or explicitly state that all LPO guarantees are sample-relative and adjust the distribution-level phrasing.
- [Section 1 (contribution 3), Lemma 1, Corollary 1] The paper claims 'our approach converges monotonically to the global optimal' (contribution 3). Lemma 1 only shows that the MO-MCTS internal best-effort set is pointwise monotone under ⪯; Corollary 1 shows only that with sufficiently large slacks and timeouts at least one PO interpretation is eventually found. Neither statement establishes convergence of the output front to the global Pareto front as the number of iterations grows. Please add a formal statement and proof of such convergence, or weaken the contribution to 'monotone improvement of the best-effort front with local guarantees at every stop.'
minor comments (5)
- [Section 4.2 / Algorithm 1] In the definition of S, '(D, C(D), E(E))' should read '(D, C(D), E(D))'. In Algorithm 1, the tuple type '(c,e)' should be declared before being used.
- [Appendix A] The variable u_i is used in F5 for 'reachable from the root' and reused in F6/F7 for 'node not used'. This notational clash likely caused the F6 error and should be resolved with distinct variable names.
- [Figure 6 legend] The red crosses ('absence of interpretations') are unclear: a cross at a coordinate presumably means that no tree with that exact explainability/accuracy pair was found. Please define precisely how 'absence' is computed in the discrete measure space.
- [Section 5, Synplicate baseline] Since Synplicate is the authors' own prior tool and was modified in-house ('we modified it slightly to restrict the interpretations to decision trees'), the exact modifications, parameter settings (PAC sample, timeout allocation, slack choices) should be reported for reproducibility, ideally by releasing the modified baseline.
- [References] The reference list contains duplicates ([25,26] and [31,32] both refer to the same Yeast and Balance Scale datasets). Please merge them.
Circularity Check
As printed, the SAT certificate is vacuous: Appendix A's F6 is a conjunction of contradictions, so every Check_SAT query is UNSAT; Lemma 2 and Theorem 1 do not establish LPO.
-
self definitional
[Appendix A, Φexp (F6), used by Lemma 2 (Section 4.2) and Theorem 1 (Section 4.3)]
"Then we have another variable ui which encodes that the ith node is not used F6 := ^_{1≤i≤B} ¬ui ↔ ui"
Each conjunct (¬u_i ↔ u_i) is logically equivalent to false, so F6 is unsatisfiable and hence the full Φ is unsatisfiable for every candidate (c,e,c+δc,e+δe). In Algorithm 1, Check_SAT always reports UNSAT, every MO-MCTS tree is moved to S′, and Theorem 1's conclusion holds only because no SAT assignment can exist, not because no dominating tree lies in the window. Lemma 2's 'satisfiable iff there is a dominating tree' is therefore false as printed: the RHS can hold while the LHS is always false. The certificate is vacuous by construction.
full rationale
The paper's central certificate chain is Lemma 2 → Algorithm 1 → Theorem 1. As printed, that chain collapses at F6: the encoding of the explainability bound contains a conjunction of biconditionals between each reachability variable and its negation, which is unsatisfiable regardless of slacks or candidate tree. Consequently the SAT-based 'verification' is not checking for a dominating tree; it is checking a formula that cannot be satisfied. This is a self-definitional vacuity: the verification outcome is forced by the formula's definition rather than by the nonexistence of a dominating interpretation. This is not rescued by the PAC estimation discussion; even with exact measures, the printed Φ cannot certify anything. Separately, the PAC tolerance ε=0.25 is far larger than the reported δc windows (≈0.02), so even a corrected encoding would at most certify LPO w.r.t. empirical counts, not the distributional measure in Definition 2; this is a soundness gap rather than a circularity. The use of the authors' prior Synplicate tool as an experimental baseline, and the borrowing of encoding ideas from [35], are normal uses of prior work and not load-bearing circularity: the LPO definition, MO-MCTS integration, and the verification architecture are new. However, because the printed verification formula makes the central guarantee vacuous, the circularity score is high.
Assumptions & free parameters
free parameters (5)
- correctness slack δc =
0.023, 0.018, 0.021, 0.017 per benchmark; rule 10/K with K sample count
- explainability slack δe =
5 for all experiments
- feature weights w_i =
3 for all features except AutoTaxi (clouds=1, day_time=4, init_pos=3)
- PAC tolerance and confidence (ε, δ) =
ε=0.25, δ=0.1
- node budget B =
at most 5 internal nodes in main benchmarks; 3 to 5 in appendix
assumptions (4)
- standard math PAC sample-complexity bound for the finite class GB (standard theory, [30])
- domain assumption Semantically distinct decision trees form a finite class, bounded by removing repeated features along any root-to-leaf path
- domain assumption Lemma 1: the MO-MCTS set of best-effort Pareto points improves monotonically across iterations
- domain assumption The SAT encoding Φ exactly captures GB and the correctness/explainability windows (Lemma 2)
Cite this review
Pith. "Pith review of Locally Pareto-Optimal Interpretations for Black-Box Machine Learning Models." pith.science (2026). https://pith.science/paper/7GK3OHRM
@misc{pith2026250815220,
  author       = {Pith},
  title        = {Pith review of: Locally Pareto-Optimal Interpretations for Black-Box Machine Learning Models},
  year         = {2026},
  howpublished = {\url{https://pith.science/paper/7GK3OHRM}},
  note         = {Machine review of arXiv:2508.15220}
}
read the original abstract
Creating meaningful interpretations for black-box machine learning models involves balancing two often conflicting objectives: accuracy and explainability. Exploring the trade-off between these objectives is essential for developing trustworthy interpretations. While many techniques for multi-objective interpretation synthesis have been developed, they typically lack formal guarantees on the Pareto-optimality of the results. Methods that do provide such guarantees, on the other hand, often face severe scalability limitations when exploring the Pareto-optimal space. To address this, we develop a framework based on local optimality guarantees that enables more scalable synthesis of interpretations. Specifically, we consider the problem of synthesizing a set of Pareto-optimal interpretations with local optimality guarantees, within the immediate neighborhood of each solution. Our approach begins with a multi-objective learning or search technique, such as Multi-Objective Monte Carlo Tree Search, to generate a best-effort set of Pareto-optimal candidates with respect to accuracy and explainability. We then verify local optimality for each candidate as a Boolean satisfiability problem, which we solve using a SAT solver. We demonstrate the efficacy of our approach on a set of benchmarks, comparing it against previous methods for exploring the Pareto-optimal front of interpretations. In particular, we show that our approach yields interpretations that closely match those synthesized by methods offering global guarantees.
Figures


Figures from the paper (27 more)








Reference graph
Works this paper leans on
-
[1]
UCI Machine Learning Repository (2017), DOI: https://doi.org/10.3886/ICPSR37305.v1
National Poll on Healthy Aging (NPHA). UCI Machine Learning Repository (2017), DOI: https://doi.org/10.3886/ICPSR37305.v1
-
[2]
UCI Machine Learning Repository (2020), DOI: https://doi.org/10.24432/C5VG8H
Early Stage Diabetes Risk Prediction. UCI Machine Learning Repository (2020), DOI: https://doi.org/10.24432/C5VG8H
-
[3]
UCI Machine Learning Repository (2020), DOI: https://doi.org/10.24432/C5Z89R
Heart Failure Clinical Records. UCI Machine Learning Repository (2020), DOI: https://doi.org/10.24432/C5Z89R
-
[4]
IEEE Access 6, 52138–52160 (2018)
Adadi, A., Berrada, M.: Peeking inside the black-box: A survey on explain- able artificial intelligence (XAI). IEEE Access 6, 52138–52160 (2018). https: //doi.org/10.1109/ACCESS.2018.2870052, https://doi.org/10.1109/ACCESS. 2018.2870052
arXiv 2018
-
[5]
UCI Machine Learning Repository (1991), DOI: https://doi.org/10.24432/C5688J
Aha, D.: Tic-Tac-Toe Endgame. UCI Machine Learning Repository (1991), DOI: https://doi.org/10.24432/C5688J
doi:10.24432/c5688j 1991
-
[6]
UCI Machine Learning Repository (1989), DOI: https://doi.org/10.24432/C52P4X
Andras, J., William, S., Pfisterer, M., Detrano, R.: Heart Disease. UCI Machine Learning Repository (1989), DOI: https://doi.org/10.24432/C52P4X
doi:10.24432/c52p4x 1989
-
[7]
In: Heule, M., Iser, M., Järvisalo, M., Suda, M
Biere, A., Faller, T., Fazekas, K., Fleury, M., Froleyks, N., Pollitt, F.: CaDiCaL, Gimsatul, IsaSAT and Kissat entering the SAT Competition 2024. In: Heule, M., Iser, M., Järvisalo, M., Suda, M. (eds.) Proc. of SAT Competition 2024 – Solver, Benchmark and Proof Checker Descriptions. Department of Computer Science Re- port Series B, vol. B-2024-1, pp. 8–1...
work page 2024
-
[8]
UCI Machine Learning Repository (1988), DOI: https://doi.org/10.24432/C5JP48
Bohanec, M.: Car Evaluation. UCI Machine Learning Repository (1988), DOI: https://doi.org/10.24432/C5JP48
doi:10.24432/c5jp48 1988
Show all 39 references
-
[9]
IEEE Trans
Browne, C., Powley, E.J., Whitehouse, D., Lucas, S.M., Cowling, P.I., Rohlfshagen, P., Tavener, S., Liebana, D.P., Samothrakis, S., Colton, S.: A survey of monte carlo tree search methods. IEEE Trans. Comput. Intell. AI Games4(1), 1–43 (2012)
2012
-
[10]
Charalampakos, F., Tsouparopoulos, T., Koutsopoulos, I.: Joint explainability- performance optimization with surrogate models for ai-driven edge services (2025), https://arxiv.org/abs/2503.07784
2025 arXiv
-
[11]
CoRR abs/2111.01825 (2021)
Chen, W., Liu, L.: Pareto monte carlo tree search for multi-objective informative planning. CoRR abs/2111.01825 (2021)
2021 arXiv
-
[12]
In: Touretzky, D.S., Mozer, M., Hasselmo, M.E
Craven, M.W., Shavlik, J.W.: Extracting tree-structured representations of trained networks. In: Touretzky, D.S., Mozer, M., Hasselmo, M.E. (eds.) Advances in Neural Information Processing Systems 8, NIPS, Denver, CO, USA, Novem- ber 27-30, 1995. pp. 24–30. MIT Press (1995), h...
1995
-
[13]
In: CAV (1)
Fremont, D.J., Chiu, J., Margineantu, D.D., Osipychev, D., Seshia, S.A.: Formal analysis and redesign of a neural network-based aircraft taxiing system with verifai. In: CAV (1). Lecture Notes in Computer Science, vol. 12224, pp. 122–134. Springer (2020)
2020
-
[14]
In: ICML
Gelly, S., Silver, D.: Combining online and offline knowledge in UCT. In: ICML. ACM International Conference Proceeding Series, vol. 227, pp. 273–280. ACM (2007)
2007
-
[15]
CoRR abs/1805.10820 (2018), http://arxiv.org/abs/1805.10820
Guidotti, R., Monreale, A., Ruggieri, S., Pedreschi, D., Turini, F., Gian- notti, F.: Local rule-based explanations of black box decision systems. CoRR abs/1805.10820 (2018), http://arxiv.org/abs/1805.10820
2018 arXiv
-
[16]
ACM Comput
Guidotti, R., Monreale, A., Ruggieri, S., Turini, F., Giannotti, F., Pedreschi, D.: A survey of methods for explaining black box models. ACM Comput. Surv. 51(5), 93:1–93:42 (2019).https://doi.org/10.1145/3236009, https://doi.org/ 10.1145/3236009 Locally PO interpretations for ...
2019 doi
-
[17]
Addison-Wesley (1979)
Hopcroft, J.E., Ullman, J.D.: Introduction to Automata Theory, Languages and Computation. Addison-Wesley (1979)
1979
-
[18]
In: Proceedings of the IEEE Congress on Evolution- ary Computation, CEC 2013, Cancun, Mexico, June 20-23, 2013
Johansson, U., König, R., Löfström, T., Boström, H.: Evolved decision trees as conformal predictors. In: Proceedings of the IEEE Congress on Evolution- ary Computation, CEC 2013, Cancun, Mexico, June 20-23, 2013. pp. 1794–1801. IEEE (2013). https://doi.org/10.1109/CEC.2013.655...
2013
-
[19]
Pattern Recognit
Krishnan, R., Sivakumar, G., Bhattacharya, P.: Extracting decision trees from trained neural networks. Pattern Recognit. 32(12), 1999– 2009 (1999). https://doi.org/10.1016/S0031-3203(98)00181-2, https: //doi.org/10.1016/S0031-3203(98)00181-2
1999 doi
-
[20]
In: Binnig, C., Hellerstein, J.M., Parameswaran, A.G
Krishnan, S., Wu, E.: PALM: machine learning explanations for iterative debug- ging. In: Binnig, C., Hellerstein, J.M., Parameswaran, A.G. (eds.) Proceedings of the 2nd Workshop on Human-In-the-Loop Data Analytics, HILDA@SIGMOD 2017, Chicago, IL, USA, May 14, 2017. pp. 4:1–4:6...
2017
-
[21]
Luc, D.T.: Pareto Optimality, pp. 481–515. Springer New York, New York, NY (2008)
2008
-
[22]
In: Guyon, I., von Luxburg, U., Bengio, S., Wallach, H.M., Fer- gus, R., Vishwanathan, S.V.N., Garnett, R
Lundberg, S.M., Lee, S.: A unified approach to interpreting model pre- dictions. In: Guyon, I., von Luxburg, U., Bengio, S., Wallach, H.M., Fer- gus, R., Vishwanathan, S.V.N., Garnett, R. (eds.) Advances in Neural In- formation Processing Systems 30: Annual Conference on Neura...
2017
-
[23]
Markelle Kelly, Rachel Longjohn, K.N.: The UCI Machine Learning Repository, https://archive.ics.uci.edu
-
[24]
UCI Machine Learning Repository (1996), DOI: https://doi.org/10.24432/C5388M
Nakai, K.: Ecoli. UCI Machine Learning Repository (1996), DOI: https://doi.org/10.24432/C5388M
1996 doi
-
[26]
UCI Machine Learning Repository (1991), DOI: https://doi.org/10.24432/C5KG68
Nakai, K.: Yeast. UCI Machine Learning Repository (1991), DOI: https://doi.org/10.24432/C5KG68
1991 doi
-
[27]
UCI Machine Learning Repository (1987), DOI: https://doi.org/10.24432/C5FS30
Quinlan, J.: Credit Approval. UCI Machine Learning Repository (1987), DOI: https://doi.org/10.24432/C5FS30
1987 doi
-
[28]
why should I trust you?
Ribeiro, M.T., Singh, S., Guestrin, C.: "why should I trust you?": Explain- ing the predictions of any classifier. In: Proceedings of the Demonstrations Ses- sion, NAACL HLT 2016, The 2016 Conference of the North American Chapter of the Association for Computational Linguistic...
2016 doi
-
[29]
In: McIlraith, S.A., Weinberger, K.Q
Ribeiro, M.T., Singh, S., Guestrin, C.: Anchors: High-precision model-agnostic ex- planations. In: McIlraith, S.A., Weinberger, K.Q. (eds.) Proceedings of the Thirty- Second AAAI Conference on Artificial Intelligence, (AAAI-18), the 30th innovative Applications of Artificial I...
2018 doi
-
[30]
Cambridge University Press (2014) 22 A
Shalev-Shwartz, S., Ben-David, S.: Understanding Machine Learning - From The- ory to Algorithms. Cambridge University Press (2014) 22 A. Joshi et al
2014
-
[32]
UCI Machine Learning Repository (1976), DOI: https://doi.org/10.24432/C5488X
Siegler, R.: Balance Scale. UCI Machine Learning Repository (1976), DOI: https://doi.org/10.24432/C5488X
1976 doi
-
[33]
Swiechowski,M.,Godlewski,K.,Sawicki,B.,Mandziuk,J.:Montecarlotreesearch: a review of recent modifications and applications. Artif. Intell. Rev.56(3), 2497– 2562 (2023)
2023
-
[34]
In: Feng, L., Fisman, D
Torfah, H., Junges, S., Fremont, D.J., Seshia, S.A.: Formal analysis of ai-based au- tonomy: From modeling to runtime assurance. In: Feng, L., Fisman, D. (eds.) Run- time Verification - 21st International Conference, RV 2021, Virtual Event, October 11-14, 2021, Proceedings. Le...
2021
-
[35]
In: FMCAD
Torfah,H.,Shah,S.,Chakraborty,S.,Akshay,S.,Seshia,S.A.:Synthesizingpareto- optimal interpretations for black-box models. In: FMCAD. pp. 153–162. IEEE (2021)
2021
-
[36]
In: ACML
Wang, W., Sebag, M.: Multi-objective monte-carlo tree search. In: ACML. JMLR Proceedings, vol. 25, pp. 507–522. JMLR.org (2012)
2012
-
[37]
In: Simonis, H
Yu, J., Ignatiev, A., Stuckey, P.J., Bodic, P.L.: Computing optimal decision sets with SAT. In: Simonis, H. (ed.) Principles and Practice of Constraint Programming - 26th International Conference, CP 2020, Louvain-la-Neuve, Belgium, September 7-11, 2020, Proceedings. Lecture N...
2020
-
[38]
In: Williams, B., Chen, Y., Neville, J
Zhang, R., Xin, R., Seltzer, M.I., Rudin, C.: Optimal sparse regression trees. In: Williams, B., Chen, Y., Neville, J. (eds.) Thirty-Seventh AAAI Conference on Artificial Intelligence, AAAI 2023, Thirty-Fifth Conference on Innovative Applica- tions of Artificial Intelligence, ...
2023 doi
-
[39]
Zitzler, E., Thiele, L.: Multiobjective optimization using evolutionary algorithms - Acomparativecasestudy.In:PPSN.LectureNotesinComputerScience,vol.1498, pp. 292–304. Springer (1998) A Verification using Boolean Satisfiability We describe below the construction a boolean form...
1998
-
[330]
Springer (2021).https://doi.org/10.1007/978-3-030-88494-9_19 , https: //doi.org/10.1007/978-3-030-88494-9_19
2021 doi
-
[970]
Springer (2020).https://doi.org/10.1007/978-3-030-58475-7_55 , https: //doi.org/10.1007/978-3-030-58475-7_55
2020 doi
Reviewed August 5, 2026 · model on record in the stance chip above.
Discussion (0). Continue with ORCID to comment.