REVIEW 3 major objections 5 minor 38 references
An optical-lensing inspired data thinning method for nuclear cross section data
T0 review · 3 major / 5 minor · reviewed 2026-08-15 · deepseek-v4-flash
Pith's one-line read A lensing-inspired data-thinning method reduces nuclear datasets while keeping fit quality.
desk verdict The toy validation contradicts the central claim: the method is a plausible heuristic but has not been shown to preserve statistical comparability. read the letter →
The pith
A machine-rendered reading of the paper's core claim, the machinery that carries it, and where it could break.
The reading
What carries the argument
The selection engine is a per-bin likelihood $L_b(y,\sigma_y)=\prod_{p\in\{0,50,100\}} e^{-\frac12((y-y_{p,b})/\sigma_y)^2}$ that scores a candidate measurement in bin $b$ by how well it reproduces the minimum, median, and maximum of the cross-section distribution in the neighbouring bin; the algorithm sets the neighbouring bin to $b+1$ and takes the argmax over all measurements in bin $b$. A second variant replaces the three percentile values with a Gaussian kernel density estimate $K_h(y\mid h,b')$ of the neighbouring bin, and a third uses per-point error bars as kernel bandwidths. This matching rule is what carries the argument: it turns 'keep the informative points' into a concrete optimization that preserves the local distribution shape of the data while discarding redundant measurements.
What would settle it
Run the full Bayesian evaluation on a dataset small enough to be tractable, then lens it with each variant and compare the fitted parameter posteriors to the full-data posteriors; if the lensed posteriors exclude the full-data parameter region, the preservation claim fails. A cheap version already exists in the paper's toy linear model, where the percentile-only variant recovered a slope of $0.98\pm0.31$ instead of the true value $2$.
Extended reading notes
Core claim
The central claim is that bin-local distribution matching is a sufficient data-reduction criterion for later model fitting. Concretely, the algorithm bins the data by energy, computes for each bin a target signature—the min/median/max percentiles, or a kernel density estimate optionally using per-point uncertainties—and for every bin picks the measurement from that bin that best matches the signature of the next bin. Repeating this pass removes one point per bin until the desired subset size is reached. The paper argues that this procedure preferentially keeps points near the average cross-section and discards points inside resonance peaks, and it demonstrates that the lensed subsets, after Bayesian smoothing, support reaction-model fits that agree with fits to the full dataset, at a small fraction of the cost of iterative thinning.
Load-bearing premise
The load-bearing premise is that matching a bin's min/median/max or kernel-density profile to the neighbouring bin preserves the statistical content a later model fit needs; the paper's own toy simulation, in which the percentile-only variant recovered a slope of $0.98\pm0.31$ instead of the true $2$, shows this premise is not automatic.
Editorial extensions
If this is right
- Lensing can serve as a cheap pre-processing step before Bayesian data assimilation, making fits feasible for datasets that would otherwise strain memory and compute budgets.
- For resonance-rich nuclei, the lensing subset deliberately avoids resonance peaks and preserves the average cross-section behaviour that the reaction-model parameters respond to.
- The error-weighted kernel variant carries the measurement uncertainties into the selection, so the thinned subset remains representative when data quality varies sharply across the energy range.
- Runtime for the percentile variant is orders of magnitude below classical thinning: about 0.03 seconds versus 1500 seconds for the tin-124 test case in the paper.
- The selected subset is stable under bootstrap resampling, giving analysts a practical route to uncertainty estimates on the thinned data.
Reading between the lines
- Inference: because the algorithm preserves local distribution shape rather than extremes, it is best suited to model calibration against average behaviour; analyses whose scientific target is the resonances themselves should check whether lensing removes the signal they need.
- Inference: the same bin-to-neighbour distribution matching could transfer to any binned physical dataset whose assimilation cost scales steeply with size, such as opacity tables or equation-of-state point sets.
- Inference: a decisive diagnostic is to compare lensed-subset fits with fits on equal-sized random subsets; if random selection performs as well, the method's advantage is purely computational, while if lensing wins, the distribution-matching criterion is doing genuine statistical work.
Signed reviews
Editorial analysis
A structured set of objections, weighed in public.
Referee Report
Summary. The paper proposes a data-thinning method for nuclear cross-section datasets, inspired by optical lensing. The method bins the data in energy, characterizes each bin's cross-section distribution by percentiles or by a kernel density estimate, and then selects, from each bin, the measurement most similar to the neighboring bin's distribution. This selected subset is intended to be used as a pre-processing step before Bayesian assimilation methods such as FBET and before optical-model fitting with CoH3. The authors validate the method on a simulated linear model with known slope and intercept and on total cross-section data for neutron-induced reactions on 124Sn, 144Sm, 143Nd, and 150Nd, reporting speedups relative to a classical thinning method. The central claim, stated in the abstract and conclusion, is that the lensing procedure preserves critical information and yields a representative subset with statistically comparable outcomes.
Significance. If the central claim were valid, the method would be a practically useful pre-processing tool for nuclear data evaluation, where dense, correlated datasets make full Bayesian assimilation expensive. The lensing idea is intuitive, and the reported computational speedups over the classical thinning baseline are substantial. The paper provides a machine-readable presentation of the algorithm and a transparent toy experiment. However, the toy experiment is the only quantitative test against a known truth, and its results contradict the central claim: the fitted intercepts differ significantly from the true value for all three lensing variants, and the percentile-based slope also differs significantly. The bootstrap-based checks reported in the paper are self-referential and cannot detect systematic selection bias. The real-data section is qualitative and therefore cannot repair this defect. Because the main claim is not supported by the paper's own validation, the significance of the contribution as presented is not established.
major comments (3)
- [Section IV, Table I] The quantitative test against the known linear truth y = 2x + 2 shows statistically significant deviations for all three lensing variants: the percentile-based intercept is 2.62 ± 0.16 (t = 3.85, P = 0.01) and its slope is 0.98 ± 0.31 (t = 3.33, P = 0.02); the KDE and KDEσ intercepts are 2.20 ± 0.05 (P = 0.01) and 2.21 ± 0.06 (P = 0.01), respectively. These results directly contradict the claim in Section VI that the method 'allows analysts to work with a representative subset that yields statistically comparable outcomes.' The deviations are all in the same direction (positive intercept bias), suggesting a systematic effect of the selection rule, not mere sampling noise.
- [Section IV, Chow F-test paragraph] The Chow F-test and bootstrap distributions compare the lensed dataset only with resamples of itself, not with the full simulated dataset or with the known generating model. A biased selection rule can be perfectly self-consistent under bootstrap resampling while still destroying the statistical content of the original data. The sentence 'The method therefore gives reliable results for all three lensing variants' therefore does not follow from the reported test. The correct comparison, already available in Table I through the t-tests against the true parameters, shows the opposite conclusion, and the paper's discussion omits this discrepancy.
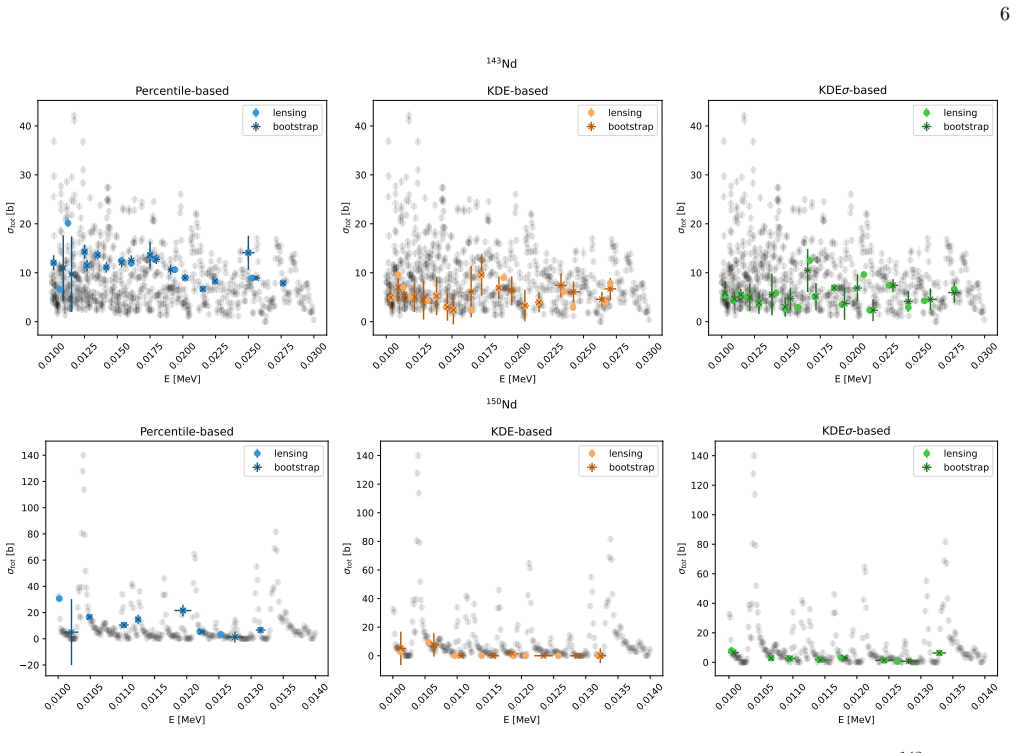
- [Section V, Figs. 5 and 6] The real-data application is purely qualitative. Figures 5 and 6 show lensed and thinned fits overlaid on FBET-smoothed full-data expectations, but no quantitative metric is reported: there is no fitted parameter table, no chi-square for the lensed-data fits versus the full-data fit, and no comparison of uncertainty bands. The text asserts closer agreement of the lensing approach with the FBET-smoothed expectations, but this is a visual impression. A quantitative comparison on at least one nucleus, e.g., n+124Sn, would be needed to substantiate the claim that the reduced subset preserves the statistical content of the full dataset for model fitting.
minor comments (5)
- [Section II.B, Eq. (3)] In the definition of the KDE, the Gaussian is written as exp(-(y - y_i)^2 / 2h^2) while the sum runs over x_j in the bin; the kernel should be a function of the cross-section values y_j, so the notation appears to contain a typo (y_i should be y_j).
- [References [20] and [21]] References [20] and [21] are the same publication (Ochotta et al., Quarterly Journal of the Royal Meteorological Society 131, 3427 (2005)) but are cited as if they were distinct works; this duplication should be corrected.
- [Section IV, prediction intervals] The prediction intervals are described as sqrt(N_s + 1) times the estimated parameter error and sqrt(N_B + 1) times the lensed-subsample parameter error, but the derivation or citation for this particular scaling is not given; the reader cannot verify that these intervals have the claimed coverage.
- [Section V, Figs. 3 and 4] The figures comparing lensed subsets and bootstrap estimates would be easier to interpret if the number of retained points per bin were stated explicitly, since the claimed reduction ratio is central to the method's motivation.
- [References [37] and [38]] References [37] and [38] list only the author and 'in prep.' without titles or dates; if these are intended to support the claim of follow-up work, more bibliographic information should be provided.
Circularity Check
No significant circularity: the lensing selection rule is a constructed heuristic, and the toy validation is checked against an independent simulated truth.
full rationale
The derivation chain is self-contained. Section II defines the lensing selection likelihood and the argmax rule (Eqs. 1-4) without invoking the later claims of information preservation or statistical comparability; the method is a constructed preprocessing heuristic, not a derived result whose output equals an input by construction. The central validation in Section IV is against an independent simulated linear model y = 2x + 2 (Eq. 22), with t-statistics evaluated against those known truth values, so the fitted slope and intercept are not renamed predictions of the method. The bootstrap and Chow F checks in Sections III C and IV are internal consistency checks comparing a lensed subset to resamples of itself, and the paper explicitly cautions that 'these bootstrap estimates are not actual measurements, and both the bootstrap and smoothed bootstrap fits should be regarded as purely illustrative'; this is a limitation of the validation, not a circularity in the derivation. The real-data fits in Section V are qualitative demonstrations against the lensed subsets, not derived quantities used as inputs, and the paper notes that a comprehensive multi-channel evaluation is deferred. Self-citations appear only as background references ([4]) or as announced follow-up work ([37], [38]) and carry no load-bearing argument in this paper. No fitted constant, self-citation chain, or imported uniqueness theorem forces the paper's claimed outcome, so no circular step can be exhibited with the required specificity.
Assumptions & free parameters
free parameters (3)
- KDE bandwidth h
- Number of energy bins Nb
- Number of retained points per bin
assumptions (3)
- domain assumption The FBET linearized Bayesian update (Eqs. 8-9) yields a valid posterior mean and covariance A1.
- domain assumption The Koning-Delaroche optical potential with six multiplicative tweaks is an adequate model for the total cross section fits.
- domain assumption The kernel regression estimator used in the classical thinning method is an appropriate information criterion for comparison.
Cite this review
Pith. "Pith review of An optical-lensing inspired data thinning method for nuclear cross section data." pith.science (2026). https://pith.science/paper/WEBEIOEI
@misc{pith2026250819470,
  author       = {Pith},
  title        = {Pith review of: An optical-lensing inspired data thinning method for nuclear cross section data},
  year         = {2026},
  howpublished = {\url{https://pith.science/paper/WEBEIOEI}},
  note         = {Machine review of arXiv:2508.19470}
}
read the original abstract
In the study of nuclear cross sections, the computational demands of data assimilation methods can become prohibitive when dealing with large data sets. We have developed a novel variant of the data thinning algorithm, inspired by the principles of optical lensing, which effectively reduces data volume while preserving critical information. We show how it improves fitting through a toy problem and for several examples of total cross sections for neutron-induced reactions on rare-earth isotopes. We demonstrate how this method can be applied as an efficient pre-processing step prior to smoothing, significantly improving computational efficiency without compromising the quality of uncertainty quantification.
Figures


Figures from the paper (3 more)


Reference graph
Works this paper leans on
-
[20]
An optical-lensing inspired data thinning method for nuclear cross section data
or iteratively applying a selected statistic [21]. We have developed a data thinning algorithm inspired by optical lensing to improve the analysis of cross section data in the region with pronounced resonances. The data for many nuclei below∼ 1 MeV is abundant, but due to finite-energy sampling, it can often be hard to attribute a data point to a resonanc...
work page Pith review arXiv 2025
-
[21]
C. Cardinali, Observation influence diagnostic of a data assimilation system, in Data Assimilation for Atmo- spheric, Oceanic and Hydrologic Applications (Vol. II) , edited by S. K. Park and L. Xu (Springer Berlin Heidel- berg, Berlin, Heidelberg, 2013) pp. 89–110
work page 2013
-
[1]
M. B. Chadwick et al. , Nuclear Data Sheets 112, 2887 (2011)
work page 2011
-
[2]
J. E. Escher, J. T. Burke, F. S. Dietrich, N. D. Sci- elzo, I. J. Thompson, and W. Younes, Reviews of Modern Physics 84, 353 (2012)
work page 2012
- [3]
-
[4]
M. R. Mumpower, R. Surman, G. C. McLaughlin, and A. Aprahamian, Progress in Particle and Nuclear Physics 86, 86 (2016)
work page 2016
-
[5]
K. Langanke and G. Mart´ ınez-Pinedo, Reviews of Mod- ern Physics 75, 819 (2003)
work page 2003
- [6]
Show all 38 references
-
[7]
Herman, R
M. Herman, R. Capote, M. Sin, A. Trkov, B. Carl- son, P. Obloˇ zinsk´ y, C. Mattoon, H. Wienke, S. Hoblit, Y. Cho, G. Nobre, V. Plujko, and V. Zerkin, Indc(nds)- 0603, International Atomic Energy Agency (2013)
2013
-
[8]
A. J. Koning and D. Rochman, Nuclear Data Sheets 113, 2841 (2012)
2012
-
[9]
Iwamoto, Journal of Nuclear Science and Technology 44, 687 (2007)
O. Iwamoto, Journal of Nuclear Science and Technology 44, 687 (2007)
2007
-
[10]
Kawano, P
T. Kawano, P. Talou, M. B. Chadwick, and T. Watan- abe, Journal of Nuclear Science and Technology 47, 462 (2010)
2010
-
[11]
Kawano, arXiv e-prints , arXiv:1901.05641 (2019), arXiv:1901.05641 [nucl-th]
T. Kawano, arXiv e-prints , arXiv:1901.05641 (2019), arXiv:1901.05641 [nucl-th]
2019 arXiv
-
[12]
The well-known problem in such data aggre- gation is that it neglects experimental correlations, such as those between experiments [13]
database is often used to aggregate data of multiple nuclear reaction data, which includes cross section ex- periments. The well-known problem in such data aggre- gation is that it neglects experimental correlations, such as those between experiments [13]. To account for this,...
-
[13]
Neudecker, P
D. Neudecker, P. Talou, T. Kawano, and F. Tovesson, Nuclear Data Sheets 118, 353 (2014)
2014
-
[14]
Otuka, E
N. Otuka, E. Dupont, V. Semkova, B. Pritychenko, A. I. Blokhin, M. Aikawa, S. Babykina, M. Bossant, G. Chen, S. Dunaeva, R. A. Forrest, T. Fukahori, N. Fu- rutachi, S. Ganesan, Z. Ge, O. O. Gritzay, M. Herman, S. Hlavaˇ c, K. Kat¯ o, B. Lalremruata, Y. O. Lee, A. Mak- inaga, K...
2014 arXiv
-
[15]
H. Leeb, S. Gundacker, D. Neudecker, T. Srdinko, and V. Wildpaner, Journal of Korean Physical Society 59, 959 (2011)
2011
-
[16]
H. Leeb, D. Neudecker, and T. Srdinko, Nuclear Data Sheets 109, 2762 (2008)
2008
-
[17]
L. M. Stewart, S. L. Dance, and N. K. Nichols, Tellus A: Dynamic Meteorology and Oceanography 65, 19546 (2013)
2013
-
[18]
Neudecker, R
D. Neudecker, R. Capote, and H. Leeb, Nuclear Instru- ments and Methods in Physics Research A 723, 163 (2013)
2013
-
[19]
Cheng, J.-P
S. Cheng, J.-P. Argaud, B. Iooss, D. Lucor, and A. Pon¸ cot, Stochastic Environmental Research and Risk Assessment 33, 2033 (2019)
2019
-
[23]
Ochotta, C
T. Ochotta, C. Gebhardt, D. Saupe, and W. Wergen, Quarterly Journal of the Royal Meteorological Society 131, 3427 (2005)
2005
-
[24]
A. J. Koning and J. P. Delaroche, Nuclear Physics A713, 231 (2003)
2003
-
[25]
D. W. Marquardt, Journal of the society for Industrial and Applied Mathematics 11, 431 (1963)
1963
-
[26]
Levenberg, Quarterly of Applied Mathematics 2, 164 (1944)
K. Levenberg, Quarterly of Applied Mathematics 2, 164 (1944)
1944
-
[27]
Efron, Annals of Statistics 7, 1 (1979)
B. Efron, Annals of Statistics 7, 1 (1979)
1979
-
[28]
G. C. Chow, Econometrica 28, 591 (1960)
1960
-
[29]
R. F. Carlton, J. A. Harvey, and N. W. Hill, Phys. Rev. C 54, 2445 (1996)
1996
-
[30]
R. W. Harper, T. W. Godfrey, and J. L. Weil, Phys. Rev. C 26, 1432 (1982)
1982
-
[31]
Musaelyan, V
R. Musaelyan, V. Skorkin, I. Surkova, N. Sklyar, V. Ovdi- enko, M. Fedorov, and T. Yakovenko, Yad.Fiz.50 (1989)
1989
-
[32]
C. D. Pruitt, R. J. Charity, L. G. Sobotka, J. M. Elson, D. E. M. Hoff, K. W. Brown, M. C. Atkin- son, W. H. Dickhoff, H. Y. Lee, M. Devlin, N. Foti- ades, and S. Mosby, Phys. Rev. C 102, 034601 (2020), arXiv:2006.00024 [nucl-ex]
2020 arXiv
-
[33]
Rapaport, M
J. Rapaport, M. Mirzaa, H. Hadizadeh, D. E. Bainum, and R. W. Finlay, Nuclear Physics A 341, 56 (1980)
1980
-
[34]
Y. V. Dukarevich, A. N. Dyumin, and D. M. Kaminker, Nuclear Physics A 92, 433 (1967)
1967
-
[35]
R. L. Macklin, N. W. Hill, J. A. Harvey, and G. L. Tweed, Phys. Rev. C 48, 1120 (1993)
1993
-
[36]
A. N. Dyumin, A. I. Egorov, G. N. Popova, and V. A. Smolin, Bulletin of the Russian Academy of Sciences: Physics 37, 91 (1973)
1973
-
[37]
Tellier, Properties of levels induced in stable isotopes of neodymium by neutrons in the resonance region , Tech- nical Report Note No
H. Tellier, Properties of levels induced in stable isotopes of neodymium by neutrons in the resonance region , Tech- nical Report Note No. 1459 (Centre d’´Etudes Nucl´ eaires, 1971)
1971
-
[38]
Wisshak, F
K. Wisshak, F. Voss, F. K¨ appeler, L. Kazakov, and G. Reffo, Phys. Rev. C 57, 391 (1998)
1998
-
[40]
Imbriˇ sak (), in prep
M. Imbriˇ sak (), in prep
Reviewed August 15, 2026 · model on record in the stance chip above.
Discussion (0). Continue with ORCID to comment.