REVIEW 3 major objections 5 minor 78 references
TRAPPIST-1 b is most likely airless, but 3D climate modeling shows several atmospheres — thin residual gas, hazy thermal inversions — produce the same bright 15-micron dayside, so a single eclipse point cannot settle whether an atmosphere e
Reviewed by Pith at T0; open to challenge. T0 means a machine referee read the full paper against a public rubric. the ladder, T0–T4 →
Airless, thin residual, and hazy-inversion atmospheres all match TRAPPIST-1 b's eclipse and phase curve data, so a single 15 µm eclipse depth is not enough to conclude a planet is airless.
T0 review reviewed 2026-08-05 challenge →
load-bearing objection The paper's central warning—don't infer an airless rocky planet from a single 15-µm eclipse depth—survives scrutiny, and the 3D modeling alone is worth the read. the 3 major comments →
Constraints on the possible atmospheres on TRAPPIST-1 b: insights from 3D climate modeling
The pith
A machine-rendered reading of the paper's core claim, the machinery that carries it, and where it could break.
The reading
Core claim
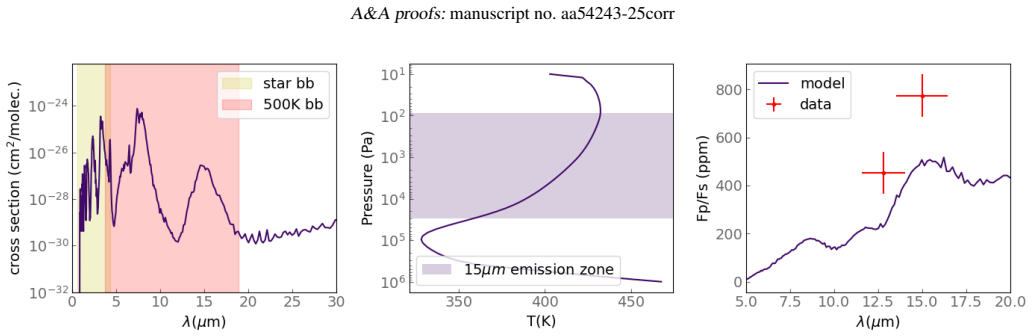
The paper's central claim: all JWST emission data on TRAPPIST-1 b — 12.8 and 15 µm eclipse depths plus a 15 µm phase curve — are consistent with an airless planet, the most likely scenario; a thin CO2-poor residual atmosphere is the leading alternative. Four families of atmospheres reproduce the bright dayside: thin bare-rock-like ones, thick transparent ones, reduced greenhouse atmospheres with opacity windows at the observed wavelengths, and thermal-inversion atmospheres where CO2 emits. 3D modeling adds effects 1D cannot see: pure-CO2 atmospheres at 0.1 bar or less collapse into the nightside cold trap within a decade, and the high layers probed at 15 µm redistribute heat poorly even in h
What carries the argument
The central object is the Generic Planetary Climate Model, a 3D global climate model with correlated-k radiative transfer and an active CO2 condensation scheme, post-processed by the Pytmosph3R tool into synthetic eclipse spectra and 15 µm phase curves. It carries the argument because heat redistribution is emergent, not assumed: the model self-consistently produces the nightside cold trap that collapses thin pure-CO2 atmospheres, and the inefficient high-altitude redistribution that lets hazy atmospheres keep a hot dayside and cold nightside. The 1D exo_k model is the fast screening stage that maps the composition-pressure space before the 3D stage.
Load-bearing premise
The argument depends on the model's prediction that pure CO2 atmospheres of about 0.1 bar or less freeze out completely onto the cold nightside within a decade; if real turbulence, internal heat, or orbital motion keeps the nightside warmer, thin CO2 atmospheres would remain compatible with the observations.
What would settle it
Measure the 10 µm secondary eclipse of TRAPPIST-1 b. The bare-rock and hazy CO2-emission models diverge most at this wavelength, and the paper's sensitivity calculation says roughly two JWST visits would separate them; eight visits at 18 µm would also work. A 10 µm depth matching the hazy model would overturn the airless-most-likely conclusion; one matching bare rock would confirm it.
If this is right
- Thin pure-CO2 atmospheres (about 0.1 bar or less) are not viable on TRAPPIST-1 b: they freeze out onto the nightside within roughly a decade, so any surviving CO2-dominated atmosphere must be thick or stabilized by other heating.
- The 15 µm phase curve discriminates where eclipse depth cannot: thick, heat-redistributing atmospheres (reduced N2-CH4-C2H4 and thick transparent cases) are ruled out by their flat phase curves.
- After all available emission data, the viable set shrinks to an airless planet, a thin CO2-poor residual atmosphere, and a fine-tuned hazy thermal-inversion atmosphere.
- The same eclipse-then-phase-curve methodology and the same degeneracy of a single high 15 µm eclipse depth apply to other temperate rocky exoplanets observed in emission with JWST.
- Two JWST visits at 10 µm could, by the paper's sensitivity estimates, separate the bare-rock scenario from the hazy CO2-emission scenario.
Where Pith is reading between the lines
- The collapse threshold is the natural target for model intercomparison: if another GCM's nightside cold trap is warmer because of different turbulent-mixing or surface parameterizations, thin CO2 atmospheres re-enter the viable set, and the 'most likely airless' conclusion weakens.
- The paper's single-photometric-point warning extends to the wider JWST rocky-planet eclipse surveys: targets flagged as airless from one eclipse may need phase-curve or multi-wavelength follow-up before being used as clean reference bodies for stellar-contamination correction.
- Only idealized hazes with tuned scattering properties match the data; realistic tholin, sulfate, and dust optics do not. Laboratory or microphysical constraints on high-altitude haze optical properties around cool M dwarfs could settle whether the hazy scenario is physically plausible.
- A joint fit of planets b and c in the observed phase curve — noted by the authors as the cleaner but out-of-scope approach — could sharpen the extraction of b's nightside emission and further separate the surviving scenarios.
Editorial analysis
A structured set of objections, weighed in public.
Referee Report
Summary. This manuscript uses 1D radiative-convective (exo_k) and 3D Generic PCM simulations to explore which atmospheres on TRAPPIST-1 b can match the JWST secondary-eclipse depths at 12.8 and 15 µm (Greene et al. 2023; Ducrot et al. 2024) and the 15 µm thermal phase curve (Gillon et al. 2025). The authors identify four families that can yield a bright 15 µm dayside: thin residual N2-CO2 atmospheres, thick transparent atmospheres, thick greenhouse-efficient atmospheres with an opacity window near 12.8/15 µm, and atmospheres with a strong thermal inversion (CH4+CO2, idealized hazes, or dust/tholins). After computing synthetic eclipse spectra and phase curves and comparing them with a relative chi-square metric (Sect. 2.4), they find that the airless model and several atmospheric models remain compatible with all the available data. The paper concludes that the observations are consistent with an airless planet, with a thin CO2-poor residual atmosphere as the main alternative, and that a single 15 µm eclipse depth cannot be used to infer airlessness.
Significance. The central conclusion is important: it provides a quantitative demonstration that JWST emission photometry of TRAPPIST-1 b, including the phase curve, is degenerate between airless, thin-residual, and fine-tuned hazy/inverted atmospheres. This is a valuable warning for the many upcoming JWST programs targeting rocky exoplanets in emission. The paper's strengths are the broad N2-CO2 pressure/mixing-ratio grid (Table 1, Fig. 5), explicit 3D treatment of heat redistribution in the upper atmosphere, GCM simulations of CO2 cold-trap collapse (Fig. 7, Appendix A.2), an honest discussion of model limitations (Sect. 4), and concrete, falsifiable predictions for future 10 and 18 µm observations (Fig. 14) and transit spectra (Appendix D). The non-uniqueness conclusion does not depend on the collapse prediction: the thin N2+1 ppm CO2 and N2+0.1 ppm CO2 cases already match the eclipse and phase-curve points in Table 1. However, the quantitative ranking of the remaining scenarios ("most likely airless") is not supported by the relative chi-square metric used.
major comments (3)
- [§2.4, Eq. (2), Table 1] The paper states that the chi-square is only a relative metric and "cannot provide an absolute quantification of the mismatch" (Sect. 2.4), yet Table 1 labels all entries as reduced chi-square, including values below 1 (e.g., CO2+Hazes Model 1, chi2_joint = 0.4), and Sect. 3.3.3 calls Model 1 "the best agreement". Because the two haze parameters of Model 1 are tuned to the same eclipse/phase-curve data and no degrees-of-freedom or model-covariance treatment is given, these numbers cannot support the "most likely airless" ranking in the abstract and conclusion. The qualitative degeneracy remains, but the ranking needs to be either replaced by a proper model comparison or removed and presented as a prior-based or qualitative preference.
- [§3.3.2, §4.1, Appendix C.1] The haze-inversion models that pass all data are the least physical: Model 1 mimics a single-scattering albedo of 0.5 by arbitrarily reducing the stellar flux by a factor 2, and Model 2 uses a haze factor two orders of magnitude below the value previously advocated (Sect. 3.3.2). Appendix C.1 shows that realistic aerosol optical properties (tholins, H2SO4, martian dust) do not produce a CO2 emission band and that the simplified-haze case is fine-tuned. Since the abstract lists "CO2 atmospheres rich in hazes" alongside the other families without these caveats, the paper should explicitly distinguish proof-of-concept/idealized models from physically self-consistent models in the abstract and conclusion. The caveats in Sect. 4.1 are not carried through to the paper's headline statements.
- [§3.1.6, Table 1, Appendix A.2] Models flagged with asterisks in Table 1 are time-dependent collapsing states, but they are assigned chi-square values on the same footing as stable equilibrium models. For example, N2+100 ppm CO2 at 0.01 bar has chi2_joint = 1.7 and is listed as collapsing; its observables are snapshots during an ongoing collapse, not a stationary state. The conclusion that collapse "allowed us to rule out some atmospheres" (Sect. 5) is also in tension with the statement that the data-compatible thin CO2-poor atmospheres are the end products of partial collapse (Sect. 3.1.6). The text should clarify whether collapse is used as a dynamical selection criterion or as a formation mechanism. This clarification matters, but it would not overturn the degeneracy claim: if the collapse were overestimated, additional thin CO2-bearing models would remain viable, strengthening the paper's main warning.
minor comments (5)
- [Table 2] The unit for the planetary radius is given as "1.116 (M⊕)"; it should be "1.116 (R⊕)".
- [Table 3 / §2.1.3] The N2+CO2 k-tables are from "Chaverot et al. in prep." and the phase-curve data are from Gillon et al. (2025), "under review". For reproducibility, provide public access to the opacity tables and phase-curve data products (or an updated reference) before publication.
- [§2.4] The phrase "the most likely scenario" in the abstract is not derivable from the relative chi-square comparison alone; if retained, it should be explicitly qualified as a prior-based or qualitative assessment.
- [§3.1.6 / §3.1.7] The discussion of tidal heat flux (Table 4) is clear, but the text should state whether the quoted internal flux range (4e-2 to 500 W/m2) is used in any of the GCM simulations or only as a post hoc stability argument. It appears to be the latter.
- [Appendix C.2] The non-convergence of the deep atmosphere in the 3D dust simulation is honestly disclosed; consider adding a convergence criterion or a statement that the upper-atmosphere emission layers are converged to within the quoted precision.
Circularity Check
No significant circularity; the degeneracy conclusion rests on independent forward models.
full rationale
This paper is a forward-model exploration, not a derivation. The central claim—that a single 15 µm eclipse depth is degenerate—is established by Table 1 and Fig. 5: thin N2+CO2 atmospheres (e.g., N2+0.1 ppm CO2 at 1 bar, N2+1 ppm CO2 at 0.1 bar) and the airless model all achieve reduced χ2 < 2 for eclipse and phase-curve data without any parameter fit to the eclipse depths. These are independent realizations from the Generic PCM/exo_k with stated opacities and boundary conditions. The CO2 collapse result (Sect. 3.1.6) is a GCM prediction, not an input, and it is not used to remove data-compatible models; pure-CO2 0.1 bar is already excluded by the eclipse data itself (χ2_eclipse = 17 in Table 1). The hazy-inversion models (Model 1 and 2) are explicitly fit to the observations and called 'fine-tuned' (Sect. 3.3.3); they are presented as existence proofs of a possible, though unlikely, scenario, not as predictions, so no fitted value is relabeled as a prediction. Citations to Ducrot et al. (2024) for the simplified haze prescription and to Gillon et al. (2025) for phase-curve data are not load-bearing for the main degeneracy conclusion, which survives even if all haze models were discarded. The paper's own acknowledged limitations (non-converged dust GCM, relative χ2, idealized hazes) affect the ranking of scenarios, but not the qualitative non-uniqueness. No step in the derivation chain reduces by definition to its inputs.
Axiom & Free-Parameter Ledger
free parameters (5)
- Haze factor f_haze (simplified haze model) =
7e-4 (Model 1), 3e-5 (Model 2)
- Single-scattering albedo of simplified hazes =
0.5 (Model 1), 0.2 (Model 2)
- Surface albedo =
0.1 (GCM bare ground), 0.2 (airless reference)
- Aerosol layer parameters (VMR, pressure bounds, radii) for dust/tholins =
Dust VMR 3.5e-18, tholins VMR 1e-13, pressure layers and radii as in Section 3.3.2
- exo_k albedo cutoff wavelength =
5 µm
axioms (4)
- domain assumption TRAPPIST-1 b is in a circular, tidally locked orbit with zero obliquity and synchronous rotation.
- domain assumption The Generic PCM and exo_k with the used correlated-k tables accurately compute radiative transfer and climate for these atmospheres.
- domain assumption The selected phase-curve extraction (analysis #1-MG of Gillon et al. 2025) is a valid representation of TRAPPIST-1 b's phase curve.
- domain assumption No internal heat flux in nominal simulations.
Cite this review
Pith. "Pith review of Constraints on the possible atmospheres on TRAPPIST-1 b: insights from 3D climate modeling." pith.science (2026). https://pith.science/paper/QYXDNODM
@misc{pith2026250902120,
  author       = {Pith},
  title        = {Pith review of: Constraints on the possible atmospheres on TRAPPIST-1 b: insights from 3D climate modeling},
  year         = {2026},
  howpublished = {\url{https://pith.science/paper/QYXDNODM}},
  note         = {Machine review of arXiv:2509.02120}
}
read the original abstract
JWST observations of the secondary eclipse of TRAPPIST-1 b at 12.8 and 15 microns revealed a very bright dayside. These measurements are consistent with an absence of atmosphere. Previous 1D atmospheric modeling also excludes -- at first sight -- CO2-rich atmospheres. However, only a subset of the possible atmosphere types has been explored and ruled out to date. Recently, a full thermal phase curve of the planet at 15 microns with JWST has also been observed, allowing for more information on the thermal structure of the planet. We first looked for atmospheres capable of producing a dayside emission compatible with secondary eclipse observations. We then tried to determine which of these are compatible with the observed thermal phase curve. We used a 1D radiative-convective model and a 3D global climate model (GCM) to simulate a wide range of atmospheric compositions and surface pressures. We then produced observables from these simulations and compared them to available emission observations. We found several families of atmospheres compatible at 2-sigma with the eclipse observations. Among them, some feature a flat phase curve and can be ruled out with the observation, and some produce a phase curve still compatible with the data (i.e., thin N2-CO2 atmospheres, and CO2 atmospheres rich in hazes). We also highlight different 3D effects that could not be predicted from 1D studies (redistribution efficiency, atmospheric collapse). The available observations of TRAPPIST-1 b are consistent with an airless planet, which is the most likely scenario. A second possibility is a thin CO2-poor residual atmosphere. However, our study shows that different atmospheric scenarios can result in a high eclipse depth at 15 microns. It may therefore be hazardous, in general, to conclude on the presence of an atmosphere from a single photometric point.
Figures




Reference graph
Works this paper leans on
- [1]
- [2]
-
[3]
Banerjee, A., Barstow, J. K., Gressier, A., et al. 2024, , 975, L11
work page 2024
-
[4]
Barclay , T., Pepper , J., & Quintana , E. V. 2018, , 239, 2
work page 2018
-
[5]
Bolmont , E., Libert , A.-S., Leconte , J., & Selsis , F. 2016, , 591, A106
work page 2016
- [6]
- [7]
-
[8]
Burch, D. E., Gryvnak, D. A., Patty, R. R., & Bartky, C. E. 1969, J. Opt. Soc. Am. (1917-1983), 59, 267
work page 1969
-
[9]
Charnay , B., Blain , D., B \'e zard , B., et al. 2021, , 646, A171
work page 2021
- [10]
-
[11]
Chen , H., Li , G., Paradise , A., & Kopparapu , R. K. 2023, , 946, L32
work page 2023
-
[12]
, Rocchetto, Marco , Yurchenko, Sergei N
Chubb, Katy L. , Rocchetto, Marco , Yurchenko, Sergei N. , et al. 2021, , 646, A21
work page 2021
-
[13]
Coleman , G. A. L., Leleu , A., Alibert , Y., & Benz , W. 2019, , 631, A7
work page 2019
- [14]
- [15]
- [16]
- [17]
-
[18]
Falco , A., Zingales , T., Pluriel , W., & Leconte , J. 2022, , 658, A41
work page 2022
-
[19]
Fauchez , T. J., Rackham , B. V., Ducrot , E., Stevenson , K. B., & de Wit , J. 2025, arXiv e-prints, arXiv:2502.19585
Pith/arXiv arXiv 2025
-
[20]
J., Turbet , M., Villanueva , G
Fauchez , T. J., Turbet , M., Villanueva , G. L., et al. 2019, , 887, 194
work page 2019
-
[21]
Forget , F., Hourdin , F., Fournier , R., et al. 1999, , 104, 24155
work page 1999
- [22]
- [23]
- [24]
- [25]
- [26]
- [27]
-
[28]
Gillon , M., Triaud , A. H. M. J., Demory , B.-O., et al. 2017, , 542, 456
work page 2017
- [29]
- [30]
- [31]
-
[32]
Hammond , M., Guimond , C. M., Lichtenberg , T., et al. 2025, , 978, L40
work page 2025
- [33]
- [34]
-
[35]
1981, , 99, 126
Hut , P. 1981, , 99, 126
1981
-
[36]
Ih , J., Kempton , E. M. R., Whittaker , E. A., & Lessard , M. 2023, , 952, L4
work page 2023
-
[37]
Iyer , A. R., Line , M. R., Muirhead , P. S., Fortney , J. J., & Gharib-Nezhad , E. 2023, , 944, 41
work page 2023
-
[38]
Joshi , M. M., Elvidge , A. D., Wordsworth , R., & Sergeev , D. 2020, , 892, L33
work page 2020
-
[39]
E., van der Avoird , A., et al
Karman , T., Gordon , I. E., van der Avoird , A., et al. 2019, , 328, 160
work page 2019
-
[40]
Khare , B. N., Sagan , C., Arakawa , E. T., et al. 1984, , 60, 127
work page 1984
-
[41]
Kite , E. S. & Barnett , M. N. 2020, Proc. Nat. Ac. Sci., 117, 18264
work page 2020
-
[42]
Koll , D. D. B. 2022, , 924, 134
work page 2022
- [43]
-
[44]
Krissansen-Totton, J., Olson, S., & Catling, D. C. 2018, Science Advances, 4, eaao5747
work page 2018
- [45]
- [46]
-
[47]
Lund Myhre, C. E., Christensen, D. H., Nicolaisen, F. M., & Nielsen, C. J. 2003, The J. Phys. Chem., 107, 1979
work page 2003
-
[48]
Lustig-Yaeger , J., Meadows , V. S., & Lincowski , A. P. 2019, , 158, 27
work page 2019
- [49]
-
[50]
P., Yachmenev, A., Tennyson, J., & Yurchenko, S
Mant, B. P., Yachmenev, A., Tennyson, J., & Yurchenko, S. N. 2018, , 478, 3220
work page 2018
- [51]
- [52]
-
[53]
Perrin, M. Y. & Hartmann, J. M. 1989, J. Quant. Spectrosc. Rad. Transf., 42, 311
work page 1989
-
[54]
V., Apai , D., & Giampapa , M
Rackham , B. V., Apai , D., & Giampapa , M. S. 2018, , 853, 122
2018
-
[55]
Revol, A., Émeline Bolmont, Sastre, M., et al. 2024,
work page 2024
-
[56]
Selsis , F., Leconte , J., Turbet , M., Chaverot , G., & Bolmont , E. 2023, , 620, 287–291
work page 2023
-
[57]
Shakespeare, C. J. & Steffen, J. H. 2023, Day 'N' Nite: Habitability of Tidally Locked Planets with Sporadic Rotation
work page 2023
-
[58]
Soto , A., Mischna , M., Schneider , T., Lee , C., & Richardson , M. 2015, , 250, 553
work page 2015
-
[59]
W., Winn , J
Sullivan , P. W., Winn , J. N., Berta-Thompson , Z. K., et al. 2015, , 809, 77
2015
-
[60]
Teinturier , L., Charnay , B., Spiga , A., et al. 2024, , 683, A231
work page 2024
-
[61]
Tran, H., Boulet, C., Stefani, S., Snels, M., & Piccioni, G. 2011, J. Quant. Spectrosc. Rad. Transf., 112, 925
work page 2011
-
[62]
M., Rambinison , E., & Turbet , M
Tran , H., Hartmann , J. M., Rambinison , E., & Turbet , M. 2024, , 422, 116265
work page 2024
- [63]
-
[64]
Triaud , A. H. M. J. 2021, in ExoFrontiers; Big Questions in Exoplanetary Science, ed. N. Madhusudhan (IOP Publishing), 6--1
work page 2021
-
[65]
2018, Theses, Sorbonne Universit \'e / Universit \'e Pierre et Marie Curie - Paris VI
Turbet, M. 2018, Theses, Sorbonne Universit \'e / Universit \'e Pierre et Marie Curie - Paris VI
work page 2018
-
[66]
Turbet , M., Bolmont , E., Bourrier , V., et al. 2020 a , , 216, 100
work page 2020
- [67]
-
[68]
Turbet , M., Boulet , C., & Karman , T. 2020 b , , 346, 113762
work page 2020
-
[69]
Turbet , M., Fauchez , T. J., Leconte , J., et al. 2023, , 679, A126
work page 2023
-
[70]
Turbet , M., Forget , F., Leconte , J., Charnay , B., & Tobie , G. 2017, Earth Plan. Sci. Let., 476, 11
work page 2017
-
[71]
Vinson, A. M., Tamayo, D., & Hansen, B. M. S. 2019, 488, 5739
work page 2019
- [72]
-
[73]
D., Forget , F., Selsis , F., et al
Wordsworth , R. D., Forget , F., Selsis , F., et al. 2011, , 733, L48
work page 2011
-
[74]
D., Kerber , L., Pierrehumbert , R
Wordsworth , R. D., Kerber , L., Pierrehumbert , R. T., Forget , F., & Head , J. W. 2015, (Planets), 120, 1201
work page 2015
-
[75]
Yurchenko, S. N., Mellor, T. M., Freedman, R. S., & Tennyson, J. 2020, , 496, 5282
work page 2020
-
[76]
Zahnle , K. J. & Catling , D. C. 2017, , 843, 122
work page 2017
-
[77]
, " * write output.state after.block = add.period write newline
ENTRY address archiveprefix author booktitle chapter edition editor howpublished institution eprint journal key month note number organization pages publisher school series title type volume year label extra.label sort.label short.list INTEGERS output.state before.all mid.sentence after.sentence after.block FUNCTION init.state.consts #0 'before.all := #1 ...
-
[78]
write newline
" write newline "" before.all 'output.state := FUNCTION n.dashify 't := "" t empty not t #1 #1 substring "-" = t #1 #2 substring "--" = not "--" * t #2 global.max substring 't := t #1 #1 substring "-" = "-" * t #2 global.max substring 't := while if t #1 #1 substring * t #2 global.max substring 't := if while FUNCTION word.in bbl.in " " * FUNCTION format....
This paper was first reviewed by deepseek-v4-flash on August 5, 2026.
discussion (0)
Sign in with ORCID, Apple, or X to comment. Anyone can read and Pith papers without signing in.