REVIEW 4 major objections 5 minor 1 cited by
A model-agnostic statistical framework claims 23 to 74 atmospheric CO2 observations are enough to detect climate-buffering feedbacks on rocky exoplanets (5 to 29 under a loose error tolerance).
Reviewed by Pith at T0; open to challenge. T0 means a machine referee read the full paper against a public rubric. the ladder, T0–T4 →
The paper's reported sample sizes for detecting climate buffering feedbacks are not supported because the simulations compare subsets to the full sample they came from and lack a control, making the numbers an artifact of the test design.
T0 review reviewed 2026-08-05 challenge →
load-bearing objection The paper's central sample-size estimates are artifacts of comparing each growing subset to the full sample it came from; the motivating question is good but the statistics need a full redesign. the 4 major comments →
Observational Tests of Terrestrial Planet Buffering Feedbacks and the Habitable Zone Concept
The pith
A machine-rendered reading of the paper's core claim, the machinery that carries it, and where it could break.
The reading
Core claim
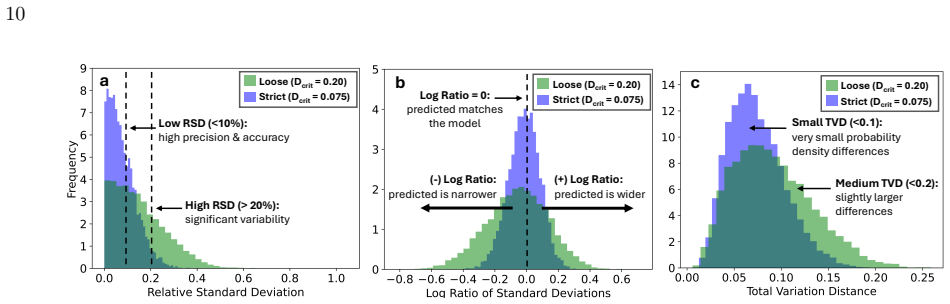
The central claim is that model-agnostic distribution testing of pCO2 can detect climate buffering: if a negative feedback regulates greenhouse gases, observed pCO2 values should cluster around a central value with decaying scatter, regardless of the physical mechanism. Using a sequential Kolmogorov-Smirnov procedure that accumulates simulated observations one at a time against a normal reference distribution, the paper reports 95% confidence intervals of [23, 74] observations for the strict threshold Dcrit=0.075 and [5, 29] for the loose threshold Dcrit=0.20 within a given solar luminosity range, and a minimum of 90 (up to 222) observations to confirm the habitable-zone trend across luminos
What carries the argument
The engine is a one-dimensional, sequential Kolmogorov-Smirnov test: draw 10,000 samples of size 100 from N(0,1), step through each sample adding one observation at a time, and compare the growing subset's empirical cumulative distribution against the full sample's cumulative distribution. When the maximum vertical distance D falls below a chosen critical value Dcrit (0.075 strict, 0.20 loose), the subset is declared consistent with the model, and that subset size is recorded as the required number of observations.
Load-bearing premise
The method decides a sample matches the model by comparing it to a fixed 100-point sample it was drawn from; this makes the test easier as the subset grows and always passes at 100 points.
What would settle it
Run the identical sequential protocol but compare each subset against the known N(0,1) cumulative distribution instead of the full 100-point sample; if the required sample sizes shift substantially upward or the 95% intervals widen beyond [23,74] and [5,29], the reported numbers depend on the subset-full-sample dependence rather than on detecting the model distribution itself.
If this is right
- If correct, roughly 23 to 74 CO2 spectra per luminosity bin suffice to detect buffering under strict criteria, a feasible target for future flagship missions.
- With a loose threshold, 5 to 29 observations give an early coarse check but risk false positives; follow-up with the strict threshold can refine feedback-strength estimates.
- Testing the full habitable-zone prediction—pCO2 rising with distance from the star—would require at least 90 and up to 222 observations, informing survey design.
- The method extends beyond CO2 to any observably distributed planetary property such as albedo, so the sample-size logic generalizes.
Where Pith is reading between the lines
- The reported intervals likely understate true requirements because the KS test compares each subset to the full 100-point sample it was drawn from, making the test easier as the subset grows and guaranteed to pass at 100 observations; a comparison against the known N(0,1) CDF or an independent reference sample would be a harder, cleaner test.
- The transfer from N(0,1) to real pCO2 data assumes buffered planets produce unimodal, roughly bell-shaped distributions; if real planets exhibit multimodality from multiple climate states, the sample sizes would need re-estimation—an extension the paper itself flags as future work.
- A practical testable extension: apply the same protocol to synthetic data with known feedback strengths and observation noise to calibrate how measurement error inflates the required sample sizes before mission planning.
Editorial analysis
A structured set of objections, weighed in public.
Referee Report
Summary. The paper proposes a model-agnostic statistical framework for estimating how many pCO2 observations of terrestrial exoplanets are needed to detect planetary-scale buffering feedbacks, and to test the habitable-zone hypothesis. The authors reproduce a previous carbonate-silicate weathering model result, then simulate samples from a standard normal distribution N(0,1), which they take to be the generic signature of buffering feedback. A sequential Kolmogorov-Smirnov (KS) procedure compares growing subsets of each simulated 100-point sample to the full sample; the sample size at which the KS statistic D falls below a fixed threshold Dcrit is recorded. Monte Carlo trials yield 95% confidence intervals of [23,74] observations for a strict threshold (Dcrit=0.075) and [5,29] for a loose threshold (Dcrit=0.20). The paper also reports that testing the full habitable-zone trend requires 90 to 222 observations. The central numerical claim is not supported by the analysis as described, because the sequential test compares a subset to its own parent sample, guaranteeing that the test eventually passes and conflating subset convergence with detectability of feedback. In addition, the simulations contain no no-feedback alternative, so the procedure cannot distinguish buffered from unbuffered populations.
Significance. If the sample-size estimates were valid, they would provide practical guidance for mission planning and for testing the habitable-zone hypothesis with future observations. The paper also usefully emphasizes sequencing uncertainty and reports percentile-based confidence intervals rather than symmetric Gaussian intervals. However, the central estimate is an artifact of the statistical procedure: because the KS test compares a growing subset to the full sample from which it is drawn, the two empirical CDFs converge by construction, and the reported thresholds are guaranteed to be met at the full sample size regardless of the true underlying distribution. The manuscript also never simulates a no-feedback or alternative distribution, so the procedure cannot detect feedback behavior in the sense claimed in the abstract. The modeling framework could in principle be repaired by comparing subsets to the analytic N(0,1) CDF or to an independent reference sample, and by including explicit null/alternative populations. As it stands, the load-bearing quantitative conclusions are unsupported, so the paper does not currently meet the standard for publication.
major comments (4)
- [Section 3.4, Figure 4] The sequential test compares each growing subset to the full 100-point sample from which that subset is drawn. The text states that the KS test measures D 'between the CDFs of the sample subset and the full sample.' Because the subset is nested in the full sample, the two CDFs become identical at N=100, so D falls below any fixed Dcrit by construction. The reported sample sizes therefore quantify how quickly a random subset converges to its own parent sample, not whether the subset is consistent with the N(0,1) model or whether feedback behavior is detectable. The correct comparison is against the analytic N(0,1) CDF or an independently drawn reference sample of equal size, with appropriate sample-size-dependent critical values.
- [Section 3 and Section 4] The procedure has no no-feedback baseline. All simulations draw from N(0,1), which Section 3 sets as 'the simplest form consistent with a buffering feedback.' The KS test is then used only to assess self-consistency of N(0,1) samples with N(0,1); it can never reject the feedback hypothesis. Thus the conclusions that '[23, 74] observations are required to detect feedback behavior' and that 30 to 74 observations 'may be sufficient to detect a CO2-buffering feedback' are not supported. A meaningful detection claim requires comparing a buffered model population against an explicit alternative (e.g., a log-uniform or otherwise unbuffered distribution) and reporting power or false-positive rates.
- [Section 3.5, Table 1, Figure 9] Dcrit is treated as a fixed, sample-size-independent 'error tolerance.' In the KS test, the critical value for a given significance level scales with sample size; a fixed D=0.075 or 0.20 does not correspond to a fixed Type I error rate across sample sizes. Moreover, because of the subset-vs-full-sample comparison, the condition D<Dcrit is guaranteed at N=100 for any Dcrit>0, so the maximum observed sample sizes in Table 1 and the resulting confidence intervals are predetermined by the simulation design rather than by the data or model. The authors should use the analytic KS distribution or a calibrated rejection region if they wish to keep a distance-based criterion.
- [Section 5, final paragraph of Results] The paper states that '90 and conservatively up to 222 observations (95% CI) at minimum would be needed to statistically confirm or reject the HZ hypothesis,' but no derivation, figure, or table is provided for these numbers in the Results section. The extension to the full habitable-zone trend requires a model for how pCO2 distributions vary across luminosity bins and a joint testing procedure; none is described. This claim is therefore not reproducible from the manuscript as written.
minor comments (5)
- [Abstract vs. Section 6] The abstract reports [23, 74] observations under the strict criterion, while the conclusion says 'between 30 to 74 observations.' These numbers should be reconciled.
- [Figure 4 caption] The caption says 'The subset size at which D exceeds Dcrit is recorded,' whereas the text and workflow indicate that the criterion is met when D falls below Dcrit. This inconsistency should be corrected.
- [Section 3.4] The test is described as a 'one-dimensional, two-sample, two-tailed KS test,' but if the reference is the known N(0,1) distribution, a one-sample KS test is the appropriate tool. If the comparison remains two-sample, the reference sample should be independent of the subset.
- [Figure 5] The sensitivity curve for Dcrit is presented without axis labels in the caption or clear units beyond 'Dcrit values' and 'mean misfit.' The chosen end-members (0.2 and 0.075) should be justified relative to a calibrated significance level, not only by the resulting misfit.
- [Section 2] The text refers to 'the log-normal pCO2 distribution' but Figure 1 and the subsequent text suggest a normal or log-normal ambiguity. Clarify whether the modeled distribution is log-normal or whether pCO2 is already log-transformed.
Circularity Check
Reported sample sizes are an artifact of comparing each growing subset to the full sample it was drawn from; detection claim reduces to subset-parent self-consistency.
specific steps
-
self definitional
[Section 3.4 (Hypothesis Testing: Kolmogorov-Smirnov Statistical Test) and Figure 4 caption]
"The method involves comparing a sample subset to a sample from the N(0, 1) model, with the subset increasing one data point at a time until an error threshold is reached between the two. ... The KS test measures the maximum vertical distance, D, between the cumulative distribution functions (CDFs) of the sample subset and the full sample. ... Using the Kolmogorov-Smirnov (KS) test, the sample subset shown in blue is compared against the sample."
The 'model' against which each growing subset is tested is the 100-point sample from N(0,1) that contains the subset. Because the subset is a subset of the full sample, the two empirical CDFs converge as the subset grows and are identical at size 100, so D < Dcrit is guaranteed for every Monte Carlo trial regardless of physical feedback. The headline intervals [23,74] and [5,29] therefore measure when a random subset of one N(0,1) draw first resembles its own parent sample, not when data are detected to be consistent with a buffering feedback. Section 3.4 also states the test 'is not used to determine whether the samples share the same parent distribution, as this is already known,' confirming that the procedure never tests the feedback hypothesis against a no-feedback alternative. Thus th
full rationale
The central numerical claim of the paper—that [23,74] (strict) and [5,29] (loose) observations are sufficient to detect buffering-feedback behavior—is not an independent statistical finding. The workflow draws 10,000 samples of size 100 from N(0,1), which was chosen because the authors deem it 'the simplest form consistent with a buffering feedback.' Within each sample, a sequentially growing subset is compared to the full 100-point sample from which it was drawn. The KS statistic D between a subset and its parent sample tends to 0 as the subset reaches the full sample, so the condition D < Dcrit is guaranteed to be met eventually, independent of any external data or feedback process. Consequently, the reported sample sizes quantify self-consistency of a random subset with its own parent, not detectability of feedback relative to a null hypothesis. The paper contains no comparison to a no-feedback distribution, and the test is explicitly said not to be used to determine whether the samples share a parent distribution. This makes the headline result an artifact of the test's definition rather than an empirical constraint on exoplanet observations. The self-citation to Lenardic & Seales (2021) for the peaked-PDF signature is load-bearing but is secondary to the central statistical circularity; the main reduction is the subset-versus-full-sample comparison itself. Score 8: the central prediction reduces by construction.
Axiom & Free-Parameter Ledger
free parameters (4)
- Dcrit_strict =
0.075
- Dcrit_loose =
0.20
- Monte Carlo sample size N =
100
- Number of Monte Carlo trials =
10000
axioms (4)
- domain assumption A buffering feedback produces a peaked, unimodal probability distribution of pCO2 around an equilibrium value.
- ad hoc to paper The normal distribution N(0,1) is the simplest and representative model of a feedback-buffered population.
- ad hoc to paper A fixed KS critical value Dcrit is a valid measure of statistical similarity regardless of sample size.
- ad hoc to paper The full sample of N=100 drawn from N(0,1) is a valid reference for the population distribution when comparing a subset.
Cite this review
Pith. "Pith review of Observational Tests of Terrestrial Planet Buffering Feedbacks and the Habitable Zone Concept." pith.science (2026). https://pith.science/paper/ZESWNZZK
@misc{pith2026250902848,
  author       = {Pith},
  title        = {Pith review of: Observational Tests of Terrestrial Planet Buffering Feedbacks and the Habitable Zone Concept},
  year         = {2026},
  howpublished = {\url{https://pith.science/paper/ZESWNZZK}},
  note         = {Machine review of arXiv:2509.02848}
}
abstract
The habitable zone is defined as the orbital region around a star where planetary feedback cycles buffer atmospheric greenhouse gases that, in combination with solar luminosity, maintain surface temperatures suitable for liquid water. Evidence supports the existence of buffering feedbacks on Earth, but whether these same feedbacks are active on other Earth-like planets remains untested, as does the habitable zone hypothesis. While feedbacks are central to the habitable zone concept, one does not guarantee the other-i.e., it is possible that a planet may maintain stable surface conditions at a given solar luminosity without following the predicted $CO_2$ trend across the entire habitable zone. Forthcoming exoplanet observations will provide an opportunity to test both ideas. In anticipation of this and to avoid premature conclusions based on insufficient data, we develop statistical tests to determine how many observations are needed to detect and quantify planetary-scale feedbacks. Our model-agnostic approach assumes only the most generic prediction that holds for any buffering feedback, allowing the observations to constrain feedback behavior. That can then inform next-level questions about what specific physical, chemical, and/or biological feedback processes may be consistent with observational data. We find that [23, 74](95% CI) observations are required to detect feedback behavior within a given solar luminosity range, depending on the sampling order of planets. These results are from tests using conservative error tolerance-a measure used to capture the risk of false positives. Reducing error tolerance lowers the chance of false positives but requires more observations; increasing it reduces the required sample size but raises uncertainty in estimating population characteristics. We discuss these trade-offs and their implications for testing the habitable zone hypothesis.
Figures




Forward citations
Cited by 1 Pith paper
-
Not Earth-like Yet Temperate? More Generic Climate Feedback Configurations Still Allow Temperate Climates in Habitable Zone Exo-Earth Candidates
An idealized model with an extra generalized feedback produces chaotic and runaway climates and predicts that strong positive fourth feedbacks reduce long-term temperate habitability of Earth-like exoplanets.
Reference graph
Works this paper leans on
-
[1]
2025, The Astronomical Journal, 169, 125, doi: 10.3847/1538-3881/ada384
Affholder, A., Mazevet, S., Sauterey, B., Apai, D., & Ferri` ere, R. 2025, The Astronomical Journal, 169, 125, doi: 10.3847/1538-3881/ada384
-
[2]
Ballmer, M. D., & Noack, L. 2021, Elements, 17, 245, doi: 10.2138/gselements.17.4.245
-
[3]
Bean, J. L., Abbot, D. S., & Kempton, E. M.-R. 2017, The Astrophysical Journal Letters, 841, L24, doi: 10.3847/2041-8213/aa738a
-
[4]
Berger, V. W., & Zhou, Y. 2014, in Wiley StatsRef: Statistics Reference Online (John Wiley & Sons, Ltd), doi: 10.1002/9781118445112.stat06558 14
-
[5]
2013, Icarus, 226, 1724, doi: 10.1016/j.icarus.2013.03.017 de Wit, J., Doyon, R., Rackham, B
Boschi, R., Lucarini, V., & Pascale, S. 2013, Icarus, 226, 1724, doi: 10.1016/j.icarus.2013.03.017 de Wit, J., Doyon, R., Rackham, B. V., et al. 2024, Nature Astronomy, 1, doi: 10.1038/s41550-024-02298-5
-
[6]
Dressing, C., Ansdell, M., Crooke, J., et al. 2024, Bulletin of the AAS, 56
work page 2024
-
[7]
Foster, G. L., Royer, D. L., & Lunt, D. J. 2017, Nature Communications, 8, 14845, doi: 10.1038/ncomms14845
-
[8]
Garcia-Piquer, A., Morales, J. C., Ribas, I., et al. 2017, Astronomy & Astrophysics, 604, A87, doi: 10.1051/0004-6361/201628577
-
[9]
S., Seager, S., Mennesson, B., et al
Gaudi, B. S., Seager, S., Mennesson, B., et al. 2020, The Habitable Exoplanet Observatory (HabEx) Mission Concept Study Final Report, arXiv, doi: 10.48550/arXiv.2001.06683
-
[10]
J., Lichtenberg, T., & Pierrehumbert, R
Graham, R. J., Lichtenberg, T., & Pierrehumbert, R. T. 2022, Journal of Geophysical Research: Planets, 127, e2022JE007456, doi: 10.1029/2022JE007456
-
[11]
Graham, R. J., & Pierrehumbert, R. 2020, The Astrophysical Journal, 896, 115, doi: 10.3847/1538-4357/ab9362
-
[12]
Greene, T. P., Line, M. R., Montero, C., et al. 2016, The Astrophysical Journal, 817, 17, doi: 10.3847/0004-637X/817/1/17
-
[13]
L., Leconte, J., Forget, F., et al
Grenfell, J. L., Leconte, J., Forget, F., et al. 2020, Space Science Reviews, 216, 98, doi: 10.1007/s11214-020-00716-4
-
[14]
Kasting, J. F., Kopparapu, R., Ramirez, R. M., & Harman, C. E. 2014, Proceedings of the National Academy of Sciences, 111, 12641, doi: 10.1073/pnas.1309107110
-
[15]
Kasting, J. F., Whitmire, D. P., & Reynolds, R. T. 1993, Icarus, 101, 108, doi: 10.1006/icar.1993.1010
arXiv 1993
-
[16]
Kempton, E. M.-R., & Knutson, H. A. 2024, Reviews in Mineralogy and Geochemistry, 90, 411, doi: 10.2138/rmg.2024.90.12
-
[17]
Kopparapu, R. K., Ramirez, R., Kasting, J. F., et al. 2013, The Astrophysical Journal, 765, 131, doi: 10.1088/0004-637X/765/2/131
-
[18]
Krissansen-Totton, J., & Catling, D. C. 2017, Nature Communications, 8, 15423, doi: 10.1038/ncomms15423
-
[19]
H., Anand, P., Blenkinsop, T., et al
Lear, C. H., Anand, P., Blenkinsop, T., et al. 2021, Journal of the Geological Society, 178, jgs2020, doi: 10.1144/jgs2020-239
-
[20]
Lehmann, E. L., & Romano, J. P. 2008, Testing Statistical Hypotheses, 3rd edn., Springer Texts in Statistics (New York: Springer)
work page 2008
-
[21]
Lehmer, O. R., Catling, D. C., & Krissansen-Totton, J. 2020, Nature Communications, 11, 6153, doi: 10.1038/s41467-020-19896-2
-
[22]
2019, Astrobiology, 19, 1398, doi: 10.1089/ast.2018.1833
Lenardic, A., & Seales, J. 2019, Astrobiology, 19, 1398, doi: 10.1089/ast.2018.1833
-
[23]
2021, International Journal of Astrobiology, 20, 125, doi: 10.1017/S1473550420000415
Lenardic, A., & Seales, J. 2021, International Journal of Astrobiology, 20, 125, doi: 10.1017/S1473550420000415
-
[24]
2013, Astronomische Nachrichten, 334, 576, doi: 10.1002/asna.201311903
Lucarini, V., Pascale, S., Boschi, R., Kirk, E., & Iro, N. 2013, Astronomische Nachrichten, 334, 576, doi: 10.1002/asna.201311903
-
[25]
Massey, F. J. 1951, Journal of the American Statistical Association, 46, 68, doi: 10.2307/2280095
doi:10.2307/2280095 1951
-
[26]
2015, Earth and Planetary Science Letters, 429, 20, doi: 10.1016/j.epsl.2015.07.046
Menou, K. 2015, Earth and Planetary Science Letters, 429, 20, doi: 10.1016/j.epsl.2015.07.046
-
[27]
Murante, G., Provenzale, A., Vladilo, G., et al. 2020, Monthly Notices of the Royal Astronomical Society, 492, 2638, doi: 10.1093/mnras/stz3529 Muth´ en, L. K., & Muth´ en, B. O. 2002, Structural Equation Modeling: A Multidisciplinary Journal, 9, 599, doi: 10.1207/S15328007SEM0904 8
-
[28]
P., Venot, O., Lagage, P.-O., & Tinetti, G
Rocchetto, M., Waldmann, I. P., Venot, O., Lagage, P.-O., & Tinetti, G. 2016, The Astrophysical Journal, 833, 120, doi: 10.3847/1538-4357/833/1/120
-
[29]
Rogers, L. A. 2015, The Astrophysical Journal, 801, 41, doi: 10.1088/0004-637X/801/1/41
- [30]
-
[31]
Walker, J. C. G., Hays, P. B., & Kasting, J. F. 1981, Journal of Geophysical Research: Oceans, 86, 9776, doi: 10.1029/JC086iC10p09776
This paper was first reviewed by deepseek-v4-flash on August 5, 2026.
discussion (0)
Sign in with ORCID, Apple, or X to comment. Anyone can read and Pith papers without signing in.