REVIEW 4 major objections 5 minor 13 references
This paper argues that single-threshold evaluation of attribution methods is unreliable—threshold choice alone can move a method's score by more than 200 percentage points and reverse rankings—and proposes threshold-free AUC-IoU as a stable
Reviewed by Pith at T0; open to challenge. T0 means a machine referee read the full paper against a public rubric. the ladder, T0–T4 →
Averaging IoU across many thresholds ranks XRAI above LIME and Integrated Gradients variants on HAM10000, and shows single-threshold attribution rankings are unstable.
T0 review reviewed 2026-08-05 challenge →
load-bearing objection Worth a serious referee: the threshold-bias artifact is real and useful, but AUC-IoU's 'reliability' and XRAI's win outrun the evidence because lesion-mask ground truth is the only anchor and no code, data, or faithfulness check is provided. the 4 major comments →
Systematic Evaluation of Attribution Methods: Eliminating Threshold Bias and Revealing Method-Dependent Performance Patterns
The pith
A machine-rendered reading of the paper's core claim, the machinery that carries it, and where it could break.
The reading
Core claim
On a fine-tuned ResNet-18 trained to classify HAM10000 dermoscopic images as melanoma or not, the paper evaluates seven attribution methods using a threshold-free protocol. For every image, each attribution map is normalized, binarized at 19 thresholds from 0.05 to 0.95, and compared with the binarized lesion mask via IoU; the trapezoidal integral of IoU over thresholds (AUC-IoU) becomes the method score. The central finding is that single-threshold IoU scores are strongly threshold-dependent—vanilla Integrated Gradients varies by 235.6 percentage points between low and high thresholds—whereas AUC-IoU gives a stable ranking in which XRAI is best, LIME second, and vanilla Integrated Gradients
What carries the argument
The load-bearing mechanism is the AUC-IoU score: for each normalized attribution map A and binarized ground-truth mask G, IoU(τ) = |Aτ ∩ G| / |Aτ ∪ G| is computed at 19 thresholds τ ∈ [0.05, 0.95] and integrated by the trapezoidal rule. This replaces a single arbitrary threshold with the full threshold spectrum, so a method is rewarded for being accurate across all operating points rather than at one chosen cutoff. Supporting statistical machinery—paired Wilcoxon signed-rank tests with Holm-Bonferroni correction across 21 pairwise and 133 threshold comparisons—establishes that the resulting ranking differences are not sampling noise.
Load-bearing premise
The ranking is only as trustworthy as the assumption that binarized lesion masks are a valid ground truth for explanation quality and that threshold-averaged IoU faithfully captures how useful an explanation is; if the masks are incomplete or misaligned, the XRAI-first result is an artifact of the metric.
What would settle it
Take the same 500-image evaluation set and dilate or erode the ground-truth lesion masks by a few pixels, or replace them with independent expert annotations, then recompute AUC-IoU for XRAI and LIME. If XRAI's 31% margin shrinks or reverses under small mask perturbations, the ranking is driven by mask alignment rather than explanation quality; if the margin holds, the threshold-free claim survives.
If this is right
- Single-threshold IoU rankings of attribution methods should be treated as provisional; a reported comparison can change by more than 200 percentage points if a different cutoff is used.
- AUC-IoU can serve as a threshold-free standard protocol, and papers that report only one operating point should be interpreted with caution.
- On dermoscopic melanoma classification, XRAI is the strongest of the seven tested methods, including a 31% advantage over LIME and a 204% advantage over vanilla Integrated Gradients.
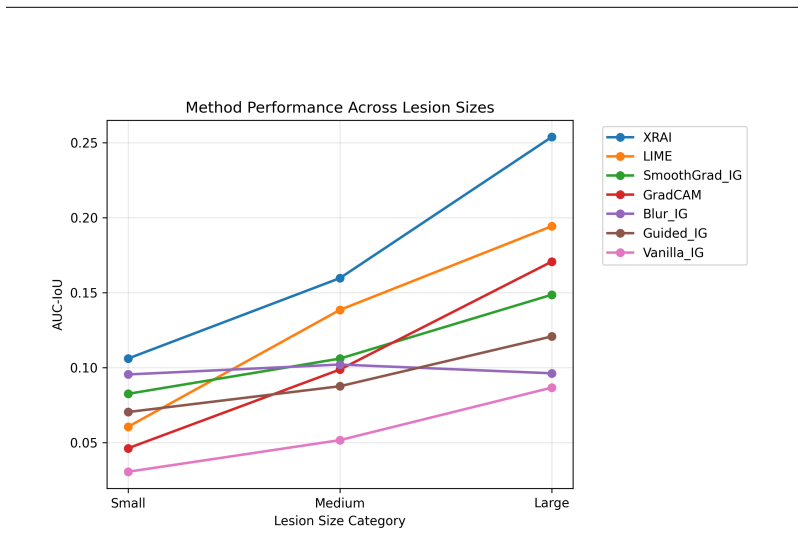
- Method selection depends on lesion scale: Grad-CAM improves 269% from small to large lesions, while Blur IG is flat, so global averages hide clinically relevant differences.
- Gradient-based, region-based, and perturbation-based methods have characteristic threshold responses, which means application designers can match attribution concentration to the task at hand.
Where Pith is reading between the lines
- Going beyond the paper, the same threshold-free logic should apply to other overlap and distance metrics, such as Dice or Hausdorff distance, and to multi-class or non-medical tasks; a method that ranks first under AUC-IoU may not rank first under those variants.
- A threshold-free score weights all thresholds equally, but real deployments often operate at one threshold; for a specific clinical workflow, a threshold-sensitivity analysis rather than an average may be the more actionable output.
- The size-stratified results suggest a testable intervention: an adaptive system that switches attribution methods by lesion size should beat any single method on average, since XRAI leads on small lesions while Grad-CAM's large-lesion performance is competitive.
- If AUC-IoU becomes the standard, previously published benchmarks that used single thresholds should be re-run; the paper's own numbers imply some of those rankings will reverse.
Editorial analysis
A structured set of objections, weighed in public.
Referee Report
Summary. The paper proposes a threshold-free evaluation protocol for attribution methods, replacing single-threshold IoU with AUC-IoU computed across 19 thresholds. On a HAM10000-derived dermatological image set with a fine-tuned ResNet-18, the authors compare seven attribution methods and report that (i) single-threshold IoU rankings are highly unstable, with threshold choice producing large relative performance swings; (ii) AUC-IoU yields statistically reliable differentiation; (iii) XRAI outperforms LIME by 31% and vanilla Integrated Gradients by 204%; and (iv) size-stratified analysis reveals performance variation up to 269% across lesion scales. The paper concludes that threshold-free evaluation should become standard practice.
Significance. If the central finding holds, the paper makes a useful methodological point: attribution evaluations that binarize at an arbitrary threshold can produce misleading comparisons. The study is computationally simple, uses a moderately large evaluation set (500 images), and applies appropriate paired non-parametric statistics with multiple-comparison correction. The authors also report implementation details for each attribution method. However, the significance is substantially limited because the validity of the proposed metric is not independently anchored: the lesion segmentation mask is assumed to be the ground truth for attribution quality for all images, including 333 non-melanoma cases where the model's negative prediction need not be driven by the lesion. The paper lacks a random/trivial baseline, external faithfulness metrics, or human evaluation, so the claimed 'reliable differentiation' and the XRAI ranking are only as strong as that assumption. The threshold-bias phenomenon is credible, but the method-ranking claim is not yet established.
major comments (4)
- [Sec. 3.1, Eq. (1)-(2), Table 1] The evaluation metric assumes that binarized lesion segmentation masks are the ground truth for attribution quality on all 500 images. For the 333 non-melanoma images in the evaluation subset, the model's decision is 'not melanoma'; the lesion mask is not necessarily the evidence for that negative prediction. Scoring IoU against the lesion mask therefore rewards methods that localize the lesion (e.g., region-based XRAI) and penalizes methods that highlight surrounding context or healthy tissue that may legitimately drive a non-melanoma decision. This is a conceptual mismatch, not merely noise. The paper's own Sec. 5.4 concedes 'IoU alone may not fully capture attribution quality,' but the limitation is load-bearing: without restricting to cases where the mask is the evidence, or adding faithfulness/human validation, the central claim that AUC-IoU provides 'reliable differentiation' and t
- [Sec. 3.5, Table 2] No trivial or random baseline is reported. The mean AUC-IoU values (0.06-0.18) are presented without comparison to a random attribution map, a constant map, or a center-prior baseline. Without such a control, the reader cannot tell whether these values indicate meaningful localization skill, or whether the apparent separation between methods is an artifact of mask size, prevalence, or the IoU edge-case rule. To support the claim that AUC-IoU 'reliably differentiates' methods, the authors should add random and trivial attribution baselines and show that their metric ranks them below the tested methods.
- [Eq. (3), Table 5, Sec. 4.5.1] The headline claim that 'threshold choice alone can alter rankings by over 200 percentage points' is based on relative differences between AUC-IoU and IoU at a single threshold, not on actual ranking changes. Since IoU(τ) can be near zero, the relative difference in Eq. (3) is unbounded and can be large even when the absolute difference is small. The paper does not explicitly report rank-order stability across thresholds (e.g., rank vectors or rank-correlation values). Table 5 does show some rank reversals (e.g., LIME drops from 2nd at τ=0.3 to below XRAI at τ=0.7), but the '200 percentage points' language conflates relative performance swings with ordinal ranking instability. Please report ranking stability directly and use an appropriate measure of rank change.
- [Sec. 3.5, Sec. 4.5.1] The 'threshold-free' protocol is not actually free of arbitrary choices: it depends on the 19-point grid (τ ∈ [0.05,0.95]), trapezoidal integration, the attribution-map normalization method, and the edge-case rule that returns IoU=1 when the union is zero. The normalization method is not specified, yet it can substantially change the threshold behavior and therefore the AUC-IoU. The paper also claims LIME is 'threshold-invariant' based on only three thresholds (τ=0.3, 0.5, 0.7), while the text generalizes to 'across all τ'. Please provide a sensitivity analysis over grid resolution and normalization, show the full IoU-threshold curves for all methods, and clarify the edge-case rule's effect on the results.
minor comments (5)
- [Sec. 3.4.1] The subsection '3.4.1 Threshold-Free Evaluation Protocol' appears to be empty; Eq. (1)-(2) are introduced under Sec. 3.5. Please either move the content or remove the empty heading.
- [Sec. 3.7, Table 4] The size-stratified counts (133 small, 160 medium, 207 large) do not match the stated 33rd/67th percentile split, which would give roughly 165 per group on a 500-image set. Please clarify whether the percentile thresholds are computed on the full dataset or a different subset, and discuss how the skewed distribution affects the interpretation.
- [Sec. 3.5] The description '19 uniformly spaced thresholds' should explicitly state the step size (0.05) and whether the endpoints are inclusive. Also, the edge-case rule 'returning a score of 1.0' for zero union deserves a justification, since it can overstate agreement if both the attribution map and the mask are empty.
- [Sec. 4.5.1, Table 5] The footnote in Table 5 says '*All differences statistically significant: **p <0.001' but uses inconsistent asterisks and does not specify the correction across the 21 reported comparisons versus the 133 comparisons mentioned in Sec. 3.8.2. Please make the multiple-comparison description consistent.
- [Appendix D] The reproducibility statement lists software versions and seeds but does not provide code or data availability. Given that the evaluation protocol is the paper's main contribution, releasing the implementation and the exact evaluation split would greatly strengthen reproducibility.
Circularity Check
No significant circularity: the AUC-IoU evaluation uses an external ground truth and no fitted parameters; XRAI's ranking is an empirical outcome, not a construction.
full rationale
The paper's derivation chain is self-contained. Attribution quality is operationalized as IoU between thresholded attribution maps and binarized lesion segmentation masks (Eq. 1-2), where the masks come from the external HAM10000 dataset (Sec. 3.1, Appendix A.1). No parameter is fitted to force any method to win; XRAI's superiority is an empirical result of applying a fixed protocol to seven standard implementations (Sec. 3.3). The AUC-IoU metric is defined independently of the conclusions drawn from it, and the pairwise Wilcoxon tests (Sec. 3.8, Table 3) are standard significance checks, not a way of encoding the ranking into the metric. The paper contains no load-bearing self-citations: all cited works are independent prior art (Sundararajan et al., Ribeiro et al., Kapishnikov et al., etc.), and none is invoked as a uniqueness theorem or to forbid alternative metrics. The limitations paragraph (Sec. 5.4) correctly concedes that 'IoU alone may not fully capture attribution quality'; this is a construct-validity caveat, not a circular reduction. The skeptical concern that lesion masks may not be the evidence for non-melanoma predictions (333 of 500 images) is a substantive validity threat, but it does not make the derivation circular: the metric is external, the ranking is not forced by the metric's definition, and the paper does not claim the masks were derived from the attributions. Therefore no circular step meets the evidentiary bar of Eq. X = Eq. Y by construction or a fitted parameter renamed as prediction.
Axiom & Free-Parameter Ledger
free parameters (7)
- Threshold grid =
19 thresholds, tau in [0.05, 0.95]
- IoU edge-case rule =
1.0 when union is zero
- Attribution normalization method =
not specified beyond normalization to [0,1]
- LIME hyperparameters =
1000 perturbations, kernel width 1.0, ridge alpha 10.0, seed 42
- IG variant hyperparameters =
25 integration steps, zero baseline, max distance 1.0, fraction 0.5
- Size-stratification percentiles =
33rd and 67th percentiles
- Temperature scaling =
T*=2.28 fit to validation logits
axioms (7)
- domain assumption Binarized HAM10000 segmentation masks are the ground truth for attribution quality
- domain assumption IoU averaged over thresholds is a valid measure of explanation quality
- domain assumption All thresholds in [0.05, 0.95] are equally informative
- domain assumption The saliency library implementations faithfully represent each attribution method
- domain assumption A single fine-tuned ResNet-18 is representative for attribution comparison
- domain assumption Masks align with model inputs after resizing
- standard math Wilcoxon signed-rank tests and Holm-Bonferroni correction are appropriate
Cite this review
Pith. "Pith review of Systematic Evaluation of Attribution Methods: Eliminating Threshold Bias and Revealing Method-Dependent Performance Patterns." pith.science (2026). https://pith.science/paper/ZRAH5ISA
@misc{pith2026250903176,
  author       = {Pith},
  title        = {Pith review of: Systematic Evaluation of Attribution Methods: Eliminating Threshold Bias and Revealing Method-Dependent Performance Patterns},
  year         = {2026},
  howpublished = {\url{https://pith.science/paper/ZRAH5ISA}},
  note         = {Machine review of arXiv:2509.03176}
}
read the original abstract
Attribution methods explain neural network predictions by identifying influential input features, but their evaluation suffers from threshold selection bias that can reverse method rankings and undermine conclusions. Current protocols binarize attribution maps at single thresholds, where threshold choice alone can alter rankings by over 200 percentage points. We address this flaw with a threshold-free framework that computes Area Under the Curve for Intersection over Union (AUC-IoU), capturing attribution quality across the full threshold spectrum. Evaluating seven attribution methods on dermatological imaging, we show single-threshold metrics yield contradictory results, while threshold-free evaluation provides reliable differentiation. XRAI achieves 31% improvement over LIME and 204% over vanilla Integrated Gradients, with size-stratified analysis revealing performance variations up to 269% across lesion scales. These findings establish methodological standards that eliminate evaluation artifacts and enable evidence-based method selection. The threshold-free framework provides both theoretical insight into attribution behavior and practical guidance for robust comparison in medical imaging and beyond.
Figures




Reference graph
Works this paper leans on
-
[9]
URL https://arxiv.org/abs/ 1610.02391
doi: 10.48550/ARXIV .1610.02391. URL https://arxiv.org/abs/ 1610.02391. Publisher: arXiv Version Number:
- [10]
- [11]
-
[12]
Attention-based Saliency Maps Improve Interpretability of Pneumothorax Classification
doi: 10.48550/ARXIV .2303.01871. URL https://arxiv.org/abs/ 2303.01871. Publisher: arXiv Version Number:
work page internal anchor Pith review Pith/arXiv arXiv doi:10.48550/arxiv.2303.01871
- [13]
- [2016]
- [2017]
- [2018]
- [2019]
-
[2022]
doi: 10.1186/s13104-022-06096-y
ISSN 1756-0500. doi: 10.1186/s13104-022-06096-y. URL https://bmcresnotes. biomedcentral.com/articles/10.1186/s13104-022-06096-y . Ian E. Nielsen, Ravi P. Ramachandran, Nidhal Bouaynaya, Hassan M. Fathallah-Shaykh, and Ghu- lam Rasool. EvalAttAI: A Holistic Approach to Evaluating Attribution Maps in Robust and Non-Robust Models
-
[2023]
EvalAttAI: A Holistic Approach to Evaluating Attribution Maps in Robust and Non-Robust Models
doi: 10.48550/ARXIV .2303.08866. URLhttps://arxiv.org/ abs/2303.08866. Publisher: arXiv Version Number:
work page internal anchor Pith review Pith/arXiv arXiv doi:10.48550/arxiv.2303.08866
-
[2024]
doi: 10.1016/j.ejrad.2024.111356
ISSN 0720048X. doi: 10.1016/j.ejrad.2024.111356. URL https://linkinghub.elsevier. com/retrieve/pii/S0720048X2400072X. Andrei Kapishnikov, Tolga Bolukbasi, Fernanda Vi ´egas, and Michael Terry. XRAI: Better Attri- butions Through Regions,
-
[5839]
URL https://www.nature.com/articles/ s42256-022-00536-x
doi: 10.1038/s42256-022-00536-x. URL https://www.nature.com/articles/ s42256-022-00536-x . Ramprasaath R. Selvaraju, Michael Cogswell, Abhishek Das, Ramakrishna Vedantam, Devi Parikh, and Dhruv Batra. Grad-CAM: Visual Explanations from Deep Networks via Gradient-based Localization
This paper was first reviewed by deepseek-v4-flash on August 5, 2026.
discussion (0)
Sign in with ORCID, Apple, or X to comment. Anyone can read and Pith papers without signing in.