J-PLUS: The stellar mass function of quiescent and star-forming galaxies at 0.05 <= z <= 0.2
Pith reviewed 2026-05-18 19:09 UTC · model grok-4.3
The pith
J-PLUS photometry shows quiescent galaxies have a characteristic mass 0.4 dex higher than star-forming ones and hold 75 percent of the stellar mass density above 10^9 solar masses.
A machine-rendered reading of the paper's core claim, the machinery that carries it, and where it could break.
Core claim
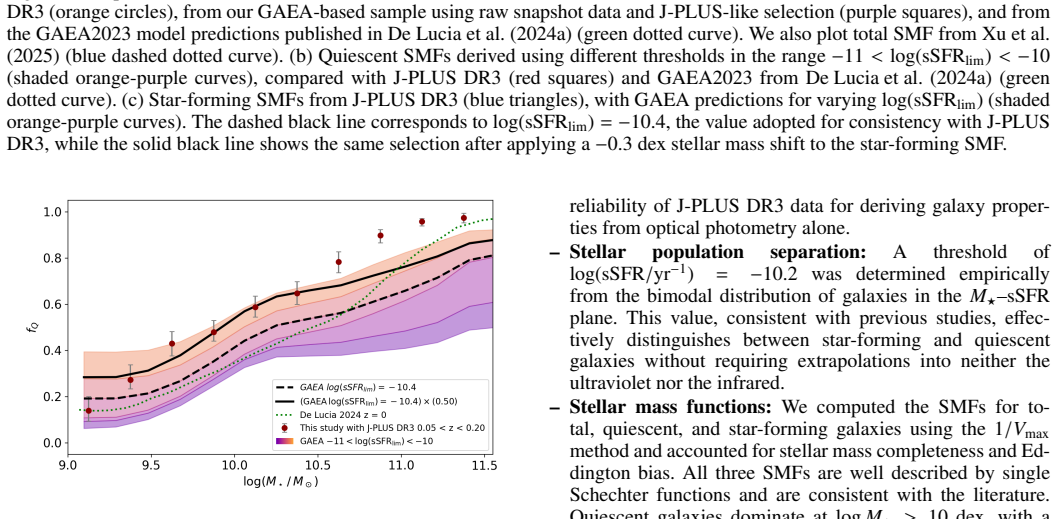
The stellar mass functions of quiescent and star-forming galaxies are well described by Schechter functions. The characteristic mass for quiescent galaxies reaches log(M*/Msun) = 10.80, 0.4 dex larger than for star-forming galaxies. The faint-end slope is steeper for star-forming galaxies (alpha = -1.2) than for quiescent galaxies (alpha = -0.7). The quiescent fraction rises by 40 percent per dex in stellar mass and exceeds 0.95 above log(M*) = 11. Quiescent galaxies comprise 45 percent of the number density but 75 percent of the stellar mass density above log(M*) > 9.
What carries the argument
Stellar masses and specific star formation rates derived from CIGALE SED fitting on 12-band J-PLUS photometry, followed by a fixed sSFR threshold of log(sSFR [yr^-1]) = -10.2 to split populations and the 1/Vmax method to compute the mass functions.
If this is right
- Quiescent galaxies dominate the high-mass end while star-forming galaxies contribute more at lower masses due to their steeper faint-end slope.
- The rising quiescent fraction with mass supplies a direct constraint on the efficiency of quenching processes in galaxy evolution models.
- J-PLUS results match earlier photometric and spectroscopic surveys, confirming that 75 percent of local stellar mass resides in quiescent systems.
- The GAEA semi-analytic model underpredicts the observed number of star-forming galaxies at intermediate masses.
Where Pith is reading between the lines
- These mass functions offer a local anchor for testing whether hydrodynamic simulations reproduce the observed 0.4 dex offset in characteristic mass.
- The 20 percent gain in redshift precision from narrow bands implies that similar filter sets in future wide-field surveys could reduce classification scatter at higher redshifts.
- If the sSFR threshold remains stable across environments, it points to a mass-driven rather than density-driven quenching channel at low redshift.
Load-bearing premise
The fixed sSFR threshold of -10.2 from photometric SED fitting correctly separates quiescent and star-forming galaxies without large misclassification errors across the mass range.
What would settle it
A spectroscopic survey at the same redshifts that measures a quiescent fraction that stays flat or declines with stellar mass instead of rising 40 percent per dex.
Figures


read the original abstract
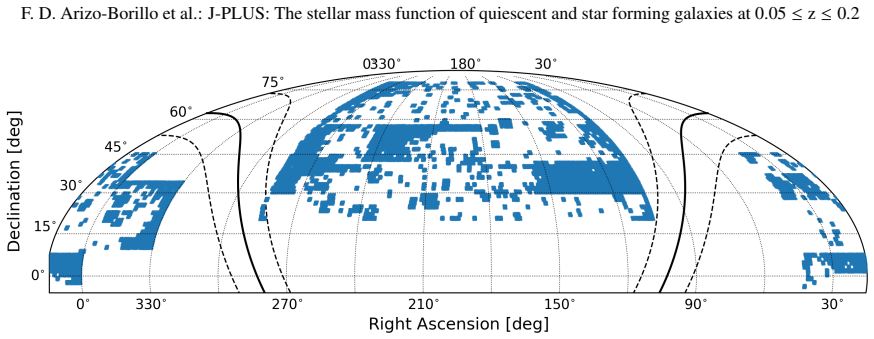
Aims. We derive the stellar mass function (SMF) of quiescent and star-forming galaxies at z <= 0.2 using 12-band optical photometry from the third data release (DR3) of the Javalambre Photometric Local Universe Survey (J-PLUS) over 3,284 deg^2. Methods. We select approximately 890,000 galaxies with r <= 20 mag and photometric redshifts in the range 0.05 <= z <= 0.20. Stellar masses and star formation rates were derived through spectral energy distribution fitting with CIGALE, confronted with spectroscopic samples. Galaxies are classified as star-forming or quiescent based on their specific star formation rate (sSFR), adopting log(sSFR [yr^-1]) = -10.2. We compute SMFs for both populations using the 1/Vmax method, apply completeness corrections, and fit Schechter functions. Results. The SMFs from J-PLUS DR3 are well described by Schechter functions and agree with previous photometric and spectroscopic studies. The characteristic mass for quiescent galaxies, log(M*/Msun) = 10.80, is 0.4 dex larger than that of star-forming galaxies. The faint-end slope is steeper for star-forming galaxies (alpha = -1.2) than for quiescent ones (alpha = -0.7). The quiescent fraction rises by 40 percent per dex in stellar mass, reaching fQ > 0.95 at log(M*/Msun) > 11. Comparisons with the GAEA semi-analytic model reveal an excess of star-forming galaxies at intermediate masses. Conclusions. J-PLUS DR3 stellar mass functions and quiescent fractions are consistent with the literature and provide robust constraints for galaxy formation models. Quiescent galaxies represent 45 percent of number density above log(M*) > 9, but 75 percent of stellar mass density. The use of 12 optical bands, including 7 narrow filters, improves redshift precision by 20 percent, enabling more accurate SED fitting and galaxy classification.
Editorial analysis
A structured set of objections, weighed in public.
Referee Report
Summary. The manuscript derives the stellar mass functions (SMFs) of quiescent and star-forming galaxies at 0.05 ≤ z ≤ 0.2 using J-PLUS DR3 12-band optical photometry over 3284 deg². Approximately 890,000 galaxies with r ≤ 20 mag are selected; stellar masses and SFRs are obtained via CIGALE SED fitting, galaxies are classified using a fixed log(sSFR [yr^{-1}]) = -10.2 threshold, SMFs are computed with the 1/Vmax method including completeness corrections, and Schechter functions are fitted. Key results include a 0.4 dex higher characteristic mass for quiescent galaxies (log M* = 10.80), steeper faint-end slope for star-forming galaxies (α = -1.2 vs. -0.7), rising quiescent fraction with mass (reaching >0.95 above log M* > 11), and consistency with prior photometric/spectroscopic studies plus the GAEA model.
Significance. If the classification and completeness modeling hold, the work provides a valuable large-area photometric constraint on the low-redshift galaxy bimodality and SMFs, leveraging narrow-band filters for improved redshift precision and a sample size that enables precise Schechter parameter measurements. The direct comparison to the GAEA semi-analytic model and the reported stellar mass density contributions (quiescent galaxies dominating 75% of mass density above log M* > 9) offer useful benchmarks for galaxy formation theory.
major comments (2)
- [Methods / galaxy classification] Galaxy classification section: The fixed threshold log(sSFR) = -10.2 is adopted without a reported sensitivity analysis to threshold variations (±0.2 dex) or to mass/redshift-dependent SED fit quality. Because stellar masses and sSFRs are derived from the identical 12-band CIGALE fits, correlated modeling systematics (dust law, templates, narrow-band calibration) can shift objects across the cut in a mass-dependent manner; this directly affects the reported 0.4 dex M* offset, α values, and quiescent fraction trends. A quantitative robustness test recomputing the binned SMFs and Schechter parameters under varied thresholds is needed to support the central claims.
- [Methods / SMF computation] SMF computation section: The 1/Vmax completeness corrections are described at a high level but lack explicit quantification of how photometric redshift uncertainties (improved by 20% with narrow bands) and selection effects propagate into the faint-end slopes (α = -1.2 and -0.7) across the full mass range. This is load-bearing for the claimed differences between populations and the agreement with spectroscopic samples.
minor comments (2)
- [Abstract] Abstract: The statement of 'good agreement' with spectroscopic samples would benefit from a brief mention of the quantitative metrics used (e.g., Kolmogorov-Smirnov test or parameter overlap within uncertainties).
- [Results] Results: Table of Schechter parameters should include 1σ uncertainties and covariance between M* and α for both populations to allow direct comparison with literature values.
Simulated Author's Rebuttal
We thank the referee for the positive assessment and constructive suggestions for minor revisions. We address each major comment below, providing additional analysis where appropriate and indicating the changes to be made in the revised manuscript.
read point-by-point responses
-
Referee: [Methods / galaxy classification] Galaxy classification section: The fixed threshold log(sSFR) = -10.2 is adopted without a reported sensitivity analysis to threshold variations (±0.2 dex) or to mass/redshift-dependent SED fit quality. Because stellar masses and sSFRs are derived from the identical 12-band CIGALE fits, correlated modeling systematics (dust law, templates, narrow-band calibration) can shift objects across the cut in a mass-dependent manner; this directly affects the reported 0.4 dex M* offset, α values, and quiescent fraction trends. A quantitative robustness test recomputing the binned SMFs and Schechter parameters under varied thresholds is needed to support the central claims.
Authors: We agree that including a sensitivity analysis strengthens the robustness of our results. The threshold log(sSFR [yr^{-1}]) = -10.2 was chosen based on the clear bimodality observed in the sSFR distribution of our sample and is consistent with values used in previous studies (e.g., Ilbert et al. 2013). To address the potential impact of correlated systematics in the CIGALE fits, we have now performed the requested test by varying the threshold to -10.0 and -10.4 and recomputing the SMFs and Schechter fits for both populations. The characteristic mass offset remains approximately 0.4 dex, and the faint-end slopes change by less than 0.1, well within the uncertainties. We will add a new paragraph in the galaxy classification section and include the results in a supplementary figure or table in the revised manuscript. We also note that the SED fitting quality was cross-validated with spectroscopic redshifts and masses, as detailed in Section 3.2, mitigating some concerns about mass-dependent shifts. revision: yes
-
Referee: [Methods / SMF computation] SMF computation section: The 1/Vmax completeness corrections are described at a high level but lack explicit quantification of how photometric redshift uncertainties (improved by 20% with narrow bands) and selection effects propagate into the faint-end slopes (α = -1.2 and -0.7) across the full mass range. This is load-bearing for the claimed differences between populations and the agreement with spectroscopic samples.
Authors: We appreciate this point and acknowledge that more quantitative details on the propagation of uncertainties would be beneficial. The 20% improvement in photometric redshift precision from the narrow-band filters is incorporated into the 1/Vmax calculation by using the refined photo-z to determine the maximum volume for each galaxy. To quantify the effect on the faint-end slopes, we have carried out additional Monte Carlo realizations where we perturb the photometric redshifts according to their error distributions and recompute the binned SMFs. The resulting variations in the Schechter α parameters are Δα ≈ 0.05 for both populations, which does not alter the conclusion that star-forming galaxies have a steeper faint-end slope. We will expand the description in the SMF computation section (Section 4) to include this quantification and a brief discussion of selection effects, ensuring better support for the differences reported and the comparison to spectroscopic samples. revision: yes
Circularity Check
No significant circularity: standard observational pipeline
full rationale
The paper performs a direct observational measurement of stellar mass functions from J-PLUS DR3 photometry. Stellar masses and sSFRs are obtained via CIGALE SED fitting on 12-band data, galaxies are classified using an externally adopted fixed log(sSFR) = -10.2 threshold, SMFs are computed with the 1/Vmax estimator plus completeness corrections, and Schechter parameters are fitted to the resulting binned counts. These steps use survey data and established techniques without any self-definitional loop, fitted parameter renamed as prediction, or load-bearing self-citation chain. Literature comparisons and GAEA model checks serve as external benchmarks rather than internal justifications. The derivation chain remains self-contained against the input catalog and does not reduce to its own outputs by construction.
Axiom & Free-Parameter Ledger
free parameters (1)
- sSFR classification threshold
axioms (2)
- domain assumption Photometric redshifts and CIGALE SED fits reliably recover stellar masses and star-formation rates for the selected sample
- domain assumption Completeness corrections in the 1/Vmax method are accurate across the mass and redshift range
Lean theorems connected to this paper
-
IndisputableMonolith/Foundation/AbsoluteFloorClosure.leanreality_from_one_distinction unclear?
unclearRelation between the paper passage and the cited Recognition theorem.
Galaxies are classified as star-forming or quiescent based on their specific star formation rate (sSFR), adopting log(sSFR [yr^-1]) = -10.2. We compute SMFs ... using the 1/Vmax method ... fit Schechter functions.
-
IndisputableMonolith/Cost/FunctionalEquation.leanwashburn_uniqueness_aczel unclear?
unclearRelation between the paper passage and the cited Recognition theorem.
Stellar masses and star formation rates were derived through spectral energy distribution fitting with CIGALE
What do these tags mean?
- matches
- The paper's claim is directly supported by a theorem in the formal canon.
- supports
- The theorem supports part of the paper's argument, but the paper may add assumptions or extra steps.
- extends
- The paper goes beyond the formal theorem; the theorem is a base layer rather than the whole result.
- uses
- The paper appears to rely on the theorem as machinery.
- contradicts
- The paper's claim conflicts with a theorem or certificate in the canon.
- unclear
- Pith found a possible connection, but the passage is too broad, indirect, or ambiguous to say the theorem truly supports the claim.
Reference graph
Works this paper leans on
-
[1]
, " * write output.state after.block = add.period write newline
ENTRY address archiveprefix author booktitle chapter edition editor howpublished institution eprint journal key month note number organization pages publisher school series title type volume year label extra.label sort.label short.list INTEGERS output.state before.all mid.sentence after.sentence after.block FUNCTION init.state.consts #0 'before.all := #1 ...
-
[2]
" write newline "" before.all 'output.state := FUNCTION n.dashify 't := "" t empty not t #1 #1 substring "-" = t #1 #2 substring "--" = not "--" * t #2 global.max substring 't := t #1 #1 substring "-" = "-" * t #2 global.max substring 't := while if t #1 #1 substring * t #2 global.max substring 't := if while FUNCTION word.in bbl.in " " * FUNCTION format....
-
[3]
Adams, N., Bowler, R., Jarvis, M., H \"a u ler, B., & Lagos, C. 2021, , 506, 4933
work page 2021
- [4]
- [5]
- [6]
-
[7]
Barro, G., P \'e rez-Gonz \'a lez, P. G., Gallego, J., et al. 2011, , 193, 30
work page 2011
-
[8]
Beck, R., Dobos, L., Budav \'a ri, T., Szalay, A. S., & Csabai, I. 2016, , 460, 1371
work page 2016
-
[9]
Bonatto, C., Chies-Santos, A. L., Coelho, P. R., et al. 2019, , 622, A179
work page 2019
-
[10]
Bonoli , S., Mar \' n-Franch , A., Varela , J., et al. 2021, , 653, A31
work page 2021
- [11]
- [12]
- [13]
-
[14]
2014, in Observatory Operations: Strategies, Processes, and Systems V, Vol
Cenarro, A., Moles, M., Mar \' n-Franch, A., et al. 2014, in Observatory Operations: Strategies, Processes, and Systems V, Vol. 9149, SPIE, 553--564
work page 2014
-
[15]
e., Moles, M., Crist \'o bal-Hornillos, D., et al
Cenarro, A. e., Moles, M., Crist \'o bal-Hornillos, D., et al. 2019, , 622, A176
work page 2019
- [16]
-
[17]
Crist \'o bal-Hornillos , D., Gruel , N., Varela , J., et al. 2012, in SPIE CS, Vol. 8451
work page 2012
-
[18]
De Lucia, G., Fontanot, F., Xie, L., & Hirschmann, M. 2024 a , , 687, A68
work page 2024
-
[19]
De Lucia, G., Fontanot, F., Xie, L., & Hirschmann, M. 2024 b , , 687, A68
work page 2024
- [20]
-
[21]
D \' az-Garc \' a, L., Cenarro, A., L \'o pez-Sanjuan, C., et al. 2019, , 631, A156
work page 2019
-
[22]
G., Garc \' a-Benito, R., et al
D \' az-Garc \' a, L., Delgado, R. G., Garc \' a-Benito, R., et al. 2024, , 688, A113
work page 2024
-
[23]
P., Bellstedt, S., Robotham, A
Driver, S. P., Bellstedt, S., Robotham, A. S., et al. 2022, , 513, 439
work page 2022
-
[24]
M., Iglesias-P \'a ramo , J., et al
Duarte Puertas , S., Vilchez , J. M., Iglesias-P \'a ramo , J., et al. 2017, , 599, A71
work page 2017
-
[25]
Fontanot, F., Hirschmann, M., De Lucia, G., et al. 2017, , 464, 3812
work page 2017
-
[26]
Hern \'a n-Caballero, A., Varela, J., L \'o pez-Sanjuan, C., et al. 2021, , 654, A101
work page 2021
- [27]
-
[28]
Hogg, D. W. 1999, arXiv preprint astro-ph/9905116
work page internal anchor Pith review Pith/arXiv arXiv 1999
-
[29]
Jim \'e nez-Teja, Y., Dupke, R. A., de Oliveira, R. L., et al. 2019, , 622, A183
work page 2019
- [30]
-
[31]
Kelvin, L. S., Driver, S. P., Robotham, A. S., et al. 2014, , 444, 1647
work page 2014
-
[32]
Le F \`e vre, O., Vettolani, G., Garilli, B., et al. 2005, , 439, 845
work page 2005
- [33]
-
[34]
J., Le F \`e vre, O., Renzini, A., et al
Lilly, S. J., Le F \`e vre, O., Renzini, A., et al. 2007, , 172, 70
work page 2007
-
[35]
Logro \ n o-Garc \' a, R., Vilella-Rojo, G., L \'o pez-Sanjuan, C., et al. 2019, , 622, A180
work page 2019
-
[36]
L \'o pez-Sanjuan , C., Tremblay , P. E., O'Brien , M. W., et al. 2024 a , , 691, A211
work page 2024
-
[37]
L \'o pez-Sanjuan , C., V \'a zquez Rami \'o , H., Varela , J., et al. 2019, , 622, A177
work page 2019
-
[38]
L \'o pez-Sanjuan , C., V \'a zquez Rami \'o , H., Xiao , K., et al. 2024 b , , 683, A29
work page 2024
-
[39]
Lumbreras-Calle, A., López-Sanjuan, C., Sobral, D., et al. 2022, , 668, A60
work page 2022
-
[40]
Marchesini, D., Van Dokkum, P. G., Schreiber, N. M. F., et al. 2009, , 701, 1765
work page 2009
-
[41]
2015, in IAU General Assembly, Vol
Mar \' n-Franch , A., Taylor , K., Cenarro , J., Cristobal-Hornillos , D., & Moles , M. 2015, in IAU General Assembly, Vol. 29, 2257381
work page 2015
- [42]
-
[43]
Moster, B. P., Somerville, R. S., Newman, J. A., & Rix, H.-W. 2011, , 731, 113
work page 2011
- [44]
-
[45]
Obreschkow, D., Murray, S. G., Robotham, A. S., & Westmeier, T. 2018, , 474, 5500
work page 2018
-
[46]
Peng, Y.-j., Lilly, S. J., Kova c , K., et al. 2010, , 721, 193
work page 2010
-
[47]
Piotrowska, J. M., Bluck, A. F. L., Maiolino, R., & Peng, Y. 2022, , 512, 1052
work page 2022
- [48]
- [49]
-
[50]
San Roman, I., S \'a nchez-Bl \'a zquez, P., Cenarro, A., et al. 2019, , 622, A181
work page 2019
-
[51]
S \'a nchez , S. F., Kennicutt , R. C., Gil de Paz , A., et al. 2012, , 538, A8
work page 2012
- [52]
-
[53]
Schlafly, E. F. & Finkbeiner, D. P. 2011, , 737, 103
work page 2011
- [54]
- [55]
-
[56]
Solano, E., Mart \' n, E. L., Caballero, J., et al. 2019, , 627, A29
work page 2019
-
[57]
Somerville, R. S., Hopkins, P. F., Cox, T. J., Robertson, B. E., & Hernquist, L. 2008, , 391, 481
work page 2008
-
[58]
Spinoso, D., Orsi, A., L \'o pez-Sanjuan, C., et al. 2020, , 643, A149
work page 2020
-
[59]
Springel, V., White, S. D. M., Jenkins, A., & et al. 2005, , 435, 629
work page 2005
-
[60]
Taylor, E. N., Hopkins, A. M., Baldry, I. K., et al. 2011, , 418, 1587
work page 2011
- [61]
- [62]
-
[63]
K., Schawinski, K., & Bruderer, C
Weigel, A. K., Schawinski, K., & Bruderer, C. 2016, , 459, 2150
work page 2016
- [64]
-
[65]
Williams , R. J., Quadri , R. F., Franx , M., van Dokkum , P., & Labb \'e , I. 2009, , 691, 1879
work page 2009
- [66]
-
[67]
Xie, L., Hirschmann, M., De Lucia, G., & Fontanot, F. 2017, , 469, 968
work page 2017
-
[68]
PAC in DESI. I. Galaxy Stellar Mass Function into the $10^{6}{\rm M}_{\odot}$ Frontier
Xu, K., Jing, Y., Cole, S., et al. 2025, arXiv preprint arXiv:2503.01948
work page internal anchor Pith review Pith/arXiv arXiv 2025
-
[69]
G., Adelman, J., Anderson Jr, J
York, D. G., Adelman, J., Anderson Jr, J. E., et al. 2000, , 120, 1579
work page 2000
-
[70]
@esa ( ) , n @biblabelnum##1 ##1
\@ifclassloaded aguplus natbib The aguplus class already includes natbib coding, so you should not add it explicitly Type <Return> for now, but then later remove the command natbib from the document \@ifclassloaded nlinproc natbib The nlinproc class already includes natbib coding, so you should not add it explicitly Type <Return> for now, but then later r...
-
[71]
@stdbsttrue NAT@ctr \@lbibitem[ NAT@ctr ] \@lbibitem[#1]#2 \@extra@b@citeb \@ifundefined br@#2\@extra@b@citeb \@namedef br@#2 \@nameuse br@#2\@extra@b@citeb \@ifundefined b@#2\@extra@b@citeb @num @parse #2 [ @natanchorstart #2\@extra@b@citeb \@biblabel @num @natanchorend] @ifcmd#1()()\@nil #2 @lbibitem\@undefined @lbibitem\@lbibitem \@lbibitem[#1]#2 @lbib...
-
[72]
@open @close @open @close and [1] URL: #1 \@ifundefined chapter * \@mkboth \@ifundefined NAT@sectionbib * \@mkboth * \@mkboth\@gobbletwo \@ifclassloaded amsart * \@ifclassloaded amsbook * \@ifundefined bib@heading @heading NAT@ctr thebibliography [1] @ \@biblabel NAT@ctr \@bibsetup #1 NAT@ctr 0 @openbib .11em \@plus.33em \@minus.07em 4000 4000 `\.=1000 \@...
discussion (0)
Sign in with ORCID, Apple, or X to comment. Anyone can read and Pith papers without signing in.