REVIEW 5 major objections 4 minor 1 cited by
Greener Deep Reinforcement Learning: Analysis of Energy and Carbon Efficiency Across Atari Benchmarks
T0 review · 5 major / 4 minor · reviewed 2026-08-15 · deepseek-v4-flash
Pith's one-line read A seven-algorithm Atari benchmark shows algorithmic choice alone changes a training run's energy use by a factor of about 4.5.
desk verdict Useful first energy benchmark for DRL, but the headline NPpkWh ranking is unsupported by the paper's own definition and numbers. read the letter →
The pith
A machine-rendered reading of the paper's core claim, the machinery that carries it, and where it could break.
The reading
What carries the argument
The measurement-and-normalization pipeline carries the argument. Power is read in real time per component, aggregated to total energy, converted to emissions using live grid carbon intensity, and priced using the U.S. national average electricity rate. The comparison metric, NPpkWh, divides each algorithm's average episodic reward by its total energy consumption, so a high value means the algorithm buys reward cheaply in energy terms. The paper uses that metric to rank algorithms and to trace efficiency back to algorithmic families: derivative-free random search avoids backpropagation, while trust-region and clipped-ratio policy gradients save energy through sample efficiency.
What would settle it
Run the same seven algorithms on the same ten games with several random seeds per algorithm-game pair and recompute median NPpkWh on the same hardware: if ARS is not the median top performer, or if the spread between ARS and QR-DQN shrinks dramatically, the paper's central ranking claim is not supported.
Extended reading notes
Core claim
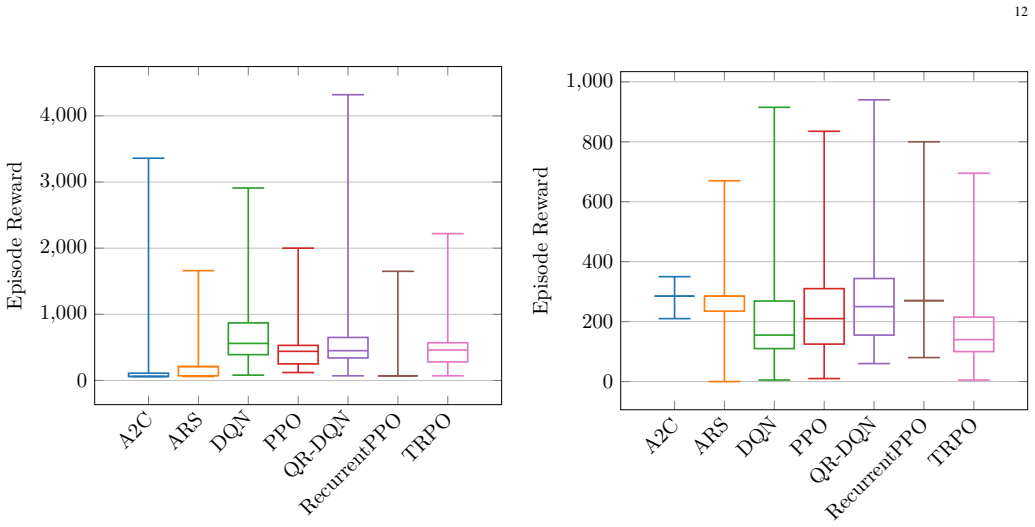
On its own terms, the paper's central claim is that algorithm choice alone produces large and consistent differences in energy consumption, CO2-equivalent emissions, and electricity cost across a standard Atari benchmark, with a single fixed workstation and one million training steps per game. ARS achieved the highest Average Normalized Performance per Kilowatt Hour (NPpkWh) at 0.08142, nearly 4.50 times the lowest value, QR-DQN at 0.01889. In aggregate, RecurrentPPO used the most energy (23.25 kWh) and emitted the most CO2 (17.11 kgCO2eq), while ARS used the least (2.83 kWh and 2.08 kgCO2eq). The paper also reports that TRPO won the most games on reward (5 of 10) while ARS won every game on lowest energy and emissions, and that reward and energy do not move together: RecurrentPPO and QR-DQN can reach high rewards while spending disproportionately more energy. The proposed explanation is that sample efficiency and stable learning dynamics, rather than per-step computational simplicity, drive energy efficiency.
Load-bearing premise
The load-bearing assumption is that one training run per algorithm and game represents that algorithm's true energy and reward behavior; deep RL results are seed-sensitive, so a different seed could reorder the measured efficiency ranking.
Editorial extensions
If this is right
- Researchers in dense-reward, structured tasks can expect severalfold energy and cost reductions by using derivative-free policy search instead of deep value-based methods, without necessarily sacrificing reward.
- Adding NPpkWh to standard reporting would make energy a first-class evaluation axis, allowing cost-per-performance comparisons across papers.
- The savings multiply with scale: the paper estimates replacing a RecurrentPPO run with an ARS run over 100 million steps saves about $2,861 in electricity at U.S. national average rates.
- Because sample efficiency predicted low energy use better than per-step cost, future greener-DRL work should target sample efficiency as well as network size.
- Algorithms with stable reward trajectories tend to need fewer redundant training steps, so stability metrics can serve as proxy indicators of energy efficiency.
Reading between the lines
- I infer the exact ranking is hardware- and seed-specific; the robust finding is the existence of a large efficiency spread, not the precise ordering.
- A multi-seed, multi-hardware version of this benchmark would likely be more valuable than the single-run result, and would tell whether the spread compresses or grows.
- ARS's advantage is probably domain-limited: in sparse-reward or high-dimensional tasks, gradient-based methods' ability to exploit small reward signals likely erodes the gap.
- Energy reporting could be inserted into standard RL benchmark workflows at almost no additional cost, making sustainability comparisons routine.
Signed reviews
Editorial analysis
A structured set of objections, weighed in public.
Referee Report
Summary. This paper presents an empirical benchmark of seven deep reinforcement learning algorithms (DQN, TRPO, A2C, ARS, PPO, RecurrentPPO, and QR-DQN) trained for one million steps on ten Atari 2600 games, with real-time power measurement used to estimate total energy consumption, CO2-equivalent emissions, and electricity cost. The authors define a metric, NPpkWh (average episodic reward divided by total energy consumption), and use it to rank the algorithms, reporting that ARS is the most energy-efficient (about 4.5x more efficient than QR-DQN) and that RecurrentPPO is generally the most energy-intensive. The paper also analyzes reward stability, training time, and cost trade-offs, and it concludes that algorithmic choice alone can yield substantial differences in energy, emissions, and monetary cost under identical hardware and software. The limitations section acknowledges the use of a single training seed per algorithm-game pair and a fixed hardware configuration.
Significance. If the numerical results were corrected and reproducible, this would be a useful empirical contribution to the Green AI literature for reinforcement learning, an area that has received less systematic study than LLM training. The authors provide detailed per-game tables, use standard external measurement tools (CodeCarbon/pyRAPL and nvidia-smi), and connect their measurements to real carbon-intensity and electricity-price data. The win-summary table is a helpful at-a-glance addition, and the paper does not rely on derived equations or fitted parameters, so circularity is not a concern. However, the central algorithmic ranking and the headline quantitative claims are currently not supported by the paper's own stated metric and data, and several internal arithmetic inconsistencies need to be resolved before the findings can be accepted.
major comments (5)
- [Section IV, Table I] Section IV defines NPpkWh as 'dividing the average episodic reward achieved by each model by its total energy consumption.' Using the aggregate values in Table III, this definition gives TRPO = 2459.14/10.96 ≈ 224.4 reward/kWh and ARS = 606.04/2.83 ≈ 214.2 reward/kWh, so TRPO, not ARS, would be the most efficient under the stated definition. Table I instead reports ARS (0.08142) above TRPO (0.04838) and claims a 4.50x/4.30x advantage over QR-DQN, but no normalization formula, per-game scaling, or baseline is specified in Section IV or in the table notes. Please state the exact NPpkWh formula, provide the per-game normalized values, and reconcile Table I with Table III; the current headline ranking is not derivable from the paper's own definition and data.
- [Abstract, Table III] The abstract's '24% less energy (ARS vs. DQN)' is contradicted by Table III, where ARS consumes 2.83 kWh versus DQN's 11.60 kWh, a 75.6% reduction. The abstract's claims of 'nearly 68% less CO2' and '68% lower monetary cost (QR-DQN vs. RecurrentPPO)' are also not supported by Table III: emissions are 11.68 vs. 17.11 kgCO2eq (about 31.7% lower) and national costs are $22.26 vs. $32.57 (also about 31.7% lower). Please correct the abstract or clarify the exact comparison basis for each claimed percentage.
- [Table III, Section V] The Cost (National) column in Table III is inconsistent with the stated U.S. national average electricity price of $0.1401/kWh. For example, A2C should cost 14.16 kWh × $0.1401/kWh = $1.98, not $19.84, and every national cost in Tables III through XIII is larger by a factor of ten than the product of the listed energy and $0.1401/kWh, implying that the authors actually multiplied by $1.401/kWh. This factor-of-ten error propagates to the Section V scaling example (the claimed $2,861 savings over 100 million steps) and to the abstract's cost claims; all cost figures and derived statements should be recomputed.
- [Section V, Limitations] The paper acknowledges in Section V that it uses 'a single training seed per run,' yet the central claims are algorithm-level rankings, such as 'ARS achieved the highest NPpkWh' and 'RecurrentPPO consistently incurs the highest energy usage.' Given the well-documented variance of deep reinforcement learning training, one seed per algorithm-game pair cannot support these ranking claims without confidence intervals or multiple-seed averages. Either add multi-seed runs, report per-cell variance, or substantially soften the ranking claims to reflect the sampling premise.
- [Section IV, Methodology] Section IV states that power was 'measured separately for the CPU, RAM, and GPU, and then aggregated,' but it does not specify the sampling frequency, the integration method used to convert power samples to kWh, the treatment of idle or background power, or how the RAPL and nvidia-smi measurements are combined into a single system energy value. Without this measurement protocol, the energy, emission, and cost numbers in Tables III through XIII are not independently reproducible, which is a prerequisite for a benchmarking study of this type.
minor comments (4)
- [Section I, Section IV] The text states that 'eight' algorithms were benchmarked, but the enumerated list contains seven algorithms (DQN, TRPO, A2C, ARS, PPO, RecurrentPPO, and QR-DQN); please correct the count consistently throughout the paper.
- [Section IV] The phrase 'Tables tables IV to XIII' should be 'Tables IV to XIII'.
- [Figure 21] Figure 21 (Video Pinball, binned) omits TRPO from the legend even though TRPO has the highest reported average reward for that game in Table XIII; please add the missing series or explain its omission.
- [Section IV, Section III-C] The methodology says that 'default SB3 policy implementations' were used with MlpPolicy for most models, but standard Atari benchmarks typically use convolutional policies and ARS uses a linear policy; please state explicitly which policy architecture was used for each algorithm, since architecture directly affects energy measurements and comparability with prior work.
Circularity Check
No circular derivation: the energy and reward values are external measurements, and NPpkWh is an explicit ratio of those measurements rather than a fitted or self-referential quantity.
full rationale
This is a measurement and benchmarking study with no fitted parameters, no equations whose outputs are fed back as inputs, and no load-bearing self-citation. The central metric, NPpkWh, is explicitly defined in Section IV as 'dividing the average episodic reward achieved by each model by its total energy consumption'; every ranking in Tables I-III follows from measured rewards, measured energy, and external carbon and cost data, so the conclusions are not forced by the paper's own definitions in a circular manner. The only self-citation (reference [27], an IROS paper by some of the same authors) is used as an example of DRL in robotics and plays no role in the energy-efficiency argument. The paper itself states limitations of single-seed runs and fixed hardware, which are statistical-generalizability concerns rather than circularity. A separate correctness concern, but not a circularity one, is that the NPpkWh values in Table I do not reproduce from the stated formula when applied to the aggregate Table III values (e.g., raw reward/energy would rank TRPO above ARS); that is an internal-consistency and reproducibility issue, not a reduction of a prediction to its inputs. Because no claim in the paper is derived from the claim itself or from a self-citation chain, the circularity score is 0.
Assumptions & free parameters
assumptions (4)
- domain assumption CPU, RAM, and GPU power measured by CodeCarbon RAPL and nvidia-smi are accurate and comparable across algorithms.
- domain assumption A single training seed per algorithm-game pair supports the reported ranking.
- ad hoc to paper NPpkWh, defined as average episodic reward divided by total energy, is a meaningful normalized metric.
- domain assumption U.S. national average electricity price and Electricity Maps carbon intensity represent training conditions.
Cite this review
Pith. "Pith review of Greener Deep Reinforcement Learning: Analysis of Energy and Carbon Efficiency Across Atari Benchmarks." pith.science (2026). https://pith.science/paper/HCI72ERZ
@misc{pith2026250905273,
  author       = {Pith},
  title        = {Pith review of: Greener Deep Reinforcement Learning: Analysis of Energy and Carbon Efficiency Across Atari Benchmarks},
  year         = {2026},
  howpublished = {\url{https://pith.science/paper/HCI72ERZ}},
  note         = {Machine review of arXiv:2509.05273}
}
read the original abstract
The growing computational demands of deep reinforcement learning (DRL) have raised concerns about the environmental and economic costs of training large-scale models. While algorithmic efficiency in terms of learning performance has been extensively studied, the energy requirements, greenhouse gas emissions, and monetary costs of DRL algorithms remain largely unexplored. In this work, we present a systematic benchmarking study of the energy consumption of seven state-of-the-art DRL algorithms, namely DQN, TRPO, A2C, ARS, PPO, RecurrentPPO, and QR-DQN, implemented using Stable Baselines. Each algorithm was trained for one million steps each on ten Atari 2600 games, and power consumption was measured in real-time to estimate total energy usage, CO2-Equivalent emissions, and electricity cost based on the U.S. national average electricity price. Our results reveal substantial variation in energy efficiency and training cost across algorithms, with some achieving comparable performance while consuming up to 24% less energy (ARS vs. DQN), emitting nearly 68% less CO2, and incurring almost 68% lower monetary cost (QR-DQN vs. RecurrentPPO) than less efficient counterparts. We further analyze the trade-offs between learning performance, training time, energy use, and financial cost, highlighting cases where algorithmic choices can mitigate environmental and economic impact without sacrificing learning performance. This study provides actionable insights for developing energy-aware and cost-efficient DRL practices and establishes a foundation for incorporating sustainability considerations into future algorithmic design and evaluation.
Figures


Figures from the paper (14 more)



Forward citations
Cited by 1 Pith paper
-
Octax: Accelerated CHIP-8 Arcade Environments for Reinforcement Learning in JAX
Octax is a JAX-based CHIP-8 emulator that runs thousands of parallel arcade environments on GPUs (350k steps/s) and supports LLM-generated games for RL training.
Reference graph
Works this paper leans on
-
[1]
Monthly energy review december 2024,
A. Sun, J. Zaidi, M. Kopalek, W. Colson, T. Shear, M. Bradbury, A. Gorski, and E. Harrison, “Monthly energy review december 2024,” U.S. Energy Information Administration, Tech. Rep., 2024. [Online]. Available: www.eia.gov/mer
work page 2024
-
[2]
The real climate and transformative impact of ICT: A critique of estimates, trends, and regulations,
C. Freitag, M. Berners-Lee, K. Widdicks, B. Knowles, G. S. Blair, and A. Friday, “The real climate and transformative impact of ICT: A critique of estimates, trends, and regulations,”Patterns, vol. 2, no. 9, p. 100340,
-
[3]
Powering intelligence: Analyzing artificial intelligence and data center energy consumption,
J. Alijbour, T. Wilson, and P. Poorvi, “Powering intelligence: Analyzing artificial intelligence and data center energy consumption,” Electric Power Research Institute (EPRI), Tech. Rep., 05 2024. [Online]. Available: https://www.epri.com/research/products/3002028905
arXiv 2024
-
[4]
llama-models/models/llama3 1/MODEL CARD.md at main - meta-llama/llama-models,
meta-llama, “llama-models/models/llama3 1/MODEL CARD.md at main - meta-llama/llama-models,” GitHub, 2024. [Online]. Avail- able: https://github.com/meta-llama/llama-models/blob/main/models/ llama3 1/MODEL CARD.md
work page 2024
-
[5]
llama-models/models/llama3 3/MODEL CARD.md at main - meta-llama/llama-models,
——, “llama-models/models/llama3 3/MODEL CARD.md at main - meta-llama/llama-models,” GitHub, 2024. [Online]. Avail- able: https://github.com/meta-llama/llama-models/blob/main/models/ llama3 3/MODEL CARD.md
work page 2024
-
[6]
Estimating the carbon footprint of bloom, a 176b parameter language model,
A. S. Luccioni, S. Viguier, and A.-L. Ligozat, “Estimating the carbon footprint of bloom, a 176b parameter language model,”Journal of Machine Learning Research (JMLR), vol. 24, no. 1, Mar. 2024. [Online]. Available: https://doi.org/10.48550/arXiv.2211.02001
-
[7]
Google 2024 sustainability report,
Google, “Google 2024 sustainability report,” Google Sustainability,
work page 2024
-
[8]
Ai index report — stanford human-centered artificial intelligence
Stanford University, “Ai index report — stanford human-centered artificial intelligence.” [Online]. Available: https://hai.stanford.edu/ research/ai-index-report
Show all 41 references
-
[9]
A single modern AI GPU consumes up to 3.7 MWh of power per year — GPUs sold last year alone consumed more power than 1.3 million homes — tomshardware.com,
“A single modern AI GPU consumes up to 3.7 MWh of power per year — GPUs sold last year alone consumed more power than 1.3 million homes — tomshardware.com,” https://www.tomshardware.com/desktops/servers/a-single-modern-ai- gpu-consumes-up-to-37-mwh-of-power-per-year-gpus-sold-...
2024
-
[10]
Energy and policy con- siderations for modern deep learning research,
E. Strubell, A. Ganesh, and A. McCallum, “Energy and policy con- siderations for modern deep learning research,” inProceedings of the AAAI conference on artificial intelligence, vol. 34, no. 09, 2020, pp. 13 693–13 696
2020
-
[11]
The carbon footprint of machine learning training will plateau, then shrink,
D. Patterson, J. Gonzalez, U. H ¨olzle, Q. Le, C. Liang, L.-M. Munguia, D. Rothchild, D. R. So, M. Texier, and J. Dean, “The carbon footprint of machine learning training will plateau, then shrink,”Computer, vol. 55, no. 7, pp. 18–28, 2022
2022
-
[12]
Green ai,
R. Schwartz, J. Dodge, N. A. Smith, and O. Etzioni, “Green ai,” Communications of the ACM, vol. 63, no. 12, pp. 54–63, 2020
2020
-
[13]
Sustainable ai: Environmental implications, challenges and opportunities,
C.-J. Wu, R. Raghavendra, U. Gupta, B. Acun, N. Ardalani, K. Maeng, G. Chang, F. Aga, J. Huang, C. Baiet al., “Sustainable ai: Environmental implications, challenges and opportunities,”Proceedings of machine learning and systems, vol. 4, pp. 795–813, 2022
2022
-
[14]
Deep reinforcement learning that matters,
P. Henderson, R. Islam, P. Bachman, J. Pineau, D. Precup, and D. Meger, “Deep reinforcement learning that matters,” inProceedings of the AAAI conference on artificial intelligence, vol. 32, no. 1, 2018
2018
-
[15]
Implementation matters in deep policy gradients: A case study on ppo and trpo,
L. Engstrom, A. Ilyas, S. Santurkar, D. Tsipras, F. Janoos, L. Rudolph, and A. Madry, “Implementation matters in deep policy gradients: A case study on ppo and trpo,”arXiv preprint arXiv:2005.12729, 2020
2005 arXiv
-
[16]
Reproducibil- ity of benchmarked deep reinforcement learning tasks for continuous control,
R. Islam, P. Henderson, M. Gomrokchi, and D. Precup, “Reproducibil- ity of benchmarked deep reinforcement learning tasks for continuous control,”arXiv preprint arXiv:1708.04133, 2017
2017 arXiv
-
[17]
Towards the systematic reporting of the energy and carbon footprints of machine learning,
P. Henderson, J. Hu, J. Romoff, E. Brunskill, D. Jurafsky, and J. Pineau, “Towards the systematic reporting of the energy and carbon footprints of machine learning,”Journal of Machine Learning Research, vol. 21, no. 248, pp. 1–43, 2020
2020
-
[18]
Human-level control through deep reinforcement learning,
V . Mnih, K. Kavukcuoglu, D. Silver, A. A. Rusu, J. Veness, M. G. Bellemare, A. Graves, M. Riedmiller, A. K. Fidjeland, G. Ostrovski et al., “Human-level control through deep reinforcement learning,” Nature, vol. 518, no. 7540, pp. 529–533, 2015. [Online]. Available: https://d...
2015 doi
-
[19]
Distributional reinforcement learning with quantile regression,
W. Dabney, M. Rowland, M. Bellemare, and R. Munos, “Distributional reinforcement learning with quantile regression,” inProceedings of the AAAI conference on artificial intelligence, vol. 32, no. 1, 2018. [Online]. Available: https://doi.org/10.48550/arXiv.1710.10044
-
[20]
Asynchronous methods for deep reinforcement learning,
V . Mnih, A. P. Badia, M. Mirza, A. Graves, T. Lillicrap, T. Harley, D. Silver, and K. Kavukcuoglu, “Asynchronous methods for deep reinforcement learning,” inProceedings of The 33rd International Conference on Machine Learning, ser. Proceedings of Machine Learning Research, M....
2016
-
[21]
Proximal policy optimization algorithms,
J. Schulman, F. Wolski, P. Dhariwal, A. Radford, and O. Klimov, “Proximal policy optimization algorithms,”CoRR, vol. abs/1707.06347, 07 2017. [Online]. Available: http://arxiv.org/abs/1707.06347
2017 arXiv
-
[22]
Trust region policy optimization,
J. Schulman, S. Levine, P. Abbeel, M. Jordan, and P. Moritz, “Trust region policy optimization,” inProceedings of the 32nd International Conference on Machine Learning, ser. Proceedings of Machine Learning Research, F. Bach and D. Blei, Eds., vol. 37. Lille, France: PMLR, 07–0...
2015
-
[23]
Simple random search of static linear policies is competitive for reinforcement learning,
H. Mania, A. Guy, and B. Recht, “Simple random search of static linear policies is competitive for reinforcement learning,” in Advances in Neural Information Processing Systems, S. Bengio, H. Wallach, H. Larochelle, K. Grauman, N. Cesa-Bianchi, and R. Garnett, Eds., vol. 31. C...
2018
-
[24]
Impala: Scalable dis- tributed deep-rl with importance weighted actor-learner architectures,
L. Espeholt, H. Soyer, R. Munos, K. Simonyan, V . Mnih, T. Ward, Y . Doron, V . Firoiu, T. Harley, I. Dunninget al., “Impala: Scalable dis- tributed deep-rl with importance weighted actor-learner architectures,” inInternational conference on machine learning. PMLR, 2018, pp. 1407–1416
2018
-
[25]
Phasic policy gradient,
K. W. Cobbe, J. Hilton, O. Klimov, and J. Schulman, “Phasic policy gradient,” inInternational Conference on Machine Learning. PMLR, 2021, pp. 2020–2027
2021
-
[26]
Deep reinforcement learning with double q-learning,
H. v. Hasselt, A. Guez, and D. Silver, “Deep reinforcement learning with double q-learning,” inProceedings of the Thirtieth AAAI Conference on Artificial Intelligence, ser. AAAI’16. AAAI Press, 2016, p. 2094–2100. [Online]. Available: https://doi.org/10.48550/arXiv.1509.06461
-
[27]
Gdm-net: Gas distribution mapping with a mobile robot using deep reinforcement learning and gaussian process regression,
I. Kulbaka, A. Dutta, O. P. Kreidl, L. B ¨ol¨oni, and S. Roy, “Gdm-net: Gas distribution mapping with a mobile robot using deep reinforcement learning and gaussian process regression,” in2024 IEEE/RSJ Interna- tional Conference on Intelligent Robots and Systems (IROS). IEEE, 2...
2024
-
[28]
Deep reinforcement learning for autonomous driving: A survey,
B. R. Kiran, I. Sobh, V . Talpaert, P. Mannion, A. A. Al Sallab, S. Yo- gamani, and P. P ´erez, “Deep reinforcement learning for autonomous driving: A survey,”IEEE Transactions on Intelligent Transportation Systems, 2021
2021
-
[29]
Stable-Baselines3: Reliable reinforcement learning implementations,
A. Raffin, A. Hill, A. Gleave, A. Kanervisto, M. Ernestus, and N. Dormann, “Stable-Baselines3: Reliable reinforcement learning implementations,”Journal of Machine Learning Research, vol. 22, no. 268, pp. 1–8, 2021. [Online]. Available: http://jmlr.org/papers/v22/20- 1364.html
2021
-
[30]
Gymnasium: A standard interface for reinforcement learning environments,
A. Kwiatkowski, M. Towers, J. Terry, J. U. Balis, G. D. Cola, T. Deleu, M. Goul ˜ao, A. Kallinteris, M. Krimmel, A. KG, R. Perez-Vicente, A. Pierr´e, S. Schulhoff, J. J. Tai, H. Tan, and O. G. Younis, “Gymnasium: A standard interface for reinforcement learning environments,” 2...
-
[31]
TensorFlow: Large-scale machine learning on heterogeneous systems,
M. Abadi, A. Agarwal, P. Barham, E. Brevdo, Z. Chen, C. Citro, G. S. Corrado, A. Davis, J. Dean, M. Devin, S. Ghemawat, I. Goodfellow, A. Harp, G. Irving, M. Isard, Y . Jia, R. Jozefowicz, L. Kaiser, M. Kudlur, J. Levenberg, D. Man ´e, R. Monga, S. Moore, D. Murray, C. Olah, M...
2015
-
[32]
Scalable parallel programming with cuda,
J. Nickolls, I. Buck, M. Garland, and K. Skadron, “Scalable parallel programming with cuda,” inACM SIGGRAPH 2008 Classes, ser. SIGGRAPH ’08. New York, NY , USA: Association for Computing Machinery, 2008. [Online]. Available: https://doi.org/10.1145/1401132. 1401152
2008 doi
-
[33]
mlco2/codecarbon: v2.4.1,
B. Courty, V . Schmidt, S. Luccioni, Goyal-Kamal, MarionCoutarel, B. Feld, J. Lecourt, LiamConnell, A. Saboni, Inimaz, supatomic, M. L ´eval, L. Blanche, A. Cruveiller, ouminasara, F. Zhao, A. Joshi, A. Bogroff, H. de Lavoreille, N. Laskaris, E. Abati, D. Blank, Z. Wang, A. Ca...
2024 doi
-
[34]
United states of america 2024 carbon intensity data,
Electricity Maps, “United states of america 2024 carbon intensity data,” 2024, v3 API at https://api.electricitymap.org/v3/carbon-intensity/latest. [Online]. Available: https://www.electricitymaps.com/
2024
-
[35]
The arcade learning environment: An evaluation platform for general agents,
M. G. Bellemare, Y . Naddaf, J. Veness, and M. Bowling, “The arcade learning environment: An evaluation platform for general agents,” Journal of Artificial Intelligence Research, vol. 47, pp. 253–279, jun
-
[36]
Rl algorithms — stable baselines 2.10.3a0 documentation
Stable Baselines 3, “Rl algorithms — stable baselines 2.10.3a0 documentation.” [Online]. Available: https://stable-baselines. readthedocs.io/en/master/guide/algos.html#reproducibility
-
[37]
Average energy prices for the united states, regions, census divisions, and selected metropolitan areas : Midwest information office : U.s. bureau of labor statistics
U.S. Bureau of Labor Statistics (BLS), “Average energy prices for the united states, regions, census divisions, and selected metropolitan areas : Midwest information office : U.s. bureau of labor statistics.” [Online]. Available: https://www.bls.gov/regions/midwest/ data/avera...
-
[38]
Rates — my account — local
Local Energy Authority, “Rates — my account — local.” [Online]. Available: hidden
-
[2013]
Available: https://doi.org/10.1613/jair.3912
[Online]. Available: https://doi.org/10.1613/jair.3912
-
[2021]
Available: https://doi.org/10.1016/j.patter.2021.100340
[Online]. Available: https://doi.org/10.1016/j.patter.2021.100340
2021
-
[2024]
Available: https://sustainability.google/reports/
[Online]. Available: https://sustainability.google/reports/
Reviewed August 15, 2026 · model on record in the stance chip above.
Discussion (0). Continue with ORCID to comment.