REVIEW 4 major objections 7 minor 45 references
PLanTS: Periodicity-aware Latent-state Representation Learning for Multivariate Time Series
T0 review · 4 major / 7 minor · reviewed 2026-08-05 · deepseek-v4-flash
Pith's one-line read PLanTS sizes time-series patches from FFT-detected periodicities and learns latent states with their transitions, claiming gains over contrastive baselines across classification, forecasting, ECG labeling, and anomaly detection.
desk verdict Solid classification story undermined by a forecasting inconsistency: the reported PLanTS numbers are the fixed-window ablation, and the paper's own ablation shows the periodicity mechanism hurts forecasting. read the letter →
The pith
A machine-rendered reading of the paper's core claim, the machinery that carries it, and where it could break.
The reading
What carries the argument
The argument is carried by four components working together. The periodicity-aware multi-granularity patching rule — w_j = ceil(L/f_j) for the top-K FFT frequencies — chooses the window sizes that contrastive pairs are built from, replacing a fixed window hyperparameter. Maximum Cross-Correlation (MXCorr) computes input-space similarity between windows and supplies soft, continuous targets for the generalized contrastive loss, generalizing hard InfoNCE positives and negatives. The Latent State Encoder (LSE) learns state embeddings under that loss, while the Dynamic Transition Encoder (DTE) is trained by the next-transition prediction task, which predicts v^(m+1) from the concatenation of u^m
What would settle it
Run PLanTS on a dataset with known state durations (for instance, human-activity segments) and compare the FFT-selected window sizes w_j with the true segment lengths: if the dominant periods do not track the state scale yet accuracy is unchanged, the patching premise is not doing the work. A cheaper check already sits inside the paper: Table 4 shows the fixed-window ablation lowers MSE on ETTh1, ETTh2, and ETTm1, so rerunning those ablations across seeds would show whether periodicity-aware patching helps forecasting at all.
Extended reading notes
Core claim
The central claim, on the paper's own terms, is that periodicity-aware latent-state modeling is what makes self-supervised representations of multivariate time series transfer across tasks. Concretely, PLanTS computes the FFT amplitude spectrum averaged over channels, keeps the top-K frequencies, and sets the patch length for each granularity to w_j = ceil(L/f_j); the resulting multi-granularity patches are encoded by a Latent State Encoder trained with a multi-granularity generalized contrastive loss whose soft targets are input-space Maximum Cross-Correlation scores, and by a Dynamic Transition Encoder trained to predict the next window's transition embedding from the current state and tra
Load-bearing premise
The load-bearing premise is that dominant FFT frequencies mark the time scales at which latent states change, so patch sizes w_j = ceil(L/f_j) align with real state transitions; the paper's own ablation shows a fixed window of 50 beats the FFT-sized ones on three of four forecasting datasets, and the main forecasting runs used fixed windows, so this premise is only exercised in classification and trajectory tasks.
Editorial extensions
If this is right
- On the 30-dataset UEA archive, average classification accuracy rises to 0.720 with the best average rank among the eight SSL baselines, so linear readouts of PLanTS embeddings beat those from TS2Vec, T-Rep, TNC, and SoftCLT (Table 1).
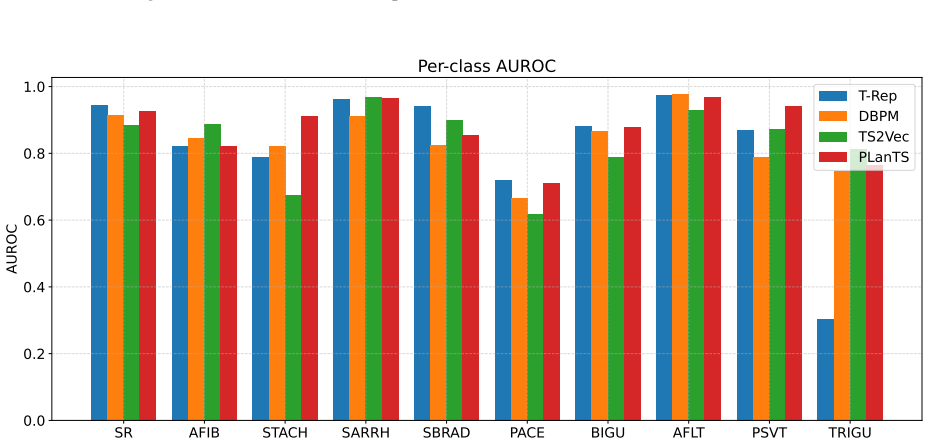
- On PTB-XL, the largest public clinical ECG corpus, AUROC improves on all three multi-label tasks — Diagnostic 0.836 to 0.852, Form 0.768 to 0.784, Rhythm 0.838 to 0.863 — so the representations capture fine-grained clinical semantics without supervised labels.
- On the ETT benchmarks, PLanTS ranks first in 11 of 16 MSE settings and cuts MSE by 7.2% (ETTh1) and 9.1% (ETTm1) against the strongest baseline, indicating transition modeling transfers to forecasting.
- On Yahoo anomaly detection, F1 reaches 77.3-77.4 across normal and cold-start settings, roughly two points above SoftCLT and TS2Vec, so the same encoder serves detection tasks.
- Training scales without a precomputed similarity matrix: at sequence length 256, end-to-end training takes about 111 seconds versus roughly 715 seconds total for SoftCLT, a saving the paper puts at 64%.
Reading between the lines
- The ablation evidence narrows where the mechanism helps: a fixed window of 50 beats the FFT-selected patches on three of four ETT forecasting sets, so the periodicity patching looks load-bearing for classification and trajectory tasks but not for forecasting, where the gains likely come from the soft contrastive and next-transition objectives instead.
- Because the soft targets are raw-input MXCorr scores, the method implicitly bets that cross-correlation in the input space tracks semantic state similarity; a natural extension would compute the similarity in a learned frequency-domain embedding, which could help where noise or phase shifts dominate raw correlation.
- A direct test of the latent-state hypothesis is available: on data with known state durations (HAR, gait cycles, clinical episodes), compare the FFT-selected window sizes against the true segment-length distribution; if accuracy tracks the true scale rather than the dominant periods, periodicity detection is not the active ingredient.
- The next-transition head is effectively a one-step world model of the representation trajectory; the paper does not exploit it at inference, but the trained prediction head could serve as a cheap autoregressive forecaster of embeddings, a testable extension for long-horizon tasks.
Editorial analysis
A structured set of objections, weighed in public.
Referee Report
Summary. PLanTS is a self-supervised representation-learning framework for multivariate time series. Its main proposals are a periodicity-aware, multi-granularity patching mechanism driven by FFT-selected periods (Eq. 1, §3.2), a generalized contrastive loss with Maximum Cross-Correlation (MXCorr) soft targets (§3.3), and a next-transition prediction pretext task (§3.4). The paper evaluates the learned representations on 30 UEA classification datasets, PTB-XL multi-label classification, ETT forecasting, trajectory tracking, and Yahoo anomaly detection, reporting consistent gains over SSL baselines and state-of-the-art results.
Significance. If the reported results are valid, PLanTS would be a useful contribution: the paper covers a wide range of downstream tasks, includes a large-scale ECG benchmark, provides code, and gives a runtime comparison showing clear advantages over DTW-based SoftCLT. However, the forecasting evidence—a central component of the paper's headline claims—is inconsistent with the method description. The numbers reported for 'PLanTS' in Table 3 are identical to the 'w/o multi-granularity patching' ablation in Table 4, and Appendix B states that forecasting is run with a fixed window of 50, i.e., without the proposed periodicity-aware patching. Moreover, the paper's own ablation shows the full multi-granularity model is worse than the fixed-window variant on three of four ETT datasets. These issues undermine the abstract's claim of consistent improvement and the paper's overall conclusion.
major comments (4)
- [Table 3 vs. Table 4 and Appendix B] The 'PLanTS' column in Table 3 reports MSE 0.708, 1.685, 0.531, 0.885 on ETTh1, ETTh2, ETTm1, ETTm2. The 'w/o multi-granularity patching' row in Table 4 reports exactly the same values. Appendix B confirms that forecasting uses a fixed window size of 50, replacing the periodicity-aware multi-granularity patching. Thus the headline forecasting results are produced by the ablation that removes the paper's core mechanism. The claimed 7.2%/9.1% improvements over T-Rep on ETTh1/ETTm1 are therefore not attributable to PLanTS as defined in §3.2, and the comparison in Table 3 is not a valid evaluation of the proposed method.
- [§4.3, Table 4] The full PLanTS model (with multi-granularity patching) has MSE 0.729, 1.796, 0.595, 0.844 on the four ETT datasets, while the fixed-window ablation achieves 0.708, 1.685, 0.531, 0.885. That is, the proposed patching mechanism is strictly worse on ETTh1, ETTh2, and ETTm1, and better only on ETTm2. The paper acknowledges this in the ablation discussion, but it is in direct tension with the abstract's 'consistently improves' and with §4.3's statement that PLanTS achieves 'the best average performance.' The forecasting experiments cannot be used to support the paper's central claim.
- [Appendix B, Table 5] The periodicity-aware multi-granularity patching is applied only in the Classification and Trajectory Tracking settings (K=3). For Multi-label Classification and Forecasting, the paper replaces it with fixed windows [20,30] and 50, respectively. Consequently, two of the five evaluation families—including the large PTB-XL study and the ETT forecasting study—do not exercise the proposed patching mechanism. The paper should clearly separate results obtained with the full model from those obtained with a fixed-window variant, and must not present the latter as PLanTS without qualification.
- [§3.3, Appendix D] The soft target distributions in Eqs. (3)–(4) are computed via MXCorr on the same input windows that are fed to the encoder. Appendix D demonstrates that the local loss equals the KL divergence between the predicted softmax and this input-space MXCorr distribution. This means the contrastive objective is effectively distilling a handcrafted input-space similarity, not learning against an external or independent signal. The assumption that MXCorr similarity corresponds to latent-state semantic similarity is stated but not validated. I would like to see a concrete test—e.g., correlation with ground-truth state labels on a dataset with known states, or an ablation comparing MXCorr with other similarity measures—before the 'latent state' claim is accepted.
minor comments (7)
- [Throughout] The paper inconsistently uses 'PLanTS' and 'PlanTS'; the latter appears in the abstract, contributions, and conclusion.
- [§1, Contributions] Typo: 'The contributions of out work' should be 'our work'.
- [Appendix E] Typo: 'SpftCLT' should be 'SoftCLT'.
- [Appendix F] Typo: 'We preform' should be 'We perform'.
- [Appendix A] Typo: 'data spliting rate' should be 'data splitting rate'.
- [Table 5] The hyperparameter table is difficult to parse: the 'K' row appears to merge with the 'window size' entries, and it is unclear which configuration applies to Anomaly Detection. Please restructure the table so each task has a clear column.
- [§4.3] The phrase 'following the protocol described in the [Appendix]' has a missing cross-reference; specify the exact appendix section.
Circularity Check
The forecasting results attributed to PLanTS are numerically identical to the paper's own 'w/o multi-granularity patching' ablation, so the headline forecasting evidence reduces by construction to the configuration that removes the core periodicity-aware mechanism.
-
self definitional
[Appendix B / Table 5; Section 4.5 / Table 4; Section 4.3 / Table 3]
"Appendix B: 'For Multi-label Classification and Forecasting, we replace K with fixed window sizes: [20, 30] for multi-label classification and 50 for forecasting.' Section 4.5: 'w/o multi-granularity patching: removes the periodicity-aware multi-granularity patching mechanism and segments inputs into non-overlapping patches using a fixed window size of 50.'"
By the paper's own hyperparameter definition, the 'PLanTS' forecasting configuration uses exactly the fixed window size (50) that defines the 'w/o multi-granularity patching' ablation. Consequently, Table 3's PLanTS MSE column (0.708/1.685/0.531/0.885 on ETTh1/ETTh2/ETTm1/ETTm2) is numerically identical to Table 4's w/o multi-granularity-patching row, while Table 4's full PLanTS row differs (0.729/1.796/0.595/0.844). The headline claim that 'PLanTS reduces the average MSE by 7.2% and 9.1% on ETTh1 and ETTm1' is therefore produced by the variant that removes the paper's core periodicity-aware mechanism, not by the full PLanTS model. The forecasting 'prediction' reduces, by construction, to the ablation result.
full rationale
The only concrete circularity I can exhibit from the paper's own text is the forecasting identity: PLanTS's reported forecasting numbers in Table 3 are exactly the numbers of the 'w/o multi-granularity patching' ablation in Table 4, and Appendix B confirms that the forecasting hyperparameters use a fixed window size of 50, which is precisely how the ablation is defined. This means the forecasting evidence for the central claim is not generated by the periodicity-aware multi-granularity patching mechanism; the paper even concedes in Section 4.5 that the fixed-window variant improves forecasting on three of four ETT datasets. That is a load-bearing reduction of a headline result to the configuration that removes the core novelty. Other potential concerns are not circularity under the strict standard. The soft contrastive loss (Eq. 3) uses MXCorr similarities computed from the same input windows as soft targets, and Appendix D makes this explicit by deriving the loss as a KL matching to the input-space similarity distribution. That is a transparent handcrafted self-supervised target, not a hidden derivation or a fitted parameter renamed as a prediction. The next-transition objective (Eq. 6) predicts the next patch's embedding produced by the same encoder, but it targets a different temporal position and is a standard self-supervised bootstrapping formulation; it is not equivalent to its input by construction. There is no meaningful self-citation chain: the authors do not rely on their own prior work to justify the periodicity assumptions, and the FFT patching is attributed to TimesNet [36], not to the present authors. The classification, trajectory, and anomaly-detection experiments use the full PLanTS model and are not circular against external benchmarks. Thus the circularity is partial: one central piece of evidence reduces by construction, while other parts retain independent content. Score 6 reflects that partial reduction rather than a fully tautological derivation.
Assumptions & free parameters
free parameters (6)
- alpha (α) =
0.5 or 0.9 depending on task
- lambda (λ) =
0.5 or 1.0
- K (number of FFT periodicities) =
3 for classification and trajectory tracking
- fixed window size =
50 for forecasting; [20,30] for PTB-XL
- learning rate =
0.001 (0.0001 to 0.001 for classification)
- batch size =
128
assumptions (4)
- domain assumption Dominant FFT frequencies of the raw signal correspond to meaningful latent-state transition scales.
- domain assumption Maximum cross-correlation (MXCorr) between input windows is a valid proxy for latent-state semantic similarity.
- domain assumption The next-transition prediction MSE, predicting v_{m+1} from concat(u_m, v_m), encourages temporally useful representations.
- domain assumption Self-supervised representations from PLanTS and baselines transfer equally to downstream SVM/linear probes under the same protocol.
Cite this review
Pith. "Pith review of PLanTS: Periodicity-aware Latent-state Representation Learning for Multivariate Time Series." pith.science (2026). https://pith.science/paper/74AAOW4D
@misc{pith2026250905478,
  author       = {Pith},
  title        = {Pith review of: PLanTS: Periodicity-aware Latent-state Representation Learning for Multivariate Time Series},
  year         = {2026},
  howpublished = {\url{https://pith.science/paper/74AAOW4D}},
  note         = {Machine review of arXiv:2509.05478}
}
read the original abstract
Multivariate time series (MTS) are ubiquitous in domains such as healthcare, climate science, and industrial monitoring, but their high dimensionality, limited labeled data, and non-stationary nature pose significant challenges for conventional machine learning methods. While recent self-supervised learning (SSL) approaches mitigate label scarcity by data augmentations or time point-based contrastive strategy, they neglect the intrinsic periodic structure of MTS and fail to capture the dynamic evolution of latent states. We propose PLanTS, a periodicity-aware self-supervised learning framework that explicitly models irregular latent states and their transitions. We first designed a period-aware multi-granularity patching mechanism and a generalized contrastive loss to preserve both instance-level and state-level similarities across multiple temporal resolutions. To further capture temporal dynamics, we design a next-transition prediction pretext task that encourages representations to encode predictive information about future state evolution. We evaluate PLanTS across a wide range of downstream tasks-including multi-class and multi-label classification, forecasting, trajectory tracking and anomaly detection. PLanTS consistently improves the representation quality over existing SSL methods and demonstrates superior runtime efficiency compared to DTW-based methods.
Figures


Figures from the paper (6 more)



Reference graph
Works this paper leans on
-
[1]
A public domain dataset for human activity recognition using smartphones
Davide Anguita, Alessandro Ghio, Luca Oneto, Xavier Parra, Jorge Luis Reyes-Ortiz, et al. A public domain dataset for human activity recognition using smartphones. InEsann, volume 3, pages 3–4, 2013
2013
-
[2]
The uea multivariate time series classification archive, 2018.arXiv preprint arXiv:1811.00075, 2018
Anthony Bagnall, Hoang Anh Dau, Jason Lines, Michael Flynn, James Large, Aaron Bostrom, Paul Southam, and Eamonn Keogh. The uea multivariate time series classification archive, 2018.arXiv preprint arXiv:1811.00075, 2018
arXiv 2018
-
[3]
Deep clustering for unsupervised learning of visual features
Mathilde Caron, Piotr Bojanowski, Armand Joulin, and Matthijs Douze. Deep clustering for unsupervised learning of visual features. InProceedings of the European conference on computer vision (ECCV), pages 132–149, 2018. 9 APREPRINT- SEPTEMBER9, 2025
work page 2018
-
[4]
A simple framework for contrastive learning of visual representations
Ting Chen, Simon Kornblith, Mohammad Norouzi, and Geoffrey Hinton. A simple framework for contrastive learning of visual representations. InInternational conference on machine learning, pages 1597–1607. PmLR, 2020
2020
-
[5]
Dtw-d: time series semi-supervised learning from a single example
Yanping Chen, Bing Hu, Eamonn Keogh, and Gustavo EAPA Batista. Dtw-d: time series semi-supervised learning from a single example. InProceedings of the 19th ACM SIGKDD international conference on Knowledge discovery and data mining, pages 383–391, 2013
work page 2013
-
[6]
Time series forecasting for nonlinear and non-stationary processes: a review and comparative study.Iie Transactions, 47(10):1053–1071, 2015
Changqing Cheng, Akkarapol Sa-Ngasoongsong, Omer Beyca, Trung Le, Hui Yang, Zhenyu Kong, and Satish TS Bukkapatnam. Time series forecasting for nonlinear and non-stationary processes: a review and comparative study.Iie Transactions, 47(10):1053–1071, 2015
2015
-
[7]
Anomaly detection for iot time-series data: A survey.IEEE Internet of Things Journal, 7(7):6481–6494, 2019
Andrew A Cook, Göksel Mısırlı, and Zhong Fan. Anomaly detection for iot time-series data: A survey.IEEE Internet of Things Journal, 7(7):6481–6494, 2019
2019
-
[8]
An unsupervised approach for periodic source detection in time series
Berken Utku Demirel and Christian Holz. An unsupervised approach for periodic source detection in time series. InInternational Conference on Machine Learning, pages 10409–10439. PMLR, 2024
work page 2024
Show all 45 references
-
[9]
Bert: Pre-training of deep bidirectional transformers for language understanding
Jacob Devlin, Ming-Wei Chang, Kenton Lee, and Kristina Toutanova. Bert: Pre-training of deep bidirectional transformers for language understanding. InProceedings of the 2019 conference of the North American chapter of the association for computational linguistics: human langua...
2019
-
[10]
Time-series representation learning via temporal and contextual contrasting.arXiv preprint arXiv:2106.14112, 2021
Emadeldeen Eldele, Mohamed Ragab, Zhenghua Chen, Min Wu, Chee Keong Kwoh, Xiaoli Li, and Cuntai Guan. Time-series representation learning via temporal and contextual contrasting.arXiv preprint arXiv:2106.14112, 2021
2021 arXiv
-
[11]
T-rep: Representation learning for time series using time-embeddings
Archibald Fraikin, Adrien Bennetot, and Stéphanie Allassonnière. T-rep: Representation learning for time series using time-embeddings. InThe Twelfth International Conference on Learning Representations, 2024
2024
-
[12]
Unsupervised scalable representation learning for multivariate time series.Advances in neural information processing systems, 32, 2019
Jean-Yves Franceschi, Aymeric Dieuleveut, and Martin Jaggi. Unsupervised scalable representation learning for multivariate time series.Advances in neural information processing systems, 32, 2019
2019
-
[13]
Unsupervised representation learning by predicting image rotations.arXiv preprint arXiv:1803.07728, 2018
Spyros Gidaris, Praveer Singh, and Nikos Komodakis. Unsupervised representation learning by predicting image rotations.arXiv preprint arXiv:1803.07728, 2018
2018 arXiv
-
[14]
Momentum contrast for unsupervised visual representation learning
Kaiming He, Haoqi Fan, Yuxin Wu, Saining Xie, and Ross Girshick. Momentum contrast for unsupervised visual representation learning. InProceedings of the IEEE/CVF conference on computer vision and pattern recognition, pages 9729–9738, 2020
2020
-
[15]
Deep learning for time series classification: a review.Data mining and knowledge discovery, 33(4):917–963, 2019
Hassan Ismail Fawaz, Germain Forestier, Jonathan Weber, Lhassane Idoumghar, and Pierre-Alain Muller. Deep learning for time series classification: a review.Data mining and knowledge discovery, 33(4):917–963, 2019
2019
-
[16]
Towards enhancing time series contrastive learning: A dynamic bad pair mining approach
Xiang Lan, Hanshu Yan, Shenda Hong, and Mengling Feng. Towards enhancing time series contrastive learning: A dynamic bad pair mining approach. InICLR, 2024
2024
-
[17]
Soft contrastive learning for time series
Seunghan Lee, Taeyoung Park, and Kibok Lee. Soft contrastive learning for time series. In12th International Conference on Learning Representations, ICLR 2024, 2024
2024
-
[18]
Time-series forecasting with deep learning: a survey.Philosophical Transactions of the Royal Society A, 379(2194):20200209, 2021
Bryan Lim and Stefan Zohren. Time-series forecasting with deep learning: a survey.Philosophical Transactions of the Royal Society A, 379(2194):20200209, 2021
2021
-
[19]
Self-supervised learning: Generative or contrastive.IEEE transactions on knowledge and data engineering, 35(1):857–876, 2021
Xiao Liu, Fanjin Zhang, Zhenyu Hou, Li Mian, Zhaoyu Wang, Jing Zhang, and Jie Tang. Self-supervised learning: Generative or contrastive.IEEE transactions on knowledge and data engineering, 35(1):857–876, 2021
2021
-
[20]
Non-stationary transformers: Exploring the stationarity in time series forecasting.Advances in neural information processing systems, 35:9881–9893, 2022
Yong Liu, Haixu Wu, Jianmin Wang, and Mingsheng Long. Non-stationary transformers: Exploring the stationarity in time series forecasting.Advances in neural information processing systems, 35:9881–9893, 2022
2022
-
[21]
John Wiley & Sons, 2015
Douglas C Montgomery, Cheryl L Jennings, and Murat Kulahci.Introduction to time series analysis and forecasting. John Wiley & Sons, 2015
2015
-
[22]
Application of wavelet techniques in ecg signal processing: an overview.International Journal of Engineering Science and Technology (IJEST), 3(10):7432–7443, 2011
H Nagendra, Shaktidev Mukherjee, and Vinod Kumar. Application of wavelet techniques in ecg signal processing: an overview.International Journal of Engineering Science and Technology (IJEST), 3(10):7432–7443, 2011
2011
-
[23]
A review on iot healthcare monitoring applications and a vision for transforming sensor data into real-time clinical feedback
Hoa Hong Nguyen, Farhaan Mirza, M Asif Naeem, and Minh Nguyen. A review on iot healthcare monitoring applications and a vision for transforming sensor data into real-time clinical feedback. In2017 IEEE 21st International conference on computer supported cooperative work in des...
2017
-
[24]
Unsupervised learning of visual representations by solving jigsaw puzzles
Mehdi Noroozi and Paolo Favaro. Unsupervised learning of visual representations by solving jigsaw puzzles. In European conference on computer vision, pages 69–84. Springer, 2016. 10 APREPRINT- SEPTEMBER9, 2025
2016
-
[25]
Representation learning with contrastive predictive coding
Aaron van den Oord, Yazhe Li, and Oriol Vinyals. Representation learning with contrastive predictive coding. arXiv preprint arXiv:1807.03748, 2018
2018 arXiv
-
[26]
Time-series anomaly detection service at microsoft
Hansheng Ren, Bixiong Xu, Yujing Wang, Chao Yi, Congrui Huang, Xiaoyu Kou, Tony Xing, Mao Yang, Jie Tong, and Qi Zhang. Time-series anomaly detection service at microsoft. InProceedings of the 25th ACM SIGKDD international conference on knowledge discovery & data mining, pages...
2019
-
[27]
A primer on contrastive pretraining in language processing: Methods, lessons learned, and perspectives.ACM Computing Surveys, 55(10):1–17, 2023
Nils Rethmeier and Isabelle Augenstein. A primer on contrastive pretraining in language processing: Methods, lessons learned, and perspectives.ACM Computing Surveys, 55(10):1–17, 2023
2023
-
[28]
Wavelet transform application for/in non-stationary time-series analysis: A review.Applied sciences, 9(7):1345, 2019
Manel Rhif, Ali Ben Abbes, Imed Riadh Farah, Beatriz Martínez, and Yanfang Sang. Wavelet transform application for/in non-stationary time-series analysis: A review.Applied sciences, 9(7):1345, 2019
2019
-
[29]
Clustering longitudinal clinical marker trajectories from electronic health data: Applications to phenotyping and endotype discovery
Peter Schulam, Fredrick Wigley, and Suchi Saria. Clustering longitudinal clinical marker trajectories from electronic health data: Applications to phenotyping and endotype discovery. InProceedings of the AAAI Conference on Artificial Intelligence, volume 29, 2015
2015
-
[30]
Learning tasks for multitask learning: Heterogenous patient populations in the icu
Harini Suresh, Jen J Gong, and John V Guttag. Learning tasks for multitask learning: Heterogenous patient populations in the icu. InProceedings of the 24th ACM SIGKDD International Conference on Knowledge Discovery & Data Mining, pages 802–810, 2018
2018
-
[31]
Unsupervised representation learning for time series with temporal neighborhood coding.arXiv preprint arXiv:2106.00750, 2021
Sana Tonekaboni, Danny Eytan, and Anna Goldenberg. Unsupervised representation learning for time series with temporal neighborhood coding.arXiv preprint arXiv:2106.00750, 2021
2021 arXiv
-
[32]
Universal time-series representation learning: A survey.arXiv preprint arXiv:2401.03717, 2024
Patara Trirat, Yooju Shin, Junhyeok Kang, Youngeun Nam, Jihye Na, Minyoung Bae, Joeun Kim, Byunghyun Kim, and Jae-Gil Lee. Universal time-series representation learning: A survey.arXiv preprint arXiv:2401.03717, 2024
2024 arXiv
-
[33]
Ptb-xl, a large publicly available electrocardiography dataset.Scientific data, 7(1):1–15, 2020
Patrick Wagner, Nils Strodthoff, Ralf-Dieter Bousseljot, Dieter Kreiseler, Fatima I Lunze, Wojciech Samek, and Tobias Schaeffter. Ptb-xl, a large publicly available electrocardiography dataset.Scientific data, 7(1):1–15, 2020
2020
-
[34]
Time2state: An unsupervised framework for inferring the latent states in time series data.Proceedings of the ACM on Management of Data, 1(1):1–18, 2023
Chengyu Wang, Kui Wu, Tongqing Zhou, and Zhiping Cai. Time2state: An unsupervised framework for inferring the latent states in time series data.Proceedings of the ACM on Management of Data, 1(1):1–18, 2023
2023
-
[35]
Chaos is a ladder: A new theoretical understanding of contrastive learning via augmentation overlap.arXiv preprint arXiv:2203.13457, 2022
Yifei Wang, Qi Zhang, Yisen Wang, Jiansheng Yang, and Zhouchen Lin. Chaos is a ladder: A new theoretical understanding of contrastive learning via augmentation overlap.arXiv preprint arXiv:2203.13457, 2022
2022 arXiv
-
[36]
Timesnet: Temporal 2d-variation modeling for general time series analysis.arXiv preprint arXiv:2210.02186, 2022
Haixu Wu, Tengge Hu, Yong Liu, Hang Zhou, Jianmin Wang, and Mingsheng Long. Timesnet: Temporal 2d-variation modeling for general time series analysis.arXiv preprint arXiv:2210.02186, 2022
2022 arXiv
-
[37]
Simper: Simple self-supervised learning of periodic targets
Yuzhe Yang, Xin Liu, Jiang Wu, Silviu Borac, Dina Katabi, Ming-Zher Poh, and Daniel McDuff. Simper: Simple self-supervised learning of periodic targets. InICLR, 2023
2023
-
[38]
Ts2vec: Towards universal representation of time series
Zhihan Yue, Yujing Wang, Juanyong Duan, Tianmeng Yang, Congrui Huang, Yunhai Tong, and Bixiong Xu. Ts2vec: Towards universal representation of time series. InProceedings of the AAAI conference on artificial intelligence, volume 36, pages 8980–8987, 2022
2022
-
[39]
Deep learning for time series anomaly detection: A survey.ACM Computing Surveys, 57(1):1–42, 2024
Zahra Zamanzadeh Darban, Geoffrey I Webb, Shirui Pan, Charu Aggarwal, and Mahsa Salehi. Deep learning for time series anomaly detection: A survey.ACM Computing Surveys, 57(1):1–42, 2024
2024
-
[40]
A transformer- based framework for multivariate time series representation learning
George Zerveas, Srideepika Jayaraman, Dhaval Patel, Anuradha Bhamidipaty, and Carsten Eickhoff. A transformer- based framework for multivariate time series representation learning. InProceedings of the 27th ACM SIGKDD conference on knowledge discovery & data mining, pages 2114...
2021
-
[41]
Self-supervised learning for time series analysis: Taxonomy, progress, and prospects.IEEE transactions on pattern analysis and machine intelligence, 46(10):6775–6794, 2024
Kexin Zhang, Qingsong Wen, Chaoli Zhang, Rongyao Cai, Ming Jin, Yong Liu, James Y Zhang, Yuxuan Liang, Guansong Pang, Dongjin Song, et al. Self-supervised learning for time series analysis: Taxonomy, progress, and prospects.IEEE transactions on pattern analysis and machine int...
2024
-
[42]
Self-supervised contrastive pre-training for time series via time-frequency consistency.Advances in neural information processing systems, 35:3988–4003, 2022
Xiang Zhang, Ziyuan Zhao, Theodoros Tsiligkaridis, and Marinka Zitnik. Self-supervised contrastive pre-training for time series via time-frequency consistency.Advances in neural information processing systems, 35:3988–4003, 2022
2022
-
[43]
Springer, 2018
Zhihua Zhang, Khelifi Zhang, and A Khelifi.Multivariate time series analysis in climate and environmental research. Springer, 2018
2018
-
[44]
Parametric augmentation for time series contrastive learning.arXiv preprint arXiv:2402.10434, 2024
Xu Zheng, Tianchun Wang, Wei Cheng, Aitian Ma, Haifeng Chen, Mo Sha, and Dongsheng Luo. Parametric augmentation for time series contrastive learning.arXiv preprint arXiv:2402.10434, 2024
2024 arXiv
-
[45]
Informer: Beyond efficient transformer for long sequence time-series forecasting
Haoyi Zhou, Shanghang Zhang, Jieqi Peng, Shuai Zhang, Jianxin Li, Hui Xiong, and Wancai Zhang. Informer: Beyond efficient transformer for long sequence time-series forecasting. InProceedings of the AAAI conference on artificial intelligence, volume 35, pages 11106–11115, 2021....
2021
Reviewed August 5, 2026 · model on record in the stance chip above.
Discussion (0). Sign in to comment.