REVIEW 3 major objections 4 minor 12 references
A Comparison and Evaluation of Fine-tuned Convolutional Neural Networks to Large Language Models for Image Classification and Segmentation of Brain Tumors on MRI
T0 review · 3 major / 4 minor · reviewed 2026-08-04 · deepseek-v4-flash
Pith's one-line read General-purpose vision LLMs fail at brain tumor classification and segmentation on MRI, and fine-tuning barely moves the needle.
desk verdict A useful but over-scoped benchmark: the 3D CNN beats this VLM under asymmetric inputs and truncated fine-tuning, but the 'not suited for image tasks' claim goes beyond the evidence. read the letter →
The pith
A machine-rendered reading of the paper's core claim, the machinery that carries it, and where it could break.
The reading
What carries the argument
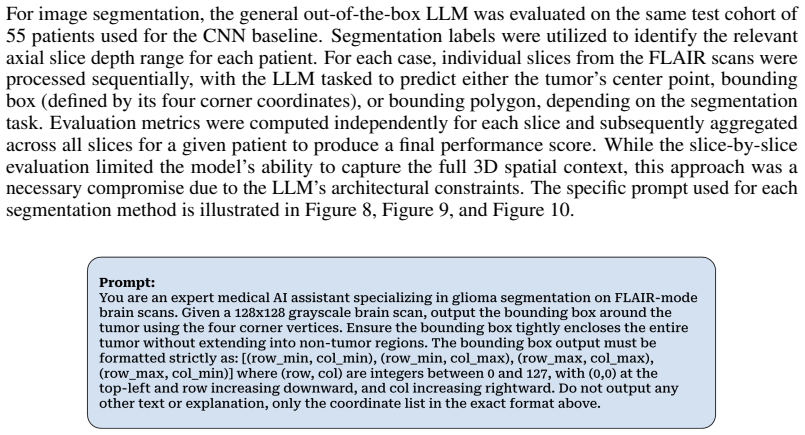
The comparison rests on two model families: a 3D CNN trained on full four-modality volumetric MRI, and a vision-language LLM (LLaMA 3.2 Instruct) prompted on 2D FLAIR axial slices, fine-tuned with low-rank adaptation, with patient predictions aggregated by majority vote. For segmentation, three geometric output representations are used—center point, bounding box, and polygon—each converted to text tokens; evaluation uses accuracy/specificity for classification and Dice/Hausdorff distance for segmentation.
What would settle it
Fine-tune a vision-language LLM on 3D or multi-slice multi-modal inputs (or with longer training, larger batches, and validation) and show it achieves Dice above 0.5 and specificity above 0.7 on BraTS test patients; or construct a test set with off-center tumors and show the LLM's predicted centers track actual tumor positions.
Extended reading notes
Core claim
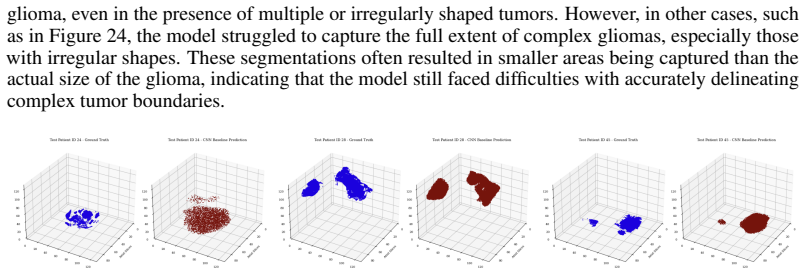
The paper's central claim is that, on the BraTS 2020 glioma dataset, a custom 3D CNN outperforms a fine-tuned general-purpose vision-language LLM in both classification (HGG vs LGG) and tumor segmentation. The CNN achieves balanced precision/recall and Dice ~0.59, while the LLM's high accuracy is an artifact of class imbalance (specificity 0.18 on glioma slices), its segmentations are centered and insensitive to tumor geometry, and fine-tuning for 100-200 steps with small batches improves formatting but not localization. Consequently, the authors argue that such LLMs are not, in their current form, suitable for image-based medical tasks.
Load-bearing premise
The study assumes the evaluation setup is a fair test of LLM capability—the LLM sees only 2D FLAIR slices while the CNN sees full 3D multi-modal volumes, and fine-tuning is limited to 100-200 steps with small batches and no validation curve (Section 5.2.1).
Editorial extensions
If this is right
- In low-resource clinical settings where only an out-of-the-box or lightly fine-tuned LLM is available, brain tumor classification and segmentation should not rely on it; a simple 3D CNN is the safer choice.
- The LLM's center-clustering behavior indicates a systematic spatial prior rather than image understanding; this could mislead downstream radiation-therapy or surgical planning.
- Fine-tuning with small batches, short runs, and no validation—the realistic budget in this study—produces format compliance but not spatial learning.
- Performance gaps in both tasks are consistent: whatever the segmentation representation (point, box, polygon), the LLM fails to localize, so the limitation is spatial reasoning, not output format.
- The authors' conclusion motivates careful evaluation of 'fine-tuned LLM' claims in medical imaging: without comparable input modalities and training budgets, a CNN baseline should be the reference.
Reading between the lines
- A fairer test would give the LLM the same volumetric, multi-modal information as the CNN; the confounding between model family and input dimensionality is unresolved by this study.
- The consistent center-clustering suggests the LLM relies on a natural-image prior that salient objects occupy the frame center; a test set with deliberately off-center tumors would reveal this directly.
- Hybrid architectures—CNN encoders feeding tokens to a language model—might retain spatial fidelity while leveraging LLM flexibility; the paper's negative result does not rule that out.
- The findings imply a practical triage rule for medical AI: use LLMs for text reports or structured annotations, and CNNs for voxel-level geometry, until LLMs are given true 3D perception.
Editorial analysis
A structured set of objections, weighed in public.
Referee Report
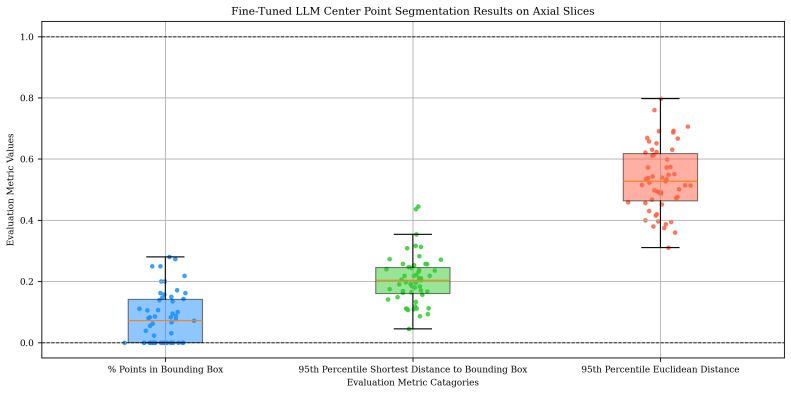
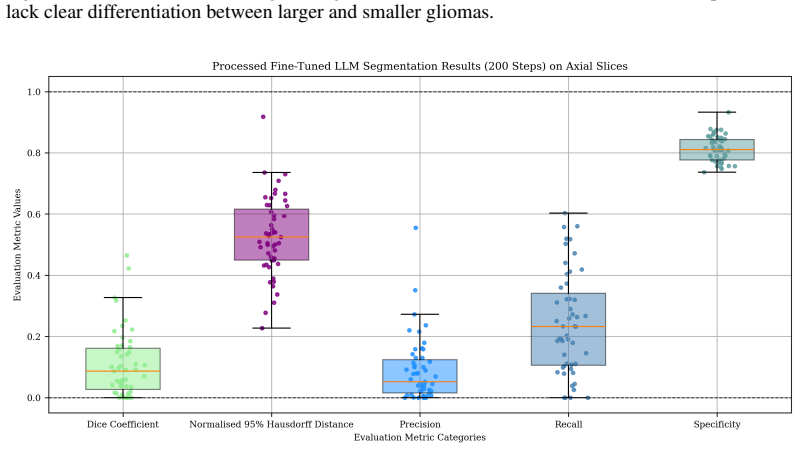
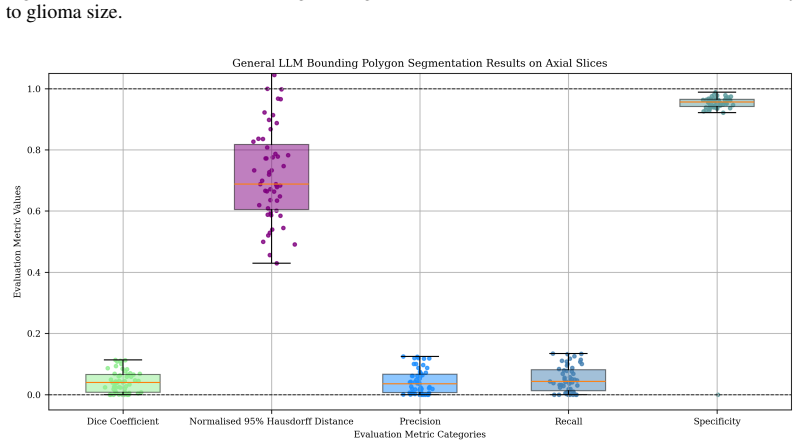
Summary. The paper reports a comparison of a custom 3D CNN and LLaMA 3.2 Instruct (general and LoRA-fine-tuned) on BraTS 2020 glioma classification and segmentation. The CNN uses full 3D four-modality volumes; the LLM uses 2D FLAIR slices aggregated by majority vote. On a 55-patient test cohort, the CNN achieves 80% classification accuracy and 0.59 Dice; the general LLM reaches 76–80% accuracy but with near-zero specificity, and fine-tuned LLMs reach 67–76% accuracy. In segmentation, the LLM's center-point, bounding-box, and polygon predictions show only 0.03–0.12 Dice or 8% point-in-box rates, with predictions clustered at image center. The authors conclude that CNNs outperform LLMs and that LLMs are not well-suited for image-based tasks.
Significance. The paper's reported numbers, if taken as an evaluation of a specific lightweight adaptation, provide a useful negative result: a general-purpose vision-language model adapted via LoRA with a very limited budget and 2D FLAIR input does not compete with a 3D CNN on BraTS. The transparency about limitations, use of a standard dataset, multiple evaluation metrics, and qualitative visualizations are strengths. However, the headline conclusion overreaches: the comparison conflates model architecture with input dimensionality, modality count, and training budget. The evidence supports 'this LLM pipeline under these constraints underperforms,' not 'LLMs are not well-suited for image-based tasks.' With a matched-input baseline and softened claims, the paper could be a useful benchmark; without them, the central claim is stronger than the experiment can support.
major comments (3)
- [§2.2.1, §5.2.1, Abstract/Conclusion] The central comparison is confounded by input representation. The CNN receives full 3D volumes across T1, T1ce, T2, and FLAIR, while the LLM receives only 2D axial FLAIR slices and must be aggregated by majority vote. The authors acknowledge this in §5.2.1 but nonetheless conclude that 'LLMs ... are not well-suited for image-based tasks.' This conclusion is not warranted by the experiment, because the performance gap could reflect the difference in available information (four modalities vs one, full volume vs single slices) and the prompting overhead, rather than a lack of spatial understanding inherent to the LLM class. The stress-test concern lands: a matched baseline—e.g., a 2D FLAIR-only CNN evaluated per-slice with the same majority-vote aggregation, or a 3D multi-modal LLM input if feasible—is needed to separate architecture from input. At minimum, the abstract and conclusion must
- [§3.1, §4.1, §5.2.1] The fine-tuning comparison is not sufficient to support the claim that fine-tuning provides 'minimal improvement' or that the best-performing LLM configurations were compared. Fine-tuning was limited to 100–200 steps, batch sizes of 4–24, and no validation curve (§3.1; §5.2.1). Without validation-based checkpoint selection, the 100-step and full-epoch models are arbitrary stopping points, and the absence of validation means overfitting or underfitting cannot be diagnosed. Therefore Table 3 and the segmentation fine-tuning results (Tables 6, 8, 10) show only that a specific, resource-limited training protocol did not help; they do not establish an upper bound on what fine-tuning can achieve. The authors' assertion in §5.2.1 that this 'ultimately has minimal impact' because the best-performing versions are compared is not defensible. Please either add validation curves/checkpoint selection
- [§4.1 (consistency test), §3.1] The consistency test claims that the LLM is unstable because identical inputs produced different predictions over 95 trials, but the paper never specifies the decoding parameters (temperature, top-p, maximum tokens, sampling strategy). For a generative model, repeated sampling with non-zero temperature is expected to produce different outputs; the reported behavior is therefore not evidence of 'lack of stability' unless sampling is controlled. Please report the exact inference configuration and re-run the consistency check with temperature=0 (or greedy decoding) if supported, and report the number of trials and randomness seeds. This is needed both for reproducibility and for the robustness claim.
minor comments (4)
- [§2.1.2] The dataset split description is ambiguous and arithmetically inconsistent: '310 training, 62 validation (for each of 5-folds), and 55 test samples' sums to more than 365. Please clarify whether 310 patients are split into five folds of 62 with a separate held-out test cohort of 55.
- [§4.1, Table 3, Abstract] Please align reported accuracies across the abstract, Table 2, and Table 3. The abstract's '76% accuracy' for the general LLM appears to come from 'General LLM (small)' in Table 3, while Table 2 reports 78.18% for axial orientation; the reader should not have to infer which number is being quoted.
- [§2.2.1, Reference [9]] The statement that FLAIR is the superior modality for detecting brain anomalies is supported by a citation about multiple sclerosis lesions, not brain tumors. Please use a brain-tumor-specific reference or moderate the claim.
- [References] The LLaMA 3.2 Instruct model and Unsloth are used throughout but are not cited. Please add references to the model card/technical report and the Unsloth library, and state software versions for reproducibility.
Circularity Check
No circularity: the paper is an empirical benchmark with held-out evaluation; the main weakness is an acknowledged input-asymmetry confound, not a derivation that reduces to its inputs.
full rationale
The paper is an empirical comparison study, not a derivation. The central claims—that CNNs outperformed LLMs on BraTS 2020 glioma classification and segmentation, and that LLM fine-tuning gave little benefit—are supported by held-out test metrics (55-patient test cohort) computed with standard supervised-learning evaluation. There is no equation chain in which a fitted constant is algebraically reused as a prediction, no quantity is defined in terms of the outcome it is used to predict, and no uniqueness or ansatz result is imported from the authors' own prior work. The three cited self-references ([4-8]) are dataset and preprocessing citations for BraTS, not load-bearing theoretical claims; the LLaFS citation [11] is used only to adapt a prompt format, not to justify the performance conclusions. The paper itself explicitly acknowledges in Section 5.2.1 and 5.2.2 that the CNN received full 3D multi-modal volumes while the LLM received 2D axial FLAIR slices, and that fine-tuning was truncated (100-200 steps, small batches, no validation curve). These are internal-validity limitations that could confound the comparison, but a confound is not circularity: the LLM's outputs were not constructed from the CNN's outputs or from the test labels, and the reported gap is an observed outcome rather than a tautology. Even under the reviewer rule that all manuscript passages count as evidence, the limitation passages strengthen the non-circularity finding because they openly identify the confounds rather than smuggling them in as predictions. Therefore the appropriate circularity score is 0.
Assumptions & free parameters
free parameters (6)
- CNN learning rate =
4e-7 (classification), 5e-5 (segmentation)
- LLM fine-tuning learning rate =
2e-6 (classification); per-task values (segmentation)
- Fine-tuning steps and batch size =
100 steps bs=4; 1 epoch bs=16; segmentation 100-200 steps bs=4-16
- LoRA rank and alpha =
16, 16
- Segmentation mask threshold =
0.7
- Majority vote weighting =
winner-takes-all (equal weight per slice)
assumptions (6)
- domain assumption BraTS 2020 annotations are correct and representative
- domain assumption LLaMA 3.2 Instruct is a representative general-purpose vision-language LLM
- domain assumption FLAIR alone is sufficient for the classification/segmentation tasks when using the LLM
- domain assumption The evaluation metrics (Dice, Hausdorff, center distance) capture clinically meaningful performance
- ad hoc to paper Fine-tuning without a validation curve is acceptable for the comparison
- ad hoc to paper The consistency test with repeated identical inputs at default sampling is a valid measure of model robustness
Cite this review
Pith. "Pith review of A Comparison and Evaluation of Fine-tuned Convolutional Neural Networks to Large Language Models for Image Classification and Segmentation of Brain Tumors on MRI." pith.science (2026). https://pith.science/paper/5Y5P4RQW
@misc{pith2026250910683,
  author       = {Pith},
  title        = {Pith review of: A Comparison and Evaluation of Fine-tuned Convolutional Neural Networks to Large Language Models for Image Classification and Segmentation of Brain Tumors on MRI},
  year         = {2026},
  howpublished = {\url{https://pith.science/paper/5Y5P4RQW}},
  note         = {Machine review of arXiv:2509.10683}
}
read the original abstract
Large Language Models (LLMs) have shown strong performance in text-based healthcare tasks. However, their utility in image-based applications remains unexplored. We investigate the effectiveness of LLMs for medical imaging tasks, specifically glioma classification and segmentation, and compare their performance to that of traditional convolutional neural networks (CNNs). Using the BraTS 2020 dataset of multi-modal brain MRIs, we evaluated a general-purpose vision-language LLM (LLaMA 3.2 Instruct) both before and after fine-tuning, and benchmarked its performance against custom 3D CNNs. For glioma classification (Low-Grade vs. High-Grade), the CNN achieved 80% accuracy and balanced precision and recall. The general LLM reached 76% accuracy but suffered from a specificity of only 18%, often misclassifying Low-Grade tumors. Fine-tuning improved specificity to 55%, but overall performance declined (e.g., accuracy dropped to 72%). For segmentation, three methods - center point, bounding box, and polygon extraction, were implemented. CNNs accurately localized gliomas, though small tumors were sometimes missed. In contrast, LLMs consistently clustered predictions near the image center, with no distinction of glioma size, location, or placement. Fine-tuning improved output formatting but failed to meaningfully enhance spatial accuracy. The bounding polygon method yielded random, unstructured outputs. Overall, CNNs outperformed LLMs in both tasks. LLMs showed limited spatial understanding and minimal improvement from fine-tuning, indicating that, in their current form, they are not well-suited for image-based tasks. More rigorous fine-tuning or alternative training strategies may be needed for LLMs to achieve better performance, robustness, and utility in the medical space.
Figures


Figures from the paper (36 more)












Reference graph
Works this paper leans on
-
[1]
Lung Disease Classification using Deep Convolutional Neural Network
Zeenat Tariq, Sayed Khushal Shah, and Yugyung Lee. Lung Disease Classification using Deep Convolutional Neural Network. In2019 IEEE International Conference on Bioinfor- 27 matics and Biomedicine (BIBM), pages 732–735, November 2019. doi: 10.1109/BIBM47256. 2019.8983071. URL https://ieeexplore.ieee.org/document/8983071/?arnumber= 8983071
arXiv 2019
-
[2]
Deep cnn for brain tumor classification.Neural processing letters, 53(1):671–700, 2021
Wadhah Ayadi, Wajdi Elhamzi, Imen Charfi, and Mohamed Atri. Deep cnn for brain tumor classification.Neural processing letters, 53(1):671–700, 2021
2021
-
[3]
Ramin Ranjbarzadeh, Abbas Bagherian Kasgari, Saeid Jafarzadeh Ghoushchi, Shokofeh Anari, Maryam Naseri, and Malika Bendechache. Brain tumor segmentation based on deep learning and an attention mechanism using MRI multi-modalities brain images.Scientific Reports, 11 (1):10930, May 2021. ISSN 2045-2322. doi: 10.1038/s41598-021-90428-8. URL https:// www.natu...
-
[4]
Albiol, Varghese Alex, Nigel Allinson, Pedro H
Spyridon Bakas, Mauricio Reyes, Andras Jakab, Stefan Bauer, Markus Rempfler, Alessandro Crimi, Russell Takeshi Shinohara, Christoph Berger, Sung Min Ha, Martin Rozycki, Marcel Prastawa, Esther Alberts, Jana Lipkova, John Freymann, Justin Kirby, Michel Bilello, Hassan Fathallah-Shaykh, Roland Wiest, Jan Kirschke, Benedikt Wiestler, Rivka Colen, Aikaterini ...
arXiv 2019
-
[5]
Spyridon Bakas, Hamed Akbari, Aristeidis Sotiras, Michel Bilello, Martin Rozycki, Justin S. Kirby, John B. Freymann, Keyvan Farahani, and Christos Davatzikos. Advancing The Cancer Genome Atlas glioma MRI collections with expert segmentation labels and radiomic features. Scientific Data, 4(1):170117, December 2017. ISSN 2052-4463. doi: 10.1038/sdata.2017.1...
-
[6]
Bjoern H. Menze, Andras Jakab, Stefan Bauer, Jayashree Kalpathy-Cramer, Keyvan Farahani, Justin Kirby, Yuliya Burren, Nicole Porz, Johannes Slotboom, Roland Wiest, Levente Lanczi, Elizabeth Gerstner, Marc-André Weber, Tal Arbel, Brian B. Avants, Nicholas Ayache, Patricia Buendia, D. Louis Collins, Nicolas Cordier, Jason J. Corso, Antonio Criminisi, Tilak ...
1993
-
[7]
Bakas, H
S. Bakas, H. Akbari, A. Sotiras, M. Bilello, M. Rozycki, J. Kirby, J. Freymann, K. Farahani, and C. Davatzikos. BRATS-TCGA-GBM. URL https://www.cancerimagingarchive.net/ analysis-result/brats-tcga-gbm/
-
[8]
URL https://www.cancerimagingarchive.net/ analysis-result/brats-tcga-lgg/
BRATS-TCGA-LGG. URL https://www.cancerimagingarchive.net/ analysis-result/brats-tcga-lgg/. 29
Show all 12 references
-
[9]
Rohit Bakshi, Suzie Ariyaratana, Ralph H. B. Benedict, and Lawrence Jacobs. Fluid-Attenuated Inversion Recovery Magnetic Resonance Imaging Detects Cortical and Juxtacortical Multiple Sclerosis Lesions.Archives of Neurology, 58(5):742–748, May 2001. ISSN 0003-9942. doi: 10.1001...
2001 doi
-
[10]
Berg, Wan-Yen Lo, Piotr Dollár, and Ross Girshick
Alexander Kirillov, Eric Mintun, Nikhila Ravi, Hanzi Mao, Chloe Rolland, Laura Gustafson, Tete Xiao, Spencer Whitehead, Alexander C. Berg, Wan-Yen Lo, Piotr Dollár, and Ross Girshick. Segment Anything. In2023 IEEE/CVF International Conference on Computer Vision (ICCV), pages 3...
2023
-
[11]
LLaFS: When Large Language Models Meet Few-Shot Segmentation
Lanyun Zhu, Tianrun Chen, Deyi Ji, Jieping Ye, and Jun Liu. LLaFS: When Large Language Models Meet Few-Shot Segmentation. In2024 IEEE/CVF Conference on Computer Vision and Pattern Recognition (CVPR), pages 3065–3075, June 2024. doi: 10.1109/CVPR52733.2024. 00296. URLhttps://ie...
2024
-
[2015]
doi: 10.1109/TMI.2014.2377694
ISSN 1558-254X. doi: 10.1109/TMI.2014.2377694
2014
Reviewed August 4, 2026 · model on record in the stance chip above.
Discussion (0). Continue with ORCID to comment.