REVIEW 4 major objections 5 minor 33 references
PoPStat-COVID19: Leveraging Population Pyramids to Quantify Demographic Vulnerability to COVID-19
T0 review · 4 major / 5 minor · reviewed 2026-08-15 · deepseek-v4-flash
Pith's one-line read A single demographic-divergence scalar, calibrated to Malta's old-skewed pyramid, explains 74% of cross-country variance in COVID-19 cases and 67% in deaths per million.
desk verdict The paper's headline R² is an in-sample search statistic, not an honest estimate, but the demographic signal is real and the authors are transparent about their procedure. read the letter →
The pith
A machine-rendered reading of the paper's core claim, the machinery that carries it, and where it could break.
The reading
What carries the argument
The load-bearing object is PoPDivergence, the Kullback–Leibler divergence from a reference population pyramid, $D_{KL}(P_i \| P_\omega) = \sum_{a \in A} P_{i,a} \ln(P_{i,a}/P_{\omega,a})$. Reference-country tuning chooses the reference that maximizes the absolute Pearson correlation between the divergence vector and the log outcome on the full 183-country sample, $\omega^* = \arg\max_{\omega \in \Omega} |\mathrm{Cor}(\{\ln S_i\}, \{\mathrm{PoPDivergence}(i;\omega)\})|$. PoPStat–COVID19 is that maximized correlation coefficient. The machinery compresses a multidimensional age–sex distribution into a single signed scalar, keeping distributional features such as skewness and the weight of high-risk cohorts that median age discards, and its sign is interpretable: with an old-skewed reference, larger divergence means a younger population.
What would settle it
Split the 183 countries into two halves, choose the reference pyramid on one half, and compute the PoPStat–COVID19 correlation on the other half with that reference fixed; if the held-out correlation is substantially weaker than $r=-0.86$ for cases or $r=-0.82$ for deaths, or a permutation test that re-runs the full optimization on shuffled outcomes reaches $|r| \ge 0.86$ more than 5% of the time, the reference-selection step is driving the headline numbers.
Extended reading notes
Core claim
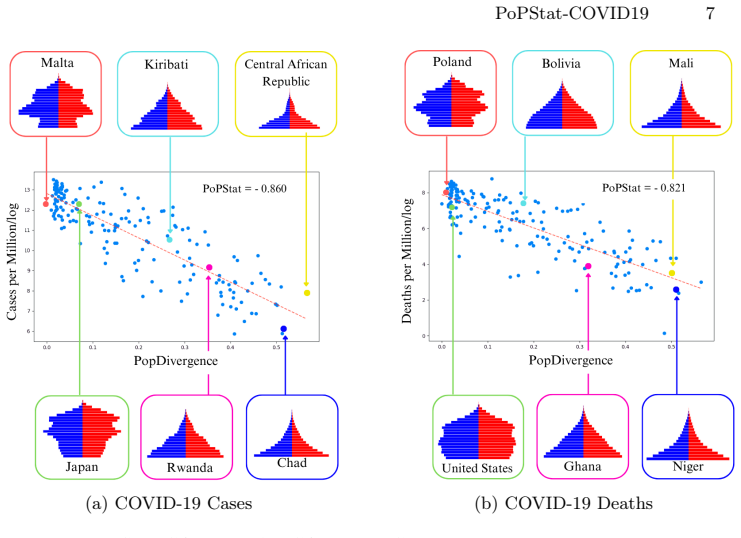
On the paper's own terms, the central discovery is that the full age–sex structure of a population, encoded as the Kullback–Leibler divergence from Malta's old-skewed pyramid, is strongly associated with cumulative COVID-19 cases and deaths per million as of 5 May 2023. Countries whose pyramids diverge more from Malta's shape had substantially lower recorded burden: $r=-0.860$ ($p<0.001$) for cases and $r=-0.821$ ($p<0.001$) for deaths. The authors interpret this as a demographic-buffer effect: old-skewed pyramids concentrate high-risk elderly, while young pyramids dilute the clinical burden even when transmission is rapid. They further report that the association is robust across twenty alternative references with similar profiles, and that for fatality burden PoPStat–COVID19 explains more variance than GDP per capita, Gini index, population density, Socio-demographic Index, or Universal Health Coverage Index; for cases, Human Development Index explains 80% of variance versus 74% for PoPStat–COVID19.
Load-bearing premise
The load-bearing premise is that reporting the correlation after picking the reference country that maximizes it on the same 183-country data gives an unbiased measure of demographic predictive strength.
Editorial extensions
If this is right
- Pandemic planners could compute a country's demographic vulnerability before an outbreak begins, using only pre-pandemic population data and no real-time surveillance.
- Countries with young, expansive pyramids should expect lower per-capita COVID-19 case and death rates than old-skewed countries, other things equal.
- For fatality burden, the demographic signal in this paper explains more variance than GDP per capita, median age, population density, Gini index, Socio-demographic Index, and Universal Health Coverage Index.
- The association's sign and strength depend on the reference's age profile: old-skewed references give strong negative correlations and young-skewed references give weaker positive ones.
Reading between the lines
- The reported $R^2$ values are fit-maximized: because Malta was selected by searching all 183 countries on the same outcomes, the ordinary $p$-values and confidence intervals are optimistic, and a separate or in-advance-chosen evaluation sample would probably show a smaller advantage over median age or Human Development Index.
- The country-level correlation does not by itself identify a causal demographic buffer, since reported cases and deaths also reflect testing intensity, reporting quality, and healthcare capacity, all of which correlate with age structure.
- A sharper test of the framework would fix the reference from demographic theory or an independent training set, then apply it prospectively to the next age-dependent respiratory pandemic; the retrospective fit in this paper cannot certify that use.
Signed reviews
Editorial analysis
A structured set of objections, weighed in public.
Referee Report
Summary. The paper proposes PoPStat-COVID19, a scalar measure of demographic vulnerability to COVID-19. For each of 183 countries, it computes the Kullback-Leibler divergence between that country's population pyramid and a reference pyramid, then defines PoPStat-COVID19 as the Pearson correlation between these divergence values and log-transformed cumulative COVID-19 cases or deaths per million. The reference pyramid is chosen to maximize the absolute value of that correlation on the same 183-country sample, and Malta is selected. The paper reports strong negative correlations (cases r=-0.860, deaths r=-0.821; R^2=0.74 and 0.67, all p<0.001), presents a "robustness" analysis using twenty alternative references, and benchmarks the metric against eight fixed socioeconomic and demographic indicators.
Significance. If the quantitative claims were valid, a distribution-aware demographic vulnerability scalar would be a useful, low-cost tool for pandemic preparedness, and the paper would extend the PoPStat framework to a major global health event. The authors provide a transparent algorithm and use publicly available data, which are strengths. However, the central statistical claims are compromised by outcome-dependent reference selection, invalid p-values and confidence intervals, and an unbalanced benchmark comparison. As presented, the paper does not establish that PoPStat-COVID19 explains the claimed variance or outperforms standard indicators.
major comments (4)
- [Eq. (2), Algorithm 1, Section 3.1] Equation (2) defines the reference pyramid omega* as the one that maximizes the absolute Pearson correlation between PoPDivergence and the log-transformed outcome over the same 183 countries used for inference. Algorithm 1 then reports the correlation at that selected reference as PoPStat-COVID19. The headline values (r=-0.860 for cases, r=-0.821 for deaths; R^2=0.74 and 0.67) are therefore maxima over 183 candidate references, not unbiased estimates. The ordinary p-values and confidence intervals in Tables 1 and 2 treat the reference as fixed and are invalid under post-selection inference; under a null of no association, the expected maximum absolute correlation over 183 candidates is far from zero. The authors should provide a split-sample or cross-validated evaluation, or a permutation-based null that repeats the reference search, before these magnitudes can be interpreted.
- [Section 2.4, Table 1] The sensitivity analysis is selection-biased. Section 2.4 states that the ten references yielding the most extreme negative and the ten yielding the most extreme positive correlations with log deaths were chosen from the same data. Reporting the correlations for these twenty extreme references does not characterize typical behavior across the 183 possible references and cannot rule out artifacts of the reference search. A meaningful robustness check would present the full distribution of correlations over all candidate references, or a random or pre-specified subset of old- and young-skewed pyramids, with inference that accounts for the selection.
- [Section 3.3, Table 2] The benchmark comparison is unbalanced. PoPStat-COVID19 is tuned to maximize correlation with the outcome on the same sample, whereas the eight comparator indicators (GDP per capita, HDI, median age, etc.) are fixed covariates unaffected by the outcome. The abstract's claim that PoPStat "outperforms every comparator for fatality burden" is therefore not supported, because the comparator R^2 values do not enjoy the same selection advantage. A fair comparison requires evaluating PoPStat with a pre-specified reference, or reporting an out-of-sample or cross-validated R^2 for PoPStat against fixed-indicator R^2 values.
- [Section 4, Table 1] The Discussion states that "progressive references produced weaker—but directionally consistent—positive coefficients (median r = 0.46 for cases, r = 0.43 for deaths)". This is inconsistent with Table 1, which lists progressive-reference correlations in the range 0.75–0.78 for cases and 0.68–0.70 for deaths. This numerical discrepancy should be corrected or explained, because it affects the interpretation of the robustness results.
minor comments (5)
- [Section 2.4] The phrase "the tuning procedure in 2" should read "the tuning procedure in Equation (2)".
- [Eq. (2)] Equation (2) uses S_i for the crude death rate, but the application uses cases per million and deaths per million; please align the notation with the outcomes actually analyzed.
- [Algorithm 1] If any country has zero cumulative cases or deaths, the logarithm in Step 1 is undefined; the manuscript should state how such cases were handled.
- [Table 1 and Table 2] The p-values and confidence intervals in these tables should be accompanied by a caveat that they condition on a reference selected from the same data, or they should be removed in favor of selection-adjusted quantities.
- [References] Reference [19] is missing its article title and venue, and reference [30] lacks an access date; these should be completed.
Circularity Check
Reference-country selection in Eq. (2) tunes PoPStat on the same outcomes it is then reported to 'predict,' so the headline correlation, R2, p-values, and benchmark advantage reflect post-selection maximization.
-
fitted input called prediction
[Section 2.3, Algorithm 1, Eq. (2); results in Section 3.1]
"For each candidate reference pyramid we computed PoPDivergence for all countries and then calculated the Pearson correlation between PoPDivergences and the severity measure. The pyramid that maximised the absolute correlation was selected as the optimal reference country ω∗."
The reported PoPStat–COVID19 values, r=−0.860 for cases and r=−0.821 for deaths, are computed after selecting the reference country by maximizing that same absolute correlation over all 183 countries on the same outcomes. The statistic is therefore the maximum of a 183-candidate search, not an unbiased estimate. Ordinary p<0.001 and the 95% confidence intervals in Table 1 assume a pre-specified reference and are invalid under this selection rule; the R2 values of 0.74 and 0.67 are in-sample fitted maxima presented as predictive strength.
-
fitted input called prediction
[Section 2.4 and Table 1]
"we applied the tuning procedure in 2 to identify the ten candidate pyramids yielding the most extreme negative correlations with log-COVID-19 deaths per million and the ten yielding the most extreme positive correlations."
The robustness analysis chooses only the twenty references by the outcome itself, so the observation that old-skewed references give correlations clustered near −0.85 is built into the selection rule. This does not describe the behavior of typical references and cannot rule out post-selection inflation; the claimed stability is a restatement of the selection criterion rather than independent evidence.
1 more flagged steps
-
fitted input called prediction
[Section 3.3 benchmark; abstract claim]
"Benchmarking against eight standard indicators ... shows that PoPStat-COVID19 surpasses GDP per capita, median age, population density, and several other traditional measures, and outperforms every comparator for fatality burden."
The eight comparator indicators are fixed covariates, whereas the PoPStat reference is tuned on the outcomes before computing its correlation and R2. Comparing an outcome-selected maximum against untuned comparators is unbalanced: the benchmark advantage for fatality burden partly reflects the fitting step rather than superior predictive content.
full rationale
The paper's core quantitative claim reduces to an in-sample selection artifact: Eq. (2) and Algorithm 1 explicitly choose the reference pyramid that maximizes the absolute Pearson correlation with log-transformed COVID-19 cases and deaths on the full 183-country sample, and Section 3.1 then reports that maximized correlation as PoPStat–COVID19. The robustness analysis and the benchmark comparison compound the issue by selecting extreme references by the outcome and by contrasting an outcome-tuned statistic against fixed indicators. The directional finding—older, Malta-like age structures are associated with higher COVID-19 burden—is plausible and consistent with external age-mortality evidence, so not all content is circular. The self-citation to the authors' prior PoPStat paper is transparent and the method is specified in the present paper, so it is not itself load-bearing. The score reflects that the headline effect size, p-values, confidence intervals, and 'explains 74%/67% of variance' statements are fitted maximums and should be reported as such or corrected with post-selection inference.
Assumptions & free parameters
free parameters (2)
- Reference pyramid omega* =
Malta (2019 UN WPP pyramid)
- Set of 20 robustness references =
10 most negative and 10 most positive by correlation with log deaths
assumptions (4)
- domain assumption KL divergence to an old-skewed reference is a meaningful univariate summary of demographic COVID-19 risk.
- domain assumption Cumulative reported cases and deaths per million from OWID are comparable across countries.
- ad hoc to paper The optimized reference can be treated as fixed when computing p-values and confidence intervals.
- domain assumption Age structure drives the correlation independently of development and health-system confounders.
Cite this review
Pith. "Pith review of PoPStat-COVID19: Leveraging Population Pyramids to Quantify Demographic Vulnerability to COVID-19." pith.science (2026). https://pith.science/paper/WMJLI2DM
@misc{pith2026250914213,
  author       = {Pith},
  title        = {Pith review of: PoPStat-COVID19: Leveraging Population Pyramids to Quantify Demographic Vulnerability to COVID-19},
  year         = {2026},
  howpublished = {\url{https://pith.science/paper/WMJLI2DM}},
  note         = {Machine review of arXiv:2509.14213}
}
read the original abstract
Understanding how population age structure shapes COVID-19 burden is crucial for pandemic preparedness, yet common summary measures such as median age ignore key distributional features like skewness, bimodality, and the proportional weight of high-risk cohorts. We extend the PoPStat framework, originally devised to link entire population pyramids with cause-specific mortality by applying it to COVID-19. Using 2019 United Nations World Population Prospects age-sex distributions together with cumulative cases and deaths per million recorded up to 5 May 2023 by Our World in Data, we calculate PoPDivergence (the Kullback-Leibler divergence from an optimised reference pyramid) for 180+ countries and derive PoPStat-COVID19 as the Pearson correlation between that divergence and log-transformed incidence or mortality. Optimisation selects Malta's old-skewed pyramid as the reference, yielding strong negative correlations for cases (r=-0.86, p<0.001, R^2=0.74) and deaths (r=-0.82, p<0.001, R^2=0.67). Sensitivity tests across twenty additional, similarly old-skewed references confirm that these associations are robust to reference choice. Benchmarking against eight standard indicators like gross domestic product per capita, Gini index, Human Development Index, life expectancy at birth, median age, population density, Socio-demographic Index, and Universal Health Coverage Index shows that PoPStat-COVID19 surpasses GDP per capita, median age, population density, and several other traditional measures, and outperforms every comparator for fatality burden. PoPStat-COVID19 therefore provides a concise, distribution-aware scalar for quantifying demographic vulnerability to COVID-19.
Figures


Figures from the paper (1 more)

Reference graph
Works this paper leans on
-
[1]
The universal health coverage coverage index, https://ourworldindata.org/ grapher/universal-health-coverage-index
-
[2]
Birchenall-Jiménez, C.: Centenarians in colombia: a population-based cohort study on the impact of covid 19. Infectio pp. 228–234 (Nov 2024). https://doi.org/10. 22354/24223794.1200, https://doi.org/10.22354/24223794.1200
-
[3]
Bonanad, C., García-Blas, S., Tarazona-Santabalbina, F., Sanchis, J., Bertomeu- González, V., Fácila, L., Ariza, A., Núñez, J., Cordero, A.: The effect of age on PoPStat-COVID19 13 mortality in patients with COVID-19: A meta-analysis with 611,583 subjects. J. Am. Med. Dir. Assoc.21(7), 915–918 (jul 2020)
work page 2020
-
[4]
Jour- nal of Public Health Research9(4) (Oct 2020)
Cabo, J.M.M.: Demographic variables associated with covid-19 mortality. Jour- nal of Public Health Research9(4) (Oct 2020). https://doi.org/10.4081/jphr.2020. 1827, https://doi.org/10.4081/jphr.2020.1827
-
[5]
PLOS ONE15(9), e0238904 (2020)
Dudel, C., Riffe, T.: Monitoring trends and differences in covid-19 case-fatality rates using decomposition methods: Contributions of age structure and age-specific fatality. PLOS ONE15(9), e0238904 (2020). https://doi.org/10.1371/journal. pone.0238904, https://doi.org/10.1371/journal.pone.0238904
doi:10.1371/journal 2020
-
[6]
Edward Livingston, K.B.: Coronavirus disease 2019 (covid-19) in italy. JAMA 323(14), 1335 (Apr 2020). https://doi.org/10.1001/jama.2020.4344, https://doi. org/10.1001/jama.2020.4344
-
[7]
The Lancet 395(10229), 1054–1062 (Mar 2020)
Fei Zhou, T.Y.: Clinical course and risk factors for mortality of adult inpa- tients with covid-19 in wuhan, china: a retrospective cohort study. The Lancet 395(10229), 1054–1062 (Mar 2020). https://doi.org/10.1016/s0140-6736(20) 30566-3, https://doi.org/10.1016/s0140-6736(20)30566-3
-
[8]
Fonseka, T., Wijenayake, B.: Devising popstat: A metric bridging population pyra- mids with global disease mortality (2025), https://arxiv.org/abs/2501.11514
work page Pith review arXiv 2025
Show all 33 references
-
[9]
Proceedings of the National Academy of Sciences of the United States of America117(36), 22035–22041 (2020)
Goldstein, J.R., Lee, R.D.: Demographic perspectives on the mortality of covid- 19 and other epidemics. Proceedings of the National Academy of Sciences of the United States of America117(36), 22035–22041 (2020). https://doi.org/10.1073/ pnas.2006392117, https://doi.org/10.1073...
2020 doi
-
[10]
The Lancet395(10223), 497–506 (Feb 2020)
Huang, C.: Clinical features of patients infected with 2019 novel coronavirus in wuhan, china. The Lancet395(10223), 497–506 (Feb 2020). https://doi.org/10. 1016/s0140-6736(20)30183-5, https://doi.org/10.1016/s0140-6736(20)30183-5
2019 doi
-
[11]
Institute for Health Metrics and Evaluation (IHME): Global health data exchage (2024), https://ghdx.healthdata.org/search/site/SDI
2024
-
[12]
Journal of Ayub Medical College Abbottabad34(3), 581–584 (Jun 2022)
Khan, F.: A wide-base population pyramid and other factors explain low mor- tality in pakistan during covid-19 pandemic. Journal of Ayub Medical College Abbottabad34(3), 581–584 (Jun 2022). https://doi.org/10.55519/jamc-03-9444, https://doi.org/10.55519/jamc-03-9444
2022 doi
-
[13]
Informatics in Medicine Unlocked31, 100994 (2022)
Kofahi, H.M., Swedan, S.F., Khabour, O.F., Nimer, R.M.: Predictors of covid-19 severity and hospitalization: A survey-based study from jor- dan. Informatics in Medicine Unlocked31, 100994 (2022). https://doi. org/https://doi.org/10.1016/j.imu.2022.100994, https://www.sciencedi...
2022
-
[14]
https://doi.org/10.1101/2020
Lin Fu, J.F.: Influence factors of death risk among covid-19 patients in wuhan, china: a hospital-based case-cohort study (2020). https://doi.org/10.1101/2020. 03.13.20035329, https://doi.org/10.1101/2020.03.13.20035329
2020 doi
-
[15]
Our World in Data (2020), https://ourworldindata.org/coronavirus
Mathieu, E., Ritchie, H., Rodés-Guirao, L., Appel, C., Gavrilov, D., Gi- attino, C., Hasell, J., Macdonald, B., Dattani, S., Beltekian, D., Ortiz- Ospina, E., Roser, M.: Covid-19 pandemic. Our World in Data (2020), https://ourworldindata.org/coronavirus
2020
-
[16]
Mueller, A.L., McNamara, M.S., Sinclair, D.A.: Why does COVID-19 dispropor- tionately affect older people? Aging (Albany NY)12(10), 9959–9981 (may 2020)
2020
-
[17]
Na- ture598(7880), 338–341 (Oct 2021)
Pei, S.: Burden and characteristics of covid-19 in the united states during 2020. Na- ture598(7880), 338–341 (Oct 2021). https://doi.org/10.1038/s41586-021-03914-4, https://doi.org/10.1038/s41586-021-03914-4
2020 doi
-
[18]
Science of The Total Environment755, 142523 (Feb 2021)
Perone, G.: The determinants of covid-19 case fatality rate (cfr) in the italian regions and provinces: An analysis of environmental, demographic, and health- care factors. Science of The Total Environment755, 142523 (Feb 2021). https: 14 B. Wijenayake et al. //doi.org/10.1016...
2021
-
[19]
The Lancet Pub- lic Health5(5), e261–e270 (May 2020)
Prem, K.: The effect of control strategies to reduce social mixing on outcomes of the covid-19 epidemic in wuhan, china: a modelling study. The Lancet Pub- lic Health5(5), e261–e270 (May 2020). https://doi.org/10.1016/s2468-2667(20) 30073-6, https://doi.org/10.1016/s2468-2667(...
2020 doi
-
[20]
Chest158(1), 97–105 (Jul2020).https://doi.org/10.1016/j.chest.2020.04.010,https://doi.org/10.1016/j
Ruchong Chen, W.L.: Risk factors of fatal outcome in hospitalized subjects with coronavirus disease 2019 from a nationwide analysis in china. Chest158(1), 97–105 (Jul2020).https://doi.org/10.1016/j.chest.2020.04.010,https://doi.org/10.1016/j. chest.2020.04.010
2019 doi
-
[21]
Stephanie Bialek, E.B.: Severe outcomes among patients with coronavirus disease 2019 (covid-19) — united states, february 12–march 16, 2020. MMWR. Morbidity and Mortality Weekly Report69(12), 343–346 (Mar 2020). https://doi.org/10. 15585/mmwr.mm6912e2, https://doi.org/10.15585...
2019 doi
-
[22]
Annals of Internal Medicine173, 714–720 (2020)
Sudharsanan, N., Didzun, O., Bärnighausen, T., Vollmer, S.: The contribution of the age distribution of cases to covid-19 case fatality across countries: A nine- country demographic study. Annals of Internal Medicine173, 714–720 (2020). https://doi.org/10.7326/M20-2973, https:...
2020 doi
-
[23]
worldbank.org/indicator/NY.GDP.PCAP.KD
The World Bank: Gdp per capita (constant 2015 us$) (2024), https://data. worldbank.org/indicator/NY.GDP.PCAP.KD
2024
-
[24]
worldbank.org/indicator/SI.POV.GINI
The World Bank: Gini index (world bank estimate) (2024), https://data. worldbank.org/indicator/SI.POV.GINI
2024
-
[25]
km of land area) (2024), https://data.worldbank.org/indicator/EN.POP.DNST
The World Bank: Population density (people per sq. km of land area) (2024), https://data.worldbank.org/indicator/EN.POP.DNST
2024
-
[26]
un.org/wpp/downloads, most used datasets
United Nations, Department of Economic and Social Affairs, Population Division: Worldpopulationprospects2024:Standardprojections(2024),https://population. un.org/wpp/downloads, most used datasets. Accessed: [Insert Date]
2024
-
[27]
United Nations Development Programme: Human development report data center (2024), https://hdr.undp.org/data-center
2024
-
[28]
World Health Organization: Life expectancy at birth (years) (2024), https://www.who.int/data/gho/data/indicators/indicator-details/GHO/ life-expectancy-at-birth-(years)
2024
-
[29]
https://www.who
World Health Organization: News – world health organization. https://www.who. int/news (2025), accessed: 2025-06-22
2025
-
[30]
World Health Organization: Who covid-19 dashboard (2025), https://covid19.who. int
2025
-
[31]
JAMA In- ternal Medicine180(7), 934 (Jul 2020)
Wu, C.: Risk factors associated with acute respiratory distress syndrome and death in patients with coronavirus disease 2019 pneumonia in wuhan, china. JAMA In- ternal Medicine180(7), 934 (Jul 2020). https://doi.org/10.1001/jamainternmed. 2020.0994, https://doi.org/10.1001/jam...
2019
-
[32]
Aging12(24), 24570–24578 (Dec 2020)
Xue-Qiang Wang, G.S.: Association between ageing population, median age, life expectancy and mortality in coronavirus disease (covid-19). Aging12(24), 24570–24578 (Dec 2020). https://doi.org/10.18632/aging.104193, https://doi.org/ 10.18632/aging.104193
2020 doi
-
[33]
Zhou, C., Åsa M. Wheelock, Zhang, C., Sundin, A., Chen, Z., Jørgensen, N.P., Song, J., Glaab, E., Jørgensen, P.S.: Country-specific determinants for covid-19 case fatality rate and response strategies from a global perspective: an interpretable machine learning framework. Popu...
2024 doi
Reviewed August 15, 2026 · model on record in the stance chip above.
Discussion (0). Continue with ORCID to comment.