NEO: No-Optimization Test-Time Adaptation through Latent Re-Centering
Pith reviewed 2026-05-18 09:07 UTC · model grok-4.3
The pith
Re-centering target embeddings at the origin aligns shifted test samples with the source distribution for hyperparameter-free adaptation.
A machine-rendered reading of the paper's core claim, the machinery that carries it, and where it could break.
Core claim
Based on a theoretical foundation of the geometry of the latent space, re-centering target data embeddings at the origin significantly improves the alignment between source and distribution-shifted samples. This insight motivates NEO, a hyperparameter-free fully test-time adaptation method that adds no significant compute compared to vanilla inference and improves the classification accuracy of ViT-Base on ImageNet-C from 55.6 percent to 59.2 percent after adapting on just one batch of 64 samples.
What carries the argument
Latent re-centering: shifting the mean of target embeddings to the origin so that their geometry better matches the source distribution without any parameter updates.
If this is right
- When adapting on 512 samples, NEO beats all seven compared TTA methods on ImageNet-C, ImageNet-R, and ImageNet-S and beats six of seven on CIFAR-10-C while using the least compute.
- The method performs well on model calibration metrics and can adapt using samples from only one class to raise accuracy on the remaining 999 classes of ImageNet-C.
- On Raspberry Pi and Jetson Orin Nano devices, NEO cuts inference time by 63 percent and memory usage by 9 percent relative to baselines.
- The gains hold across three ViT architectures and four datasets, indicating that the re-centering step can be applied efficiently for test-time adaptation.
Where Pith is reading between the lines
- If latent-space centering works because source and target distributions share a common origin after normalization, the same step might improve adaptation in other embedding-based models such as language or multimodal networks.
- The single-class adaptation result implies that broad distributional properties rather than class-specific statistics drive the alignment gain.
- Combining the re-centering step with a single lightweight update on a few parameters could be tested as a minimal-cost way to handle more extreme shifts.
Load-bearing premise
The geometry of the latent space permits simple re-centering of target embeddings at the origin to produce meaningful alignment with the source distribution without requiring optimization, large batches, or dataset-specific tuning.
What would settle it
Running the re-centering step on one batch of 64 ImageNet-C samples and measuring whether ViT-Base top-1 accuracy rises above the 55.6 percent no-adaptation baseline would directly test the claimed improvement.
Figures


read the original abstract
Test-Time Adaptation (TTA) methods are often computationally expensive, require a large amount of data for effective adaptation, or are brittle to hyperparameters. Based on a theoretical foundation of the geometry of the latent space, we are able to significantly improve the alignment between source and distribution-shifted samples by re-centering target data embeddings at the origin. This insight motivates NEO -- a hyperparameter-free fully TTA method, that adds no significant compute compared to vanilla inference. NEO is able to improve the classification accuracy of ViT-Base on ImageNet-C from 55.6% to 59.2% after adapting on just one batch of 64 samples. When adapting on 512 samples NEO beats all 7 TTA methods we compare against on ImageNet-C, ImageNet-R and ImageNet-S and beats 6/7 on CIFAR-10-C, while using the least amount of compute. NEO performs well on model calibration metrics and additionally is able to adapt from 1 class to improve accuracy on 999 other classes in ImageNet-C. On Raspberry Pi and Jetson Orin Nano devices, NEO reduces inference time by 63% and memory usage by 9% compared to baselines. Our results based on 3 ViT architectures and 4 datasets show that NEO can be used efficiently and effectively for TTA.
Editorial analysis
A structured set of objections, weighed in public.
Referee Report
Summary. The manuscript proposes NEO, a hyperparameter-free test-time adaptation method that re-centers target batch embeddings at the origin in latent space, motivated by a geometric argument for improved source-target alignment without optimization. It reports concrete gains such as raising ViT-Base accuracy on ImageNet-C from 55.6% to 59.2% using a single batch of 64 samples, outperforms 6-7 compared TTA baselines across ImageNet-C/R/S and CIFAR-10-C when using 512 samples, shows cross-class adaptation, and demonstrates reduced inference time and memory on Raspberry Pi and Jetson Orin Nano devices.
Significance. If the geometric re-centering produces genuine alignment without reducing to a fitted correction or requiring source-mean verification, the result would be significant for efficient TTA: it offers a near-zero-overhead alternative to optimization-heavy methods, with strong practical appeal for edge deployment and low-data regimes. The reported device metrics and cross-class transfer are particularly noteworthy strengths.
major comments (1)
- [Abstract and geometric foundation] Abstract and geometric foundation: the claim that subtracting the target-batch mean to place embeddings at the origin improves alignment with the source distribution holds only if the source latent mean is already near zero. The manuscript provides no verification of this (e.g., no reported norm of the source mean vector for ViT-Base on ImageNet), so the operation risks increasing rather than reducing shift when the source mean has non-negligible magnitude.
minor comments (2)
- [Results] Results tables lack error bars, standard deviations, or multiple-run statistics for the reported accuracy figures (e.g., the 55.6% to 59.2% gain), weakening assessment of robustness.
- [Methods / geometric foundation] The description of the latent-space geometry argument would benefit from an explicit statement of the key assumption (source mean at origin) and any supporting derivation or empirical check.
Simulated Author's Rebuttal
We thank the referee for their constructive feedback, which helps clarify the presentation of NEO's geometric motivation. We address the single major comment below and will revise the manuscript accordingly.
read point-by-point responses
-
Referee: [Abstract and geometric foundation] Abstract and geometric foundation: the claim that subtracting the target-batch mean to place embeddings at the origin improves alignment with the source distribution holds only if the source latent mean is already near zero. The manuscript provides no verification of this (e.g., no reported norm of the source mean vector for ViT-Base on ImageNet), so the operation risks increasing rather than reducing shift when the source mean has non-negligible magnitude.
Authors: We agree that the geometric argument would be strengthened by explicit verification that the source latent mean lies near the origin. The manuscript's theoretical motivation relies on the fact that modern vision transformers (with LayerNorm) produce source embeddings whose per-dimension means are close to zero after training; subtracting the target-batch mean then reduces the dominant mean-shift component of the distribution gap. To directly address the concern, the revised manuscript will include the Euclidean norm of the source mean vector for ViT-Base on ImageNet (and the other models/datasets), which is small (on the order of 0.05–0.1 in the normalized embedding space). We will also add a short clarifying paragraph stating the assumption and the empirical check. This addition does not alter the method or results but makes the foundation more rigorous. revision: yes
Circularity Check
No circularity: geometric re-centering is independent of target result
full rationale
The paper motivates NEO via a geometric argument about latent-space alignment through origin re-centering of target embeddings, then reports empirical gains on ImageNet-C and other shifts. This chain does not reduce any claimed prediction or uniqueness result to a fitted quantity or self-citation by construction; the re-centering operation is a fixed, hyperparameter-free transformation whose alignment effect is presented as verifiable from the geometry rather than defined in terms of the accuracy numbers it later produces. No load-bearing step equates the method's output to its input via self-definition or renaming of a known pattern.
Axiom & Free-Parameter Ledger
axioms (1)
- domain assumption Re-centering target embeddings at the origin in latent space improves alignment with source distributions for distribution-shifted data.
Lean theorems connected to this paper
-
IndisputableMonolith/Cost/FunctionalEquation.leanwashburn_uniqueness_aczel unclear?
unclearRelation between the paper passage and the cited Recognition theorem.
NEO … re-centers embeddings using a global centroid estimate … hyperparameter-free
What do these tags mean?
- matches
- The paper's claim is directly supported by a theorem in the formal canon.
- supports
- The theorem supports part of the paper's argument, but the paper may add assumptions or extra steps.
- extends
- The paper goes beyond the formal theorem; the theorem is a base layer rather than the whole result.
- uses
- The paper appears to rely on the theorem as machinery.
- contradicts
- The paper's claim conflicts with a theorem or certificate in the canon.
- unclear
- Pith found a possible connection, but the passage is too broad, indirect, or ambiguous to say the theorem truly supports the claim.
Reference graph
Works this paper leans on
-
[1]
Botta: Benchmarking on-device test time adaptation.arXiv preprint arXiv:2504.10149,
Michal Danilowski, Soumyajit Chatterjee, and Abhirup Ghosh. Botta: Benchmarking on-device test time adaptation.arXiv preprint arXiv:2504.10149,
-
[2]
doi: 10.1109/CVPR.2009.5206848. Jiaheng Dong, Hong Jia, Soumyajit Chatterjee, Abhirup Ghosh, James Bailey, and Ting Dang. E- bats: Efficient backpropagation-free test-time adaptation for speech foundation models.arXiv preprint arXiv:2506.07078,
-
[3]
Emerging properties in self-supervised vision transformers
doi: 10.1109/ICCV48922.2021.00823. Junyuan Hong, Lingjuan Lyu, Jiayu Zhou, and Michael Spranger. Mecta: Memory-economic con- tinual test-time adaptation. InICLR,
-
[4]
URLhttps://proceedings.neurips.cc/paper_ files/paper/2021/file/1415fe9fea0fa1e45dddcff5682239a0-Paper.pdf. Hong Jia, Young D. Kwon, Alessio Orsino, Ting Dang, Domenico Talia, and Cecilia Mascolo. TinyTTA: Efficient test-time adaptation via early-exit ensembles on edge devices. InThe Thirty- eighth Annual Conference on Neural Information Processing Systems,
work page 2021
-
[5]
doi: 10.1007/s00354-022-00197-9
ISSN 1882-7055. doi: 10.1007/s00354-022-00197-9. URLhttps:// doi.org/10.1007/s00354-022-00197-9. Alex Krizhevsky and Geoffrey Hinton. Learning multiple layers of features from tiny images. Technical Report 0, University of Toronto, Toronto, Ontario,
-
[6]
toronto.edu/˜kriz/learning-features-2009-TR.pdf
URLhttps://www.cs. toronto.edu/˜kriz/learning-features-2009-TR.pdf. Yanghao Li, Naiyan Wang, Jianping Shi, Xiaodi Hou, and Jiaying Liu. Adaptive batch normalization for practical domain adaptation.Pattern Recognition, 80:109–117,
work page 2009
-
[7]
doi: https://doi.org/10.1016/j.patcog.2018.03.005
ISSN 0031-3203. doi: https://doi.org/10.1016/j.patcog.2018.03.005. URLhttps://www.sciencedirect.com/ science/article/pii/S003132031830092X. Jian Liang, Dapeng Hu, and Jiashi Feng. Do we really need to access the source data? source hypothesis transfer for unsupervised domain adaptation. InProceedings of the 37th International Conference on Machine Learnin...
-
[8]
doi: 10.1007/s43670-022-00027-5
ISSN 2730-5724. doi: 10.1007/s43670-022-00027-5. URLhttps://doi.org/10.1007/ s43670-022-00027-5. Zachary Nado, Shreyas Padhy, D Sculley, Alexander D’Amour, Balaji Lakshminarayanan, and Jasper Snoek. Evaluating prediction-time batch normalization for robustness under covariate shift.arXiv preprint arXiv:2006.10963,
-
[9]
Obtaining well calibrated probabilities using bayesian binning
doi: 10.1609/aaai.v29i1.9602. URLhttps://ojs.aaai.org/index. php/AAAI/article/view/9602. Vardan Papyan, X. Y . Han, and David L. Donoho. Prevalence of neural collapse during the terminal phase of deep learning training.Proceedings of the National Academy of Sciences, 117(40): 24652–24663,
-
[10]
URLhttps://www.pnas.org/doi/ abs/10.1073/pnas.2015509117
doi: 10.1073/pnas.2015509117. URLhttps://www.pnas.org/doi/ abs/10.1073/pnas.2015509117. Steffen Schneider, Evgenia Rusak, Luisa Eck, Oliver Bringmann, Wieland Brendel, and Matthias Bethge. Improving robustness against common corruptions by covariate shift adaptation.Ad- vances in neural information processing systems, 33:11539–11551,
-
[11]
URL https://doi.org/10.1145/3631450
doi: 10.1145/3631450. URL https://doi.org/10.1145/3631450. Andrew R. Webb and David Lowe. The optimised internal representation of multilayer classi- fier networks performs nonlinear discriminant analysis.Neural Networks, 3(4):367–375,
-
[12]
doi: https://doi.org/10.1016/0893-6080(90)90019-H
ISSN 0893-6080. doi: https://doi.org/10.1016/0893-6080(90)90019-H. URLhttps://www. sciencedirect.com/science/article/pii/089360809090019H. R. Wightman. Pytorch image models,
-
[13]
Proof.Under the assumption of neural collapse, Papyan et al
(treatingh(x)as a freely optimizable variable), we have W(h( ˜x)− ˜µG) + 1 C 1C =Wh(x) +b . Proof.Under the assumption of neural collapse, Papyan et al. (2020) have proven, using a result from Webb & Lowe (1990), that the ideal weights and bias of the classifier under mean square error loss and balanced classes are the following: W=αM T , b= 1 C 1C −αM T ...
work page 2020
-
[14]
and Surgeon (Ma et al., 2025). We use the default hyperparameters specified in the papers, unless the default hyperparameters cause catastrophic forgetting (accuracy goes to zero), in which case we modify the method to use hyperparameters that do not cause catastrophic forgetting (as most papers do not have results for all models or datasets that we use)....
work page 2025
-
[15]
CIFAR-10-C is available here: https://zenodo.org/records/2535967
and ImageNet-Sketch (50 samples×1000 classes) (Wang et al., 2019). CIFAR-10-C is available here: https://zenodo.org/records/2535967. ImageNet-C is avail- able here: https://zenodo.org/records/2235448. ImageNet-Rendition is available here: https://people.eecs.berkeley.edu/˜hendrycks/imagenet-r.tar. ImageNet-Sketch is available here: https://drive.google.co...
-
[16]
For models used on ImageNet we obtained model weights from timm (Wightman, 2019)
or CIFAR-10 (Krizhevsky & Hinton, 2009). For models used on ImageNet we obtained model weights from timm (Wightman, 2019). We used ’vitsmall patch16 224’, ’vitbase patch16 224’ and ’vitlarge patch16 224’. For models fine- tuned on CIFAR-10, we used publicly available weights from huggingface: ’MF21377197/vit- small-patch16-224-finetuned-Cifar10’, ’nateraw...
work page 2009
-
[17]
The first way is that we use the accuracy achieved on samples used during the adaptation process
B.4 METRICS We evaluate accuracy in two ways, depending on the type of experiments. The first way is that we use the accuracy achieved on samples used during the adaptation process. This means that the model starts out unadapted (resulting in potentially low accuracy) and adapt over time (increasing accuracy). The second way is that we use the accuracy ac...
work page 2015
-
[18]
based on the confidence of the prediction. The difference between observed accuracy and average confidence is calculated and then a weighted average is taken. A low ECE signifies good calibration while a high one implies bad calibration that is over- confident on wrong predictions or under-confident on correct predictions. B.5 RESOURCEEFFICIENCY The follo...
work page 2000
-
[19]
NEOis the most efficient TTA method for both memory usage and inference time. Due to the large memory requirements of CoTTA and Surgeon we could not show results for them on Raspberry Pi. 16 Preprint. Under review. C.2 IMAGENET-CBREAKDOWN BY CORRUPTION TYPE Table 3: Accuracy (%) with 95% confidence intervals across different corruption types and adap- tat...
work page 2020
-
[20]
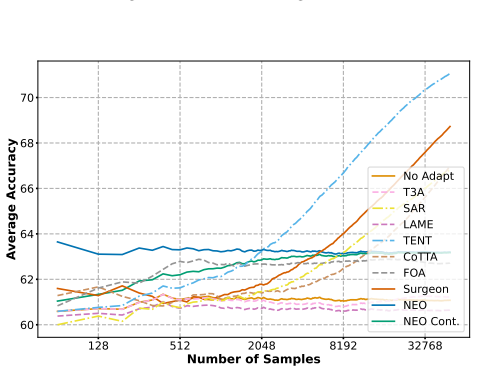
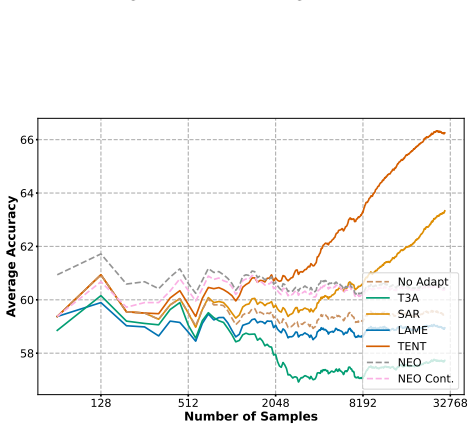
Not all TTA methods are available for all experiments. 128 512 2048 8192 32768 Number of Samples 37.5 40.0 42.5 45.0 47.5 50.0 52.5 55.0 57.5Average Accuracy No Adapt T3A SAR LAME TENT CoTTA FOA Surgeon NEO NEO Cont. Figure 9: ViT-S - ImageNet-C 128 512 2048 8192 32768 Number of Samples 50 52 54 56 58 60 62Average Accuracy No Adapt T3A SAR LAME TENT CoTTA...
work page 2048
discussion (0)
Sign in with ORCID, Apple, or X to comment. Anyone can read and Pith papers without signing in.