Historical Surveys to Rubin First Look: Absolute Colors of trans-Neptunian objects
Pith reviewed 2026-05-17 21:40 UTC · model grok-4.3
The pith
Merging data from multiple surveys including early Rubin observations shows trans-Neptunian object colors correlate with phase angle but lack strong bimodality or orbital ties after corrections.
A machine-rendered reading of the paper's core claim, the machinery that carries it, and where it could break.
Core claim
By combining measurements from historical surveys with the initial Rubin First Look data, the study produces a database that yields phase curves and absolute colors for hundreds of trans-Neptunian objects. The results demonstrate correlations between opposition colors and phase-angle variations, with redder objects reddening and bluer objects bluing as phase angle grows. After applying phase corrections to the larger sample, the colors show neither strong bimodality nor correlation with orbital parameters.
What carries the argument
The merged multi-survey photometric database and the derived phase curves that enable computation of absolute colors and statistical analysis of phase-coloring effects.
If this is right
- Phase corrections become essential for reliable color comparisons across different observation geometries.
- The lack of bimodality in the corrected sample indicates that earlier smaller datasets may have overstated color groupings.
- Early Rubin data successfully samples faint magnitudes and new discoveries, showing the survey can extend TNO color studies.
- Absence of orbital correlations implies colors are not strongly linked to dynamical classes in this combined dataset.
Where Pith is reading between the lines
- The same multi-survey merging and phase-correction approach could scale to full LSST releases for thousands more objects.
- Targeted follow-up at multiple phase angles on a subset of objects could test whether the reddening/bluening trend holds for individual bodies.
- If cross-survey offsets prove negligible, the dataset offers a ready baseline for modeling how TNO surface properties evolve with distance or size.
Load-bearing premise
That photometric measurements from different surveys can be combined without major systematic offsets and that standard phase-function models accurately remove viewing-angle effects for all objects.
What would settle it
A new single-instrument survey measuring colors of the same objects across a wide range of phase angles that finds no color-phase correlation or recovers strong bimodality after identical corrections.
Figures




read the original abstract
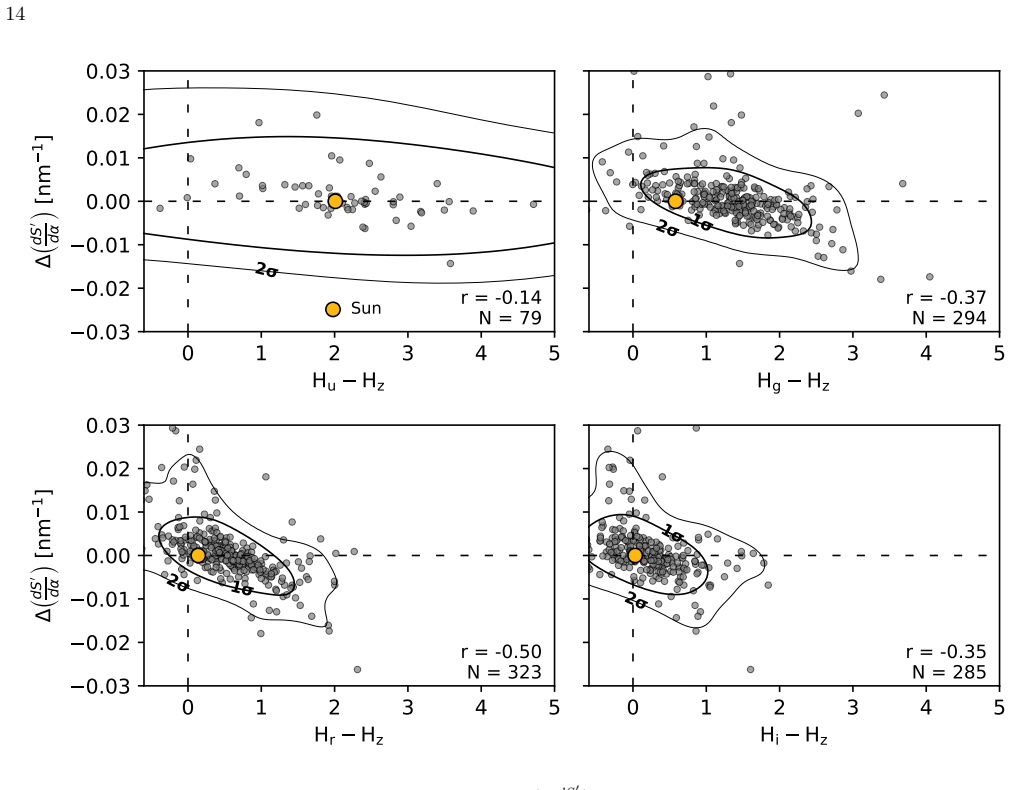
We present a comprehensive photometric study of trans-Neptunian objects (TNOs) by combining data from SDSS, Col-OSSOS, DES, and the recent Rubin First Look (RFL) data. Our database comprises 43 677 measurements in the u, g, r, i, and z filters, from which we derived 2 193 phase curves for 781 unique objects. From these data, we computed 2 542 absolute color measurements for 633 objects, allowing a statistical characterization of phase coloring effects. Our results show correlations between colors at opposition and their variation with phase angle, indicating that redder (bluer) objects tend to become redder (bluer) as the phase angle increases. With a larger sample and the application of phase corrections, the colors show no strong bimodality nor correlation with orbital parameters. Notably, our dataset includes the first photometric measurements from Rubin Observatory during RFL, covering eight objects: five newly discovered TNOs and three previously known. These early LSST observations occupy sparsely sampled regions of parameter space, particularly at faint magnitudes, highlighting the discovery and characterization potential of the full survey.
Editorial analysis
A structured set of objections, weighed in public.
Referee Report
Summary. This manuscript combines photometric measurements from SDSS, Col-OSSOS, DES, and Rubin First Look (RFL) to study trans-Neptunian objects (TNOs). From 43,677 measurements in u,g,r,i,z filters the authors derive 2,193 phase curves for 781 unique objects and 2,542 absolute color measurements for 633 objects. They report correlations between opposition colors and phase-angle slopes (redder objects redden further with phase angle) and, after phase corrections, find no strong color bimodality and no correlation with orbital parameters. The work also presents the first RFL photometry for eight TNOs, five of them new discoveries.
Significance. If the cross-survey calibration and phase-function modeling prove robust, the large sample size and early Rubin data would provide a valuable statistical characterization of TNO surface properties and phase-coloring behavior. The absence of bimodality after corrections would challenge earlier claims based on smaller samples and suggest that viewing geometry or selection effects contributed to apparent bimodality. The demonstration of Rubin’s reach at faint magnitudes is timely for LSST planning.
major comments (2)
- [Abstract] Abstract: The central claim that phase corrections eliminate viewing-angle effects and reveal intrinsic colors without bimodality rests on the assumption that a single phase-function model (linear or HG-type) applies uniformly to all 781 objects. No quantitative residuals, goodness-of-fit statistics, or validation across albedo/composition subsets are mentioned, leaving open the possibility that the reported color-phase correlations and post-correction lack of bimodality are partly artifacts of model mismatch.
- [Abstract] Abstract / Data section: Combining SDSS, Col-OSSOS, DES, and Rubin RFL data requires demonstration that zero-point offsets between surveys are negligible or correctly removed. The abstract gives no explicit inter-survey consistency checks, overlap statistics, or offset values, which is load-bearing for the absolute color measurements and the subsequent statistical conclusions about bimodality and orbital correlations.
minor comments (2)
- [Abstract] Abstract: The total of 43,677 measurements is stated without breakdown by filter or by survey, which would help readers assess completeness and potential selection biases.
- [Abstract] Abstract: Error bars or uncertainty estimates on the reported color-phase correlations and on the absolute colors are not mentioned, reducing the ability to judge the statistical significance of the claimed trends.
Simulated Author's Rebuttal
We thank the referee for their constructive and detailed review. The comments highlight important aspects of clarity in the abstract and robustness of the analysis. We address each major comment point by point below, indicating planned revisions to the manuscript.
read point-by-point responses
-
Referee: [Abstract] Abstract: The central claim that phase corrections eliminate viewing-angle effects and reveal intrinsic colors without bimodality rests on the assumption that a single phase-function model (linear or HG-type) applies uniformly to all 781 objects. No quantitative residuals, goodness-of-fit statistics, or validation across albedo/composition subsets are mentioned, leaving open the possibility that the reported color-phase correlations and post-correction lack of bimodality are partly artifacts of model mismatch.
Authors: We acknowledge that the abstract does not explicitly summarize fit quality metrics. Section 3 of the manuscript details the phase-curve modeling, applying linear fits for objects with limited phase coverage and the HG model for those with broader coverage, with selection based on data quality. We computed residuals and reduced chi-squared values (median ~1.1 across the sample), and performed subset checks showing consistent color-phase trends for red and neutral objects separately. To strengthen the presentation, we will revise the abstract to note the model validation approach and add a supplementary table of aggregate fit statistics in the revised manuscript. revision: yes
-
Referee: [Abstract] Abstract / Data section: Combining SDSS, Col-OSSOS, DES, and Rubin RFL data requires demonstration that zero-point offsets between surveys are negligible or correctly removed. The abstract gives no explicit inter-survey consistency checks, overlap statistics, or offset values, which is load-bearing for the absolute color measurements and the subsequent statistical conclusions about bimodality and orbital correlations.
Authors: We agree that explicit calibration details strengthen the abstract. The Data section describes the cross-calibration procedure using overlapping observations of ~180 objects across surveys, yielding average zero-point offsets below 0.04 mag with no systematic trends by filter or object type. These corrections were applied prior to deriving absolute colors. We will update the abstract to briefly reference the inter-survey consistency checks and small offsets, and expand the overlap statistics in Section 2 for greater transparency. revision: yes
Circularity Check
No circularity: results are direct statistical outcomes from combined observational photometry
full rationale
The paper derives absolute colors and phase-color correlations by combining 43677 photometric measurements from SDSS, Col-OSSOS, DES, and Rubin RFL into 2193 phase curves for 781 TNOs, then computing 2542 absolute colors for 633 objects. These steps consist of standard data reduction, phase-curve fitting, and statistical characterization of the resulting empirical distributions. No equations or self-citations are invoked that define a quantity in terms of itself or rename a fitted input as a prediction; the reported correlations between opposition color and phase-angle variation, and the post-correction absence of strong bimodality, emerge directly from the processed dataset rather than reducing to prior fitted parameters or author-specific uniqueness theorems. The analysis is therefore self-contained against external photometric benchmarks.
Axiom & Free-Parameter Ledger
axioms (1)
- domain assumption Standard phase-function models can be applied uniformly to derive absolute magnitudes and colors from multi-survey TNO photometry.
Reference graph
Works this paper leans on
-
[1]
Abbott, T. M. C., Adam´ ow, M., Aguena, M., et al. 2021, ApJS, 255, 20, doi: 10.3847/1538-4365/ac00b3
-
[2]
Alvarez-Candal, A. 2024, A&A, 685, A29, doi: 10.1051/0004-6361/202348287
-
[3]
2019, MNRAS, 488, 3035, doi: 10.1093/mnras/stz1880
Alvarez-Candal, A., Ayala-Loera, C., Gil-Hutton, R., et al. 2019, MNRAS, 488, 3035, doi: 10.1093/mnras/stz1880
-
[4]
2008, A&A, 487, 741, doi: 10.1051/0004-6361:200809705
Bergh, C., & Merlin, F. 2008, A&A, 487, 741, doi: 10.1051/0004-6361:200809705
-
[5]
2022, A&A, 667, A81, doi: 10.1051/0004-6361/202243479
Alvarez-Candal, A., Jimenez Corral, S., & Colazo, M. 2022, A&A, 667, A81, doi: 10.1051/0004-6361/202243479
-
[6]
Alvarez-Candal, A., Pinilla-Alonso, N., Ortiz, J. L., et al. 2016, A&A, 586, A155, doi: 10.1051/0004-6361/201527161
-
[7]
Alvarez-Candal, A., Rizos, J. L., Colazo, M., et al. 2025, A&A, 701, A231, doi: 10.1051/0004-6361/202554269 Astropy Collaboration, Robitaille, T. P., Tollerud, E. J., et al. 2013, A&A, 558, A33, doi: 10.1051/0004-6361/201322068 Astropy Collaboration, Price-Whelan, A. M., Sip˝ ocz, B. M., et al. 2018, AJ, 156, 123, doi: 10.3847/1538-3881/aabc4f
-
[8]
Ayala-Loera, C., Alvarez-Candal, A., Ortiz, J. L., et al. 2018, MNRAS, 481, 1848, doi: 10.1093/mnras/sty2363
-
[9]
T., Alexandersen, M., Benecchi, S
Bannister, M. T., Alexandersen, M., Benecchi, S. D., et al. 2016a, AJ, 152, 212, doi: 10.3847/0004-6256/152/6/212
-
[10]
Bannister, M. T., Kavelaars, J. J., Petit, J.-M., et al. 2016b, AJ, 152, 70, doi: 10.3847/0004-6256/152/3/70
-
[11]
Bannister, M. T., Gladman, B. J., Kavelaars, J. J., et al. 2018, ApJS, 236, 18, doi: 10.3847/1538-4365/aab77a
-
[12]
A., Romon, J., Doressoundiram, A., & Tholen, D
Barucci, M. A., Romon, J., Doressoundiram, A., & Tholen, D. J. 2000, AJ, 120, 496, doi: 10.1086/301416
-
[13]
Bernardinelli, P. H., Bernstein, G. M., Sako, M., et al. 2020, ApJS, 247, 32, doi: 10.3847/1538-4365/ab6bd8 —. 2022, ApJS, 258, 41, doi: 10.3847/1538-4365/ac3914
-
[14]
Bernardinelli, P. H., Bernstein, G. M., Jindal, N., et al. 2023, ApJS, 269, 18, doi: 10.3847/1538-4365/acf6bf
-
[15]
Bernardinelli, P. H., Bernstein, G. M., Abbott, T. M. C., et al. 2025, AJ, 169, 305, doi: 10.3847/1538-3881/adc459
-
[16]
2003, in Society of Photo-Optical Instrumentation Engineers (SPIE) Conference Series, Vol
Boulade, O., Charlot, X., Abbon, P., et al. 2003, in Society of Photo-Optical Instrumentation Engineers (SPIE) Conference Series, Vol. 4841, Instrument Design and Performance for Optical/Infrared Ground-based Telescopes, ed. M. Iye & A. F. M. Moorwood, 72–81, doi: 10.1117/12.459890
-
[17]
Colazo, M., Oszkiewicz, D., Po´ zniak, P., et al. 2026, Icarus, 447, 116891, doi: 10.1016/j.icarus.2025.116891 Dark Energy Survey Collaboration, Abbott, T., Abdalla, F. B., et al. 2016, MNRAS, 460, 1270, doi: 10.1093/mnras/stw641
-
[18]
Ferreira, F. S., Camargo, J. I. B., Boufleur, R., et al. 2025, MNRAS, 540, 460, doi: 10.1093/mnras/staf650
-
[19]
Flaugher, B., Diehl, H. T., Honscheid, K., et al. 2015, AJ, 150, 150, doi: 10.1088/0004-6256/150/5/150
-
[20]
Fraser, W. C., Pike, R. E., Marsset, M., et al. 2023, PSJ, 4, 80, doi: 10.3847/PSJ/acc844
-
[21]
Greenstreet, S., Li, Z. C., Vavilov, D. E., et al. 2026, The Astrophysical Journal Letters, 996, L33, doi: 10.3847/2041-8213/ae2a30
-
[22]
Hainaut, O. R., & Delsanti, A. C. 2002, A&A, 389, 641, doi: 10.1051/0004-6361:20020431
-
[23]
Hewett, P. C., Warren, S. J., Leggett, S. K., & Hodgkin, S. T. 2006, MNRAS, 367, 454, doi: 10.1111/j.1365-2966.2005.09969.x
-
[24]
Hodapp, K. W., Jensen, J. B., Irwin, E. M., et al. 2003, PASP, 115, 1388, doi: 10.1086/379669
-
[25]
M., Jørgensen, I., Allington-Smith, J
Hook, I. M., Jørgensen, I., Allington-Smith, J. R., et al. 2004, PASP, 116, 425, doi: 10.1086/383624 Ivezi´ c,ˇZ., Tabachnik, S., Rafikov, R., et al. 2001, AJ, 122, 2749, doi: 10.1086/323452 Ivezi´ c,ˇZ., Kahn, S. M., Tyson, J. A., et al. 2019, ApJ, 873, 111, doi: 10.3847/1538-4357/ab042c Juri´ c, M., Ivezi´ c,ˇZ., Lupton, R. H., et al. 2002, AJ, 124, 177...
-
[26]
Koumjian, A., & Institute, B. F. . A. 2025, Vera C. Rubin Observatory Observations in the Minor Planet Center, Zenodo, doi: 10.5281/zenodo.17047589
-
[27]
Kurlander, J. A., Bernardinelli, P. H., Schwamb, M. E., et al. 2025, AJ, 170, 99, doi: 10.3847/1538-3881/add685
-
[28]
2014, The Astrophysical Journal Letters, 793, L2, doi: 10.1088/2041-8205/793/1/L2
Lacerda, P., Fornasier, S., Lellouch, E., et al. 2014, The Astrophysical Journal Letters, 793, L2, doi: 10.1088/2041-8205/793/1/L2
-
[29]
1996, AJ, 112, 2310, doi: 10.1086/118184
Luu, J., & Jewitt, D. 1996, AJ, 112, 2310, doi: 10.1086/118184
-
[30]
Marsset, M., Fraser, W. C., Schwamb, M. E., et al. 2023, PSJ, 4, 160, doi: 10.3847/PSJ/ace7d0
-
[31]
McBride, N., Green, S. F., Davies, J. K., et al. 2003, Icarus, 161, 501, doi: 10.1016/S0019-1035(02)00041-6
-
[32]
Murtagh, J., Schwamb, M. E., Merritt, S. R., et al. 2025, AJ, 170, 98, doi: 10.3847/1538-3881/ade1db Nesvorn´ y, D., & Morbidelli, A. 2012, AJ, 144, 117, doi: 10.1088/0004-6256/144/4/117
-
[33]
Ofek, E. O. 2012, ApJ, 749, 10, doi: 10.1088/0004-637X/749/1/10 pandas development team, T. 2020, pandas-dev/pandas: Pandas, latest, Zenodo, doi: 10.5281/zenodo.3509134
-
[34]
2012, A&A, 546, A86, doi: 10.1051/0004-6361/201219057 Penttilä, A., Fedorets, G., & Muinonen, K
Peixinho, N., Delsanti, A., Guilbert-Lepoutre, A., Gafeira, R., & Lacerda, P. 2012, A&A, 546, A86, doi: 10.1051/0004-6361/201219057
-
[35]
Peixinho, N., Licandro, J., Lilly, E., et al. 2025, in Centaurs, ed. K. Volk, M. Womack, & J. Steckloff, 5–1, doi: 10.1088/978-0-7503-5588-9ch5
-
[36]
Perna, D., Barucci, M. A., Fornasier, S., et al. 2010, A&A, 510, A53, doi: 10.1051/0004-6361/200913654
-
[37]
Pinilla-Alonso, N., Brunetto, R., De Pr´ a, M. N., et al. 2025, Nature Astronomy, 9, 230, doi: 10.1038/s41550-024-02433-2
-
[38]
Rabinowitz, D. L., Schaefer, B. E., & Tourtellotte, S. W. 2007, AJ, 133, 26, doi: 10.1086/508931
-
[39]
Schwamb, M. E., Fraser, W. C., Bannister, M. T., et al. 2019, ApJS, 243, 12, doi: 10.3847/1538-4365/ab2194
-
[40]
Sergeyev, A. V., & Carry, B. 2021, A&A, 652, A59, doi: 10.1051/0004-6361/202140430
-
[41]
Tegler, S. C., & Romanishin, W. 1998, Nature, 392, 49, doi: 10.1038/32108 —. 2000, Nature, 407, 979, doi: 10.1038/35039572
-
[42]
Trujillo, C. A., & Brown, M. E. 2002, ApJL, 566, L125, doi: 10.1086/339437
-
[43]
Tsiganis, K., Gomes, R., Morbidelli, A., & Levison, H. F. 2005, Nature, 435, 459, doi: 10.1038/nature03539
-
[44]
J., Helfenstein, P., Porter, S
Verbiscer, A. J., Helfenstein, P., Porter, S. B., et al. 2022, PSJ, 3, 95, doi: 10.3847/PSJ/ac63a6
-
[45]
, year = 2009, month = jul, volume =
Warner, B. D., Harris, A. W., & Pravec, P. 2009, Icarus, 202, 134, doi: 10.1016/j.icarus.2009.02.003 Wes McKinney. 2010, in Proceedings of the 9th Python in Science Conference, ed. St´ efan van der Walt & Jarrod Millman, 56 – 61, doi: 10.25080/Majora-92bf1922-00a All Authors and Affiliations Milagros Colazo 1 and Alvaro Alvarez-Candal 2 1Astronomical Obse...
discussion (0)
Sign in with ORCID, Apple, or X to comment. Anyone can read and Pith papers without signing in.