Enabling Predictive Maintenance in District Heating Substations: A Labelled Dataset and Fault Detection Evaluation Framework based on Service Data
Pith reviewed 2026-05-17 22:30 UTC · model grok-4.3
The pith
Public dataset and framework enable early fault detection in district heating substations days before customer reports.
A machine-rendered reading of the paper's core claim, the machinery that carries it, and where it could break.
Core claim
The paper establishes a public labelled dataset from district heating substations across two manufacturers, including time series data annotated with fault disturbances, maintenance actions, normal-event examples, and detailed metadata. It defines an evaluation approach based on normal-behaviour accuracy, eventwise F-score, and earliness metrics, and provides baseline results from the EnergyFaultDetector tool that reach 0.98 accuracy and 0.83 F-score while detecting 60% of faults with an average lead time of 3 to 5 days prior to customer reports. The framework also incorporates root cause analysis via feature attribution to help interpret anomalies.
What carries the argument
The labelled dataset of operational time series validated against service reports, combined with the EnergyFaultDetector for anomaly detection and ARCANA for feature attribution in autoencoders.
If this is right
- Consistent benchmarks become possible for comparing different fault detection methods in district heating.
- Operators gain tools to interpret anomalies and identify root causes of faults.
- Early detection supports actions that reduce return temperatures and improve system efficiency.
- Reproducible development of predictive maintenance methods is facilitated for energy systems.
Where Pith is reading between the lines
- Similar labelled datasets could be created for other types of energy infrastructure to broaden predictive maintenance applications.
- Combining this approach with additional sensor data or weather information might further increase the lead time for fault detection.
- The framework could serve as a template for standardizing evaluations in related industrial anomaly detection tasks.
Load-bearing premise
Service reports provide accurate, complete, and timely ground-truth labels for faults and normal events that align with the recorded operational time series.
What would settle it
A study that cross-validates a sample of the service report labels against independent on-site inspections or sensor verifications would falsify the framework if many labels are found to be incorrect or incomplete.
Figures


read the original abstract
Early detection of faults in district heating substations is imperative to reduce return temperatures and enhance efficiency. However, progress in this domain has been hindered by the limited availability of public, labelled datasets. We present an open-source framework combining a service report validated public dataset, an evaluation method based on accuracy, reliability, and earliness, and baseline results implemented with EnergyFaultDetector, an open-source Python framework developed for automated anomaly detection in operational data from energy systems. The dataset contains time series of operational data from 93 substations across two manufacturers, annotated with a list of disturbances due to faults and maintenance actions, a set of normal-event examples and detailed fault metadata. We evaluate the EnergyFaultDetector using three metrics: accuracy for recognising normal behaviour, an eventwise F-score for reliable fault detection with few false alarms, and earliness for early detection. The framework also supports root cause analysis using ARCANA, a feature-attribution method for autoencoders. We demonstrate three use cases to assist operators in interpreting anomalies and identifying underlying faults. The models achieve high normal-behaviour accuracy (0.98) and eventwise F-score (beta = 0.5) of 0.83 and could detect 60% of the faults in the dataset before the customer reported a problem, with an average lead time of 3 to 5 days. Integrating an open dataset, metrics, open-source code, and baselines establishes a reproducible, fault-centric benchmark with operationally meaningful evaluation, enabling consistent comparison and development of early fault detection and diagnosis methods for district heating substations.
Editorial analysis
A structured set of objections, weighed in public.
Referee Report
Summary. The manuscript presents a publicly released labelled dataset of operational time series from 93 district heating substations (two manufacturers), annotated via service reports with faults, maintenance actions, and normal-event examples. It introduces an evaluation framework using three metrics—normal-behaviour accuracy, eventwise F-score (beta = 0.5), and earliness—and reports baseline results from the open-source EnergyFaultDetector: 0.98 accuracy, 0.83 F-score, and detection of 60 % of faults prior to customer reports with 3–5 days average lead time. The work also demonstrates root-cause analysis via the ARCANA feature-attribution method and three operator-oriented use cases.
Significance. Release of a real-world, service-report-validated dataset together with reproducible code and an operationally oriented evaluation protocol would fill a documented gap in public benchmarks for fault detection in district heating. If the label-validation and split procedures are documented, the concrete performance numbers and earliness results could serve as a reproducible reference point for subsequent methods.
major comments (2)
- [Dataset annotation and evaluation metrics] The earliness metric and the claim that 60 % of faults are detected before customer reports (3–5 days lead time) rest on the unverified assumption that service-report timestamps accurately reflect fault onset in the sensor time series. No cross-checks against raw data patterns, independent verification, or quantification of reporting lag are described; this directly undermines the reliability of both the eventwise F-score (0.83) and the pre-report detection percentage.
- [Experimental setup and baseline evaluation] The experimental section provides no information on data-cleaning steps, train–test split strategy, handling of class imbalance, or selection criteria for the normal-event examples. These choices are load-bearing for the reported 0.98 normal-behaviour accuracy and 0.83 F-score; without them the numerical results cannot be reproduced or interpreted.
minor comments (2)
- [Results] Clarify whether the 93 substations are partitioned by manufacturer in the reported metrics or whether results are aggregated; this affects generalisability claims.
- [Dataset description] The abstract states 'detailed fault metadata'; the manuscript should explicitly list the metadata fields and show how they are used by ARCANA for root-cause analysis.
Simulated Author's Rebuttal
We thank the referee for the constructive comments that highlight important aspects of reproducibility and metric reliability. We address each major comment below and will incorporate clarifications and additional details in the revised manuscript.
read point-by-point responses
-
Referee: [Dataset annotation and evaluation metrics] The earliness metric and the claim that 60 % of faults are detected before customer reports (3–5 days lead time) rest on the unverified assumption that service-report timestamps accurately reflect fault onset in the sensor time series. No cross-checks against raw data patterns, independent verification, or quantification of reporting lag are described; this directly undermines the reliability of both the eventwise F-score (0.83) and the pre-report detection percentage.
Authors: We agree that the earliness results depend on service-report timestamps as proxies for fault onset and that the manuscript does not describe explicit cross-checks against raw sensor patterns or quantify reporting lag. The annotation process is based on operator service reports that record the date and nature of reported issues, which we treat as the operational ground truth. In the revision we will add a new subsection on label provenance that discusses potential delays between fault occurrence and customer reporting, provides any available metadata on report timing, and includes illustrative examples of how report timestamps were aligned with the time-series data. We will also explicitly note this as a limitation of the current dataset. revision: yes
-
Referee: [Experimental setup and baseline evaluation] The experimental section provides no information on data-cleaning steps, train–test split strategy, handling of class imbalance, or selection criteria for the normal-event examples. These choices are load-bearing for the reported 0.98 normal-behaviour accuracy and 0.83 F-score; without them the numerical results cannot be reproduced or interpreted.
Authors: We concur that the current experimental description lacks the necessary implementation details for reproducibility. The manuscript presents the overall evaluation framework and baseline numbers but omits concrete choices regarding preprocessing, splitting, and example selection. In the revised version we will expand the relevant sections to document: (i) data-cleaning procedures (missing-value handling, outlier detection, and resampling), (ii) the train–test partitioning strategy (including whether splits are performed at the substation or temporal level), (iii) any techniques used to address class imbalance, and (iv) the explicit criteria applied when selecting normal-event examples. These additions will allow independent reproduction of the reported accuracy and eventwise F-score. revision: yes
Circularity Check
Empirical dataset release and benchmark evaluation with no circular derivation
full rationale
The paper releases a labelled dataset of operational time series from 93 substations annotated via service reports, then reports baseline performance of an open-source anomaly detection framework using standard metrics (normal-behaviour accuracy, eventwise F-score, and earliness). These metrics are computed by direct comparison of model outputs against the external service-report labels; no equations, fitted parameters, or self-citation chains reduce the reported numbers (0.98 accuracy, 0.83 F-score, 60 % pre-report detections) to quantities defined inside the paper itself. The contribution is therefore self-contained as an empirical benchmark rather than a closed derivation.
Axiom & Free-Parameter Ledger
axioms (1)
- domain assumption Service reports accurately reflect the occurrence, timing, and nature of faults and maintenance actions in the operational time series.
Lean theorems connected to this paper
-
IndisputableMonolith/Foundation/RealityFromDistinction.leanreality_from_one_distinction unclear?
unclearRelation between the paper passage and the cited Recognition theorem.
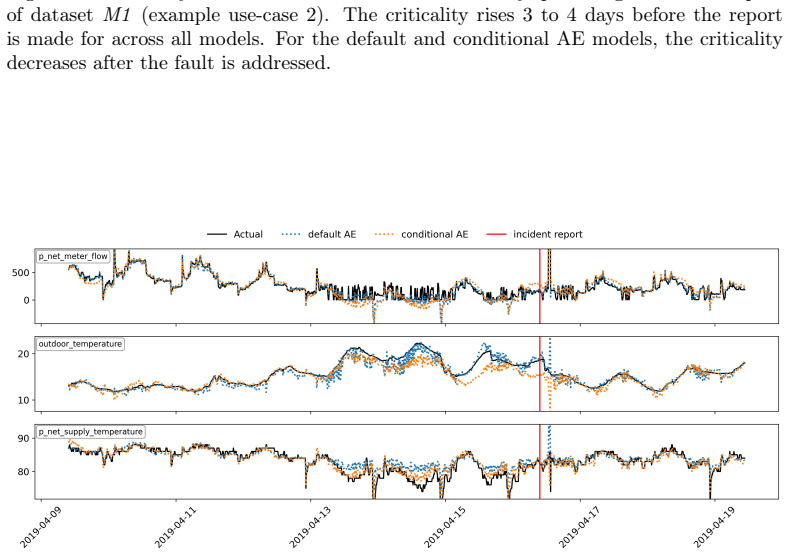
The EnergyFaultDetector uses an AE as NBM... anomaly score... Mahalanobis distance... criticality counter C... eventwise F0.5... Earliness E = max(0, min(1, (treport - tdetect)/W))
What do these tags mean?
- matches
- The paper's claim is directly supported by a theorem in the formal canon.
- supports
- The theorem supports part of the paper's argument, but the paper may add assumptions or extra steps.
- extends
- The paper goes beyond the formal theorem; the theorem is a base layer rather than the whole result.
- uses
- The paper appears to rely on the theorem as machinery.
- contradicts
- The paper's claim conflicts with a theorem or certificate in the canon.
- unclear
- Pith found a possible connection, but the passage is too broad, indirect, or ambiguous to say the theorem truly supports the claim.
Reference graph
Works this paper leans on
-
[1]
H. Lund, Renewable heating strategies and their consequences for stor- age and grid infrastructures comparing a smart grid to a smart energy systems approach, Energy 151 (2018) 94–102. doi:https://doi.org/ 10.1016/j.energy.2018.03.010
-
[2]
H. Lund, S. Werner, R. Wiltshire, S. Svendsen, J. E. Thorsen, F. Hvelplund, B. V. Mathiesen, 4th generation district heating (4gdh), Energy 68 (2014) 1–11. doi:10.1016/j.energy.2014.02.089
-
[3]
H. Gadd, S. Werner, Achieving low return temperatures from district heating substations, Applied Energy 136 (2014) 59–67. URL:https: //linkinghub.elsevier.com/retrieve/pii/S0306261914009696. doi:10.1016/j.apenergy.2014.09.022
-
[4]
Agora Energiewende, Prognos, GEF, Wärmenetze – klimaneutral, wirtschaftlich und bezahlbar, Technical Report 335/07-S-2024/DE, Agora Energiewende; Prognos; GEF, 2024. Autor:innen: Dr. Noha Saad; Nils Thamling; Mohammad Alkasabreh (Prognos); Susanne Ochse (GEF). Letzte Überarbeitung: 30. Dezember 2024. Projekt: Wärmenetze: klimaneutral, wirtschaftlich und bezahlbar
work page 2024
-
[5]
M. Neumayer, D. Stecher, S. Grimm, A. Maier, D. Bücker, J. Schmidt, Fault and anomaly detection in district heating sub- stations: A survey on methodology and data sets, Energy 276 (2023) 127569. URL:https://linkinghub.elsevier.com/retrieve/ pii/S0360544223009635. doi:10.1016/j.energy.2023.127569
-
[6]
S. Månsson, I. Lundholm Benzi, M. Thern, R. Salenbien, K. Sernhed, P.- O. Johansson Kallioniemi, A taxonomy for labeling deviations in district heating customer data, Smart Energy 2 (2021) 100020. doi:https:// doi.org/10.1016/j.segy.2021.100020. 27
-
[7]
S. Månsson, P.-O. Johansson Kallioniemi, M. Thern, T. Van Oevelen, K. Sernhed, Faults in district heating customer installations and ways to approach them: Experiences from swedish utilities, Energy 180 (2019) 163–174. doi:https://doi.org/10.1016/j.energy.2019.04.220
-
[8]
H. Gadd, S. Werner, Fault detection in district heating sub- stations, Applied Energy 157 (2015) 51–59. URL:https: //linkinghub.elsevier.com/retrieve/pii/S0306261915009010. doi:10.1016/j.apenergy.2015.07.061
-
[9]
doi:https://doi.org/10.1016/ j.energy.2022.123529
D.S.Østergaard, K.M.Smith, M.Tunzi, S.Svendsen, Low-temperature operation of heating systems to enable 4th generation district heating: A review, Energy 248 (2022) 123529. doi:https://doi.org/10.1016/ j.energy.2022.123529
-
[10]
P. Leoni, R. Geyer, R.-R. Schmidt, Developing innovative busi- ness models for reducing return temperatures in district heat- ing systems: Approach and first results, Energy 195 (2020) 116963. URL:https://linkinghub.elsevier.com/retrieve/pii/ S0360544220300700. doi:10.1016/j.energy.2020.116963
-
[11]
E. Guevara Bastidas, S. Faulstich, H. Dittmer, M. Neumayer, G. S. Mohan, K. Sercan-Calismaz, F. Hosenfelder, T. Gle- newinkel, K. Fischer-Florschütz, A. Cadenbach, Prioritisa- tion of faults in district heating substations: Towards predic- tive maintenance and optimised operation, Energy 333 (2025) 137210. URL:https://linkinghub.elsevier.com/retrieve/pii/...
-
[12]
J. Van Dreven, V. Boeva, S. Abghari, H. Grahn, J. Al Koussa, E. Mo- toasca, Intelligent Approaches to Fault Detection and Diagnosis in Dis- trict Heating: Current Trends, Challenges, and Opportunities, Elec- tronics 12 (2023) 1448. URL:https://www.mdpi.com/2079-9292/12/ 6/1448. doi:10.3390/electronics12061448
-
[13]
C. Gück, C. M. A. Roelofs, S. Faulstich, CARE to Compare: A Real- World Benchmark Dataset for Early Fault Detection in Wind Turbine Data, Data 9 (2024) 138. URL:https://www.mdpi.com/2306-5729/ 9/12/138. doi:10.3390/data9120138. 28
-
[14]
S. Månsson, K. Davidsson, P. Lauenburg, M. Thern, Automated Sta- tistical Methods for Fault Detection in District Heating Customer In- stallations, Energies 12 (2018) 113. URL:https://www.mdpi.com/ 1996-1073/12/1/113. doi:10.3390/en12010113
-
[15]
F. Theusch, P. Klein, R. Bergmann, W. Wilke, W. Bock, A. We- ber, Fault Detection and Condition Monitoring in District Heat- ing Using Smart Meter Data, PHM Society European Conference 6 (2021) 11. URL:https://papers.phmsociety.org/index.php/phme/ article/view/2786. doi:10.36001/phme.2021.v6i1.2786
-
[16]
D. Leiria, K. H. Andersen, S. P. Melgaard, H. Johra, A. Marszal- Pomianowska, M. S. Piscitelli, A. Capozzoli, M. Z. Pomianowski, To- wards automated fault detection and diagnosis in district heating cus- tomers: generation and analysis of a labeled dataset with ground truth, in: ProceedingsofBuildingSimulation2023: 18thConferenceofIBPSA, 2023, pp. 3615 – ...
-
[17]
E. Calikus, S. Nowaczyk, A. Sant’Anna, H. Gadd, S. Werner, A data-driven approach for discovering heat load patterns in dis- trict heating, Applied Energy 252 (2019) 113409. URL:https: //linkinghub.elsevier.com/retrieve/pii/S0306261919310839. doi:10.1016/j.apenergy.2019.113409
-
[18]
Simulation-based testing to improve safety of autonomous robots,
S. Abghari, V. Boeva, J. Brage, C. Johansson, H. Grahn, N. Laves- son, Higher Order Mining for Monitoring District Heating Substa- tions, in: 2019 IEEE International Conference on Data Science and Advanced Analytics (DSAA), IEEE, Washington, DC, USA, 2019, pp. 382–391. URL:https://ieeexplore.ieee.org/document/8964173/. doi:10.1109/DSAA.2019.00053
-
[19]
S. Farouq, S. Byttner, M.-R. Bouguelia, N. Nord, H. Gadd, Large-scale monitoring of operationally diverse district heating substations: A reference-group based approach, Engineering Ap- plications of Artificial Intelligence 90 (2020) 103492. URL:https: //linkinghub.elsevier.com/retrieve/pii/S0952197620300117. doi:10.1016/j.engappai.2020.103492. 29
-
[20]
F. Zhang, H. Fleyeh, Anomaly Detection of Heat Energy Usage in Dis- trict Heating Substations Using LSTM based Variational Autoencoder Combined with Physical Model, in: 2020 15th IEEE Conference on Industrial Electronics and Applications (ICIEA), IEEE, Kristiansand, Norway, 2020, pp. 153–158. URL:https://ieeexplore.ieee.org/ document/9248108/. doi:10.1109...
-
[21]
Y. Choi, S. Yoon, Autoencoder-driven fault detection and di- agnosis in building automation systems: Residual-based and la- tent space-based approaches, Building and Environment 203 (2021) 108066. URL:https://linkinghub.elsevier.com/retrieve/ pii/S0360132321004686. doi:10.1016/j.buildenv.2021.108066
-
[22]
M. Vallée, T. Wissocq, Y. Gaoua, N. Lamaison, Genera- tion and evaluation of a synthetic dataset to improve fault de- tection in district heating and cooling systems, Energy 283 (2023) 128387. URL:https://linkinghub.elsevier.com/retrieve/ pii/S0360544223017814. doi:10.1016/j.energy.2023.128387
- [23]
-
[24]
J. Van Dreven, V. Boeva, S. Abghari, H. Grahn, J. Al Koussa, A systematic approach for data generation for intelligent fault de- tection and diagnosis in District Heating, Energy 307 (2024) 132711. URL:https://linkinghub.elsevier.com/retrieve/pii/ S036054422402485X. doi:10.1016/j.energy.2024.132711
-
[25]
D. Stecher, L. Ziegltrum, P. Reiprich, C. Fuchs, A. Maier, J. Schmidt, Neural network synthetic dataset generation for fault detection in district heating substations, Smart Energy 20 (2025) 100206. URL:https://linkinghub.elsevier.com/retrieve/ pii/S2666955225000346. doi:10.1016/j.segy.2025.100206
-
[26]
C. M. Roelofs, M.-A. Lutz, S. Faulstich, S. Vogt, Autoencoder-based anomaly root cause analysis for wind turbines, Energy and AI 4 (2021) 100065. URL:https://linkinghub.elsevier.com/retrieve/ pii/S2666546821000197. doi:10.1016/j.egyai.2021.100065. 30
discussion (0)
Sign in with ORCID, Apple, or X to comment. Anyone can read and Pith papers without signing in.